

PM Images
Thesis
If you are reading this, you must have heard all the cautionary disclosures about leverage in general and also the specific risks surrounding leveraged funds like the ProShares UltraPro S&P500 (NYSEARCA:UPRO). And I am not here to tell you that these warnings are false, or that you should ignore them. They are 100% true.
The purpose of this article is twofold. First, it will analyze the differences between UPRO and its unleveraged counterpart the SPDR S&P 500 Trust ETF (NYSEARCA:SPY). So potential investors understand both funds better. Even though the discussion here is anchored on the comparison between UPRO and SPY, the observations and conclusions are general enough so that they are applicable in general to other leveraged funds too.
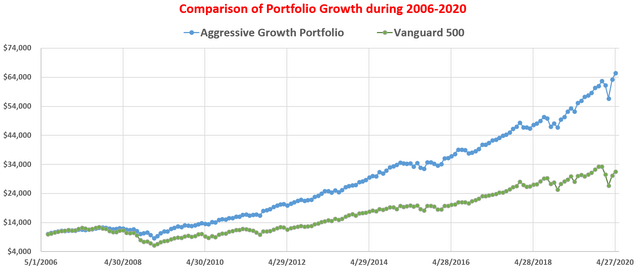
And second, this article will also use UPRO and SPY to demonstrate how we use leveraged funds in a disciplined way to generate alpha. It is a strategy that we have been executing in our real-money portfolio for aggressive growth in the long term. I assume readers are already familiar with the common risks of using leveraged funds like UPRO. These risks include magnified losses, higher fees, lack of dividends, et al.
And based on this assumption, I will start with the first pitfall that is less mentioned: volatility decay. And because it is less often mentioned, it could be more dangerous to investors who are unaware. The chart below shows a real-time example of the decay in the past 4 months or so. as you can see from the following chart, between April 26, 2022, and today, the unleveraged SPY essentially went nowhere (its price changed only by about 0.8%). However, the leveraged UPRO lost more than 9%, a lot more than 3x of the loss suffered by SPY. Of course, part of this extra loss is due to the higher fees, but the dominant part of it is due to volatility decay – the real biggest enemy in the use of the leveraged fund in my view.
Next, we will examine its cause and our strategies against it.
Seeking Alpha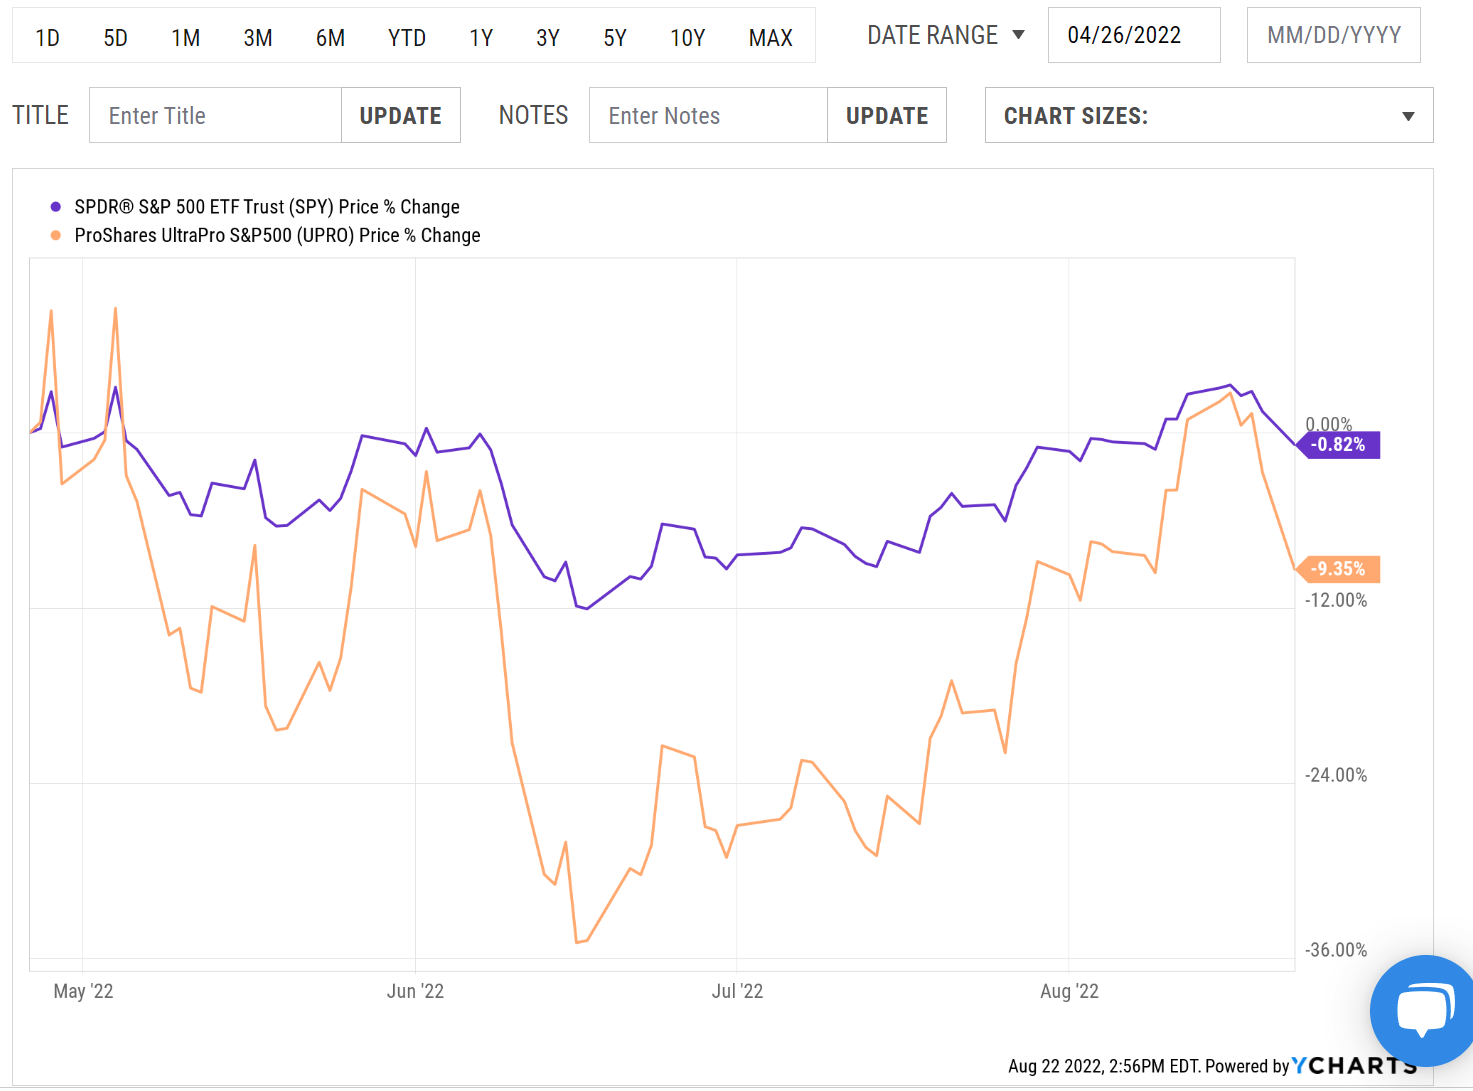
Basic fund information
SPY needs little introduction. So here I will just focus on UPRO and only use SPY for comparison and contrasting purposes. In a nutshell, UPRO provides 3x leveraged daily exposure to SPY (or the S&P 500 index). Note that I am also including ProShares Ultra S&P500 (SSO) here to provide a broader context (which provides a 2x leverage). UPRO has an AUM of $2.4B only, much smaller than SPY. However, due to its nature as a tactical trading tool, it trades with excellent liquidity and very narrow spreads.
You will notice that UPRO charges a much higher expense ratio of 0.91%, compared to SPY’s 0.09%. So compared to SPY, there is a fee hurdle of about 0.8% per year – not negligible over the long run. But as aforementioned, it is only a small contributor to the differences in price actions over the past 4 months.
And the difference is caused by volatility decay as detailed next.
Source: Vanguard.com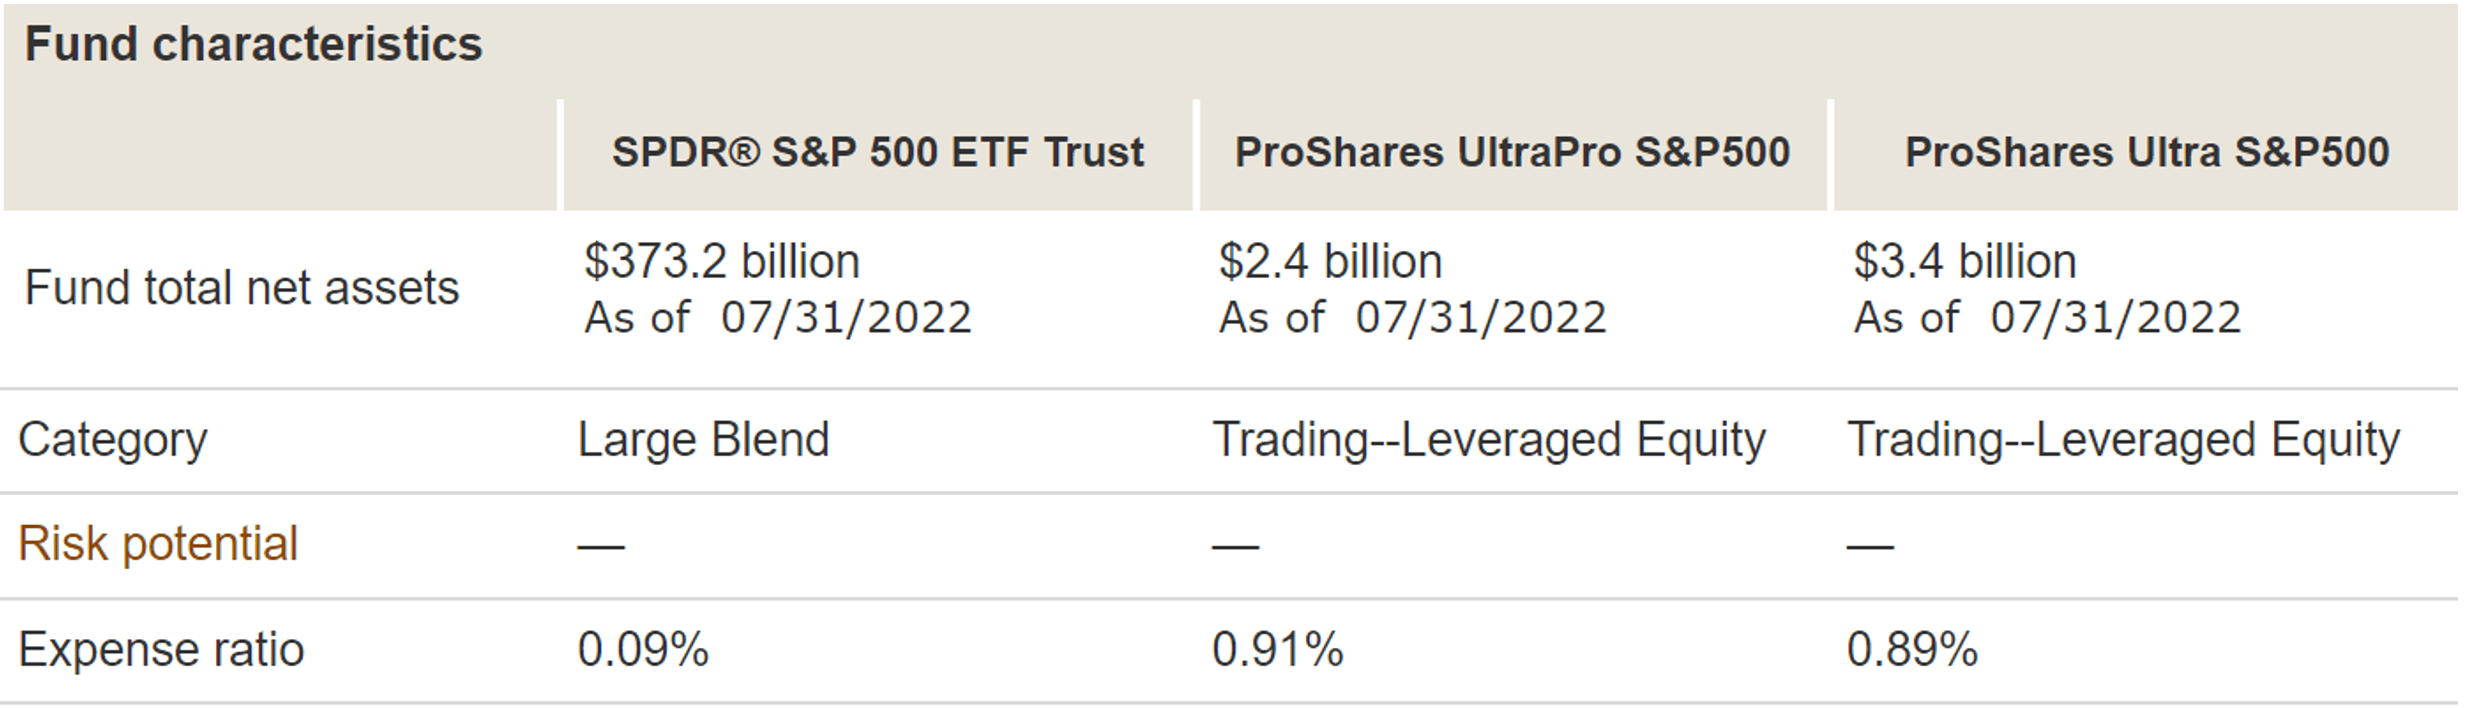
UPRO, SPY, and volatility decay
To provide the target leveraged exposure, UPRO holds a series of swaps as you can see from the following chart. In contrast, an unleveraged fund like SPY holds shares of the component stocks in the S&P 500 index. And the swaps in UPRO are designed to provide the target leverage on a DAILY BASIS only, as emphasized by the fund description itself upfront. Note that the emphases came from the original quote.
This leveraged ProShares ETF seeks a return that is 3x the return of its underlying benchmark (target) for a single day, as measured from one NAV calculation to the next. Due to the compounding of daily returns, holding periods of greater than one day can result in returns that are significantly different than the target return, and ProShares’ returns over periods other than one day will likely differ in amount and possibly direction from the target return for the same period.
Source: Vanguard.com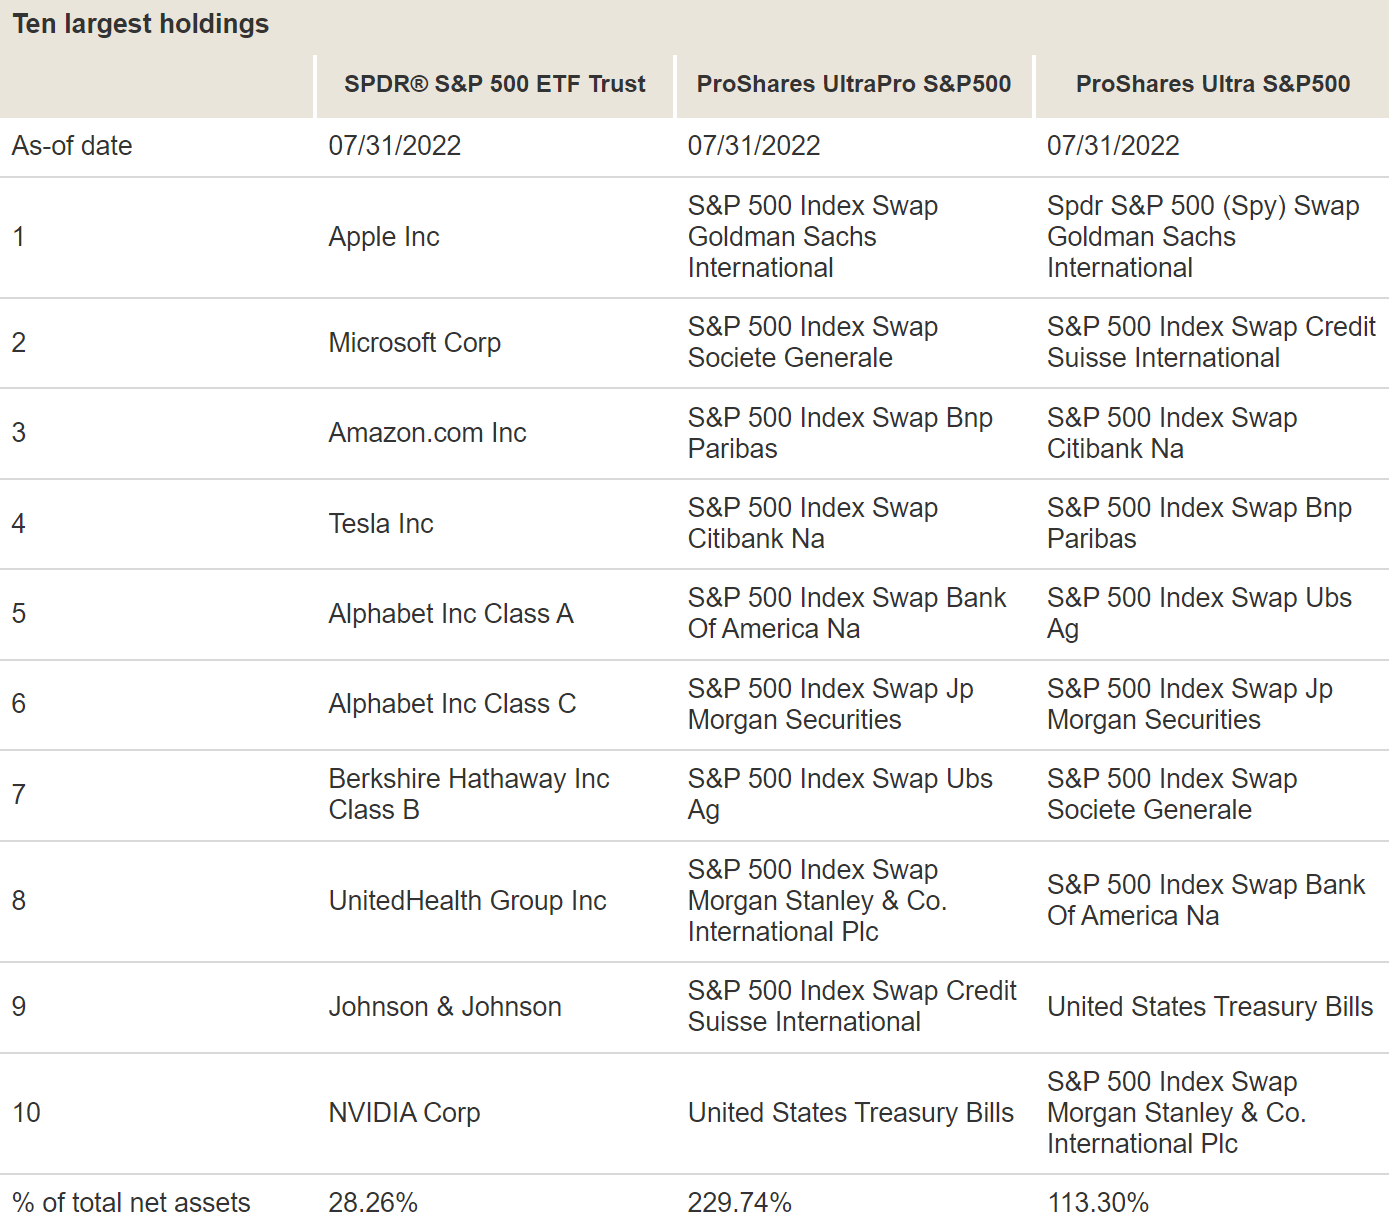
For readers new to the concept of volatility decay, a simple example will illustrate the essential points immediately. I’ve explained the example in much more details in an earlier article if readers are interested. And here I will be brief:
First, all securities suffer volatility including the “unleveraged” fund such as SPY. I put “unleveraged” in the quotation mark because an unleveraged fund is really a fund with a leverage ratio of 1x. Suppose the price of SPY goes up 2% on day 1 and goes down 2% on day 2. At the end of day 2, SPY’s price would NOT return to its original price. It would go DOWN by 0.04%. It is purely math – because (1+2%)*(1-2%) is less than 1 by 0.04%. And 0.04% is the volatility decay.
Second, leverage ETFs suffer volatility decay more severely. Following the above example, the 3x leveraged UPRO would go up 6% on day 1 and go down 6% on day 2. As a result, its price at the end of day 2 would be 0.36% lower than its original price. Because (1+6%)*(1-6%) is less than 1 by 0.36%. Now that 0.36% is not only larger than 0.04%, it is larger by 9x, not 3x.
And this explains the price actions in the first figure that opened the article. When such volatility decays are accumulated over an extended period of time (say 4 months), it can become more pronounced as the figure shows. Recall that SPY has lost only 0.8% during the ~4 months period, but UPRO has lost more than 9% in the same period.
However, next, you will see that math is fair and offers a volatility boost to counter the decay.
Volatility boost
In the above examples, we’ve seen that in a range-bound or a declining market, volatility will cause decay and the decay is more severe in a leveraged fund. But in a market that enjoys a one-way rally, volatility will provide a boost and the boost is larger in a leveraged fund too (have I already mentioned that math is fair?). You can use a simple hypothetical example similar to those used above to verify the boost.
Here I will use the chart below to show a real example during the past 3 years (August 19, 2019, to the present day). As you can see from this chart, SPY went up 15.8% between August 19, 2019, and Feb 19, 2020. During this period, UPRO went up 52.8%. You can see that UPRO went up more than 3x than SPY even without a calculator – thanks to the volatility boost.
And you can see the 3x leverage only applies on a daily basis clearly here too. Over an extended period, the fees and volatility decay/boosts would severely distort the leverage and cause it to deviate from 3x. For example, in the past 3 years, SPY has returned a total of 41% and UPRO only 69%, nowhere near the 3x target tracking.
By this time, it should have become clear that the trick with using leverage ETF is all about striking an optimal balance between controlling the risk of volatility decay and reaping the benefits of volatility boost. And we will discuss our method immediately below.
Seeking Alpha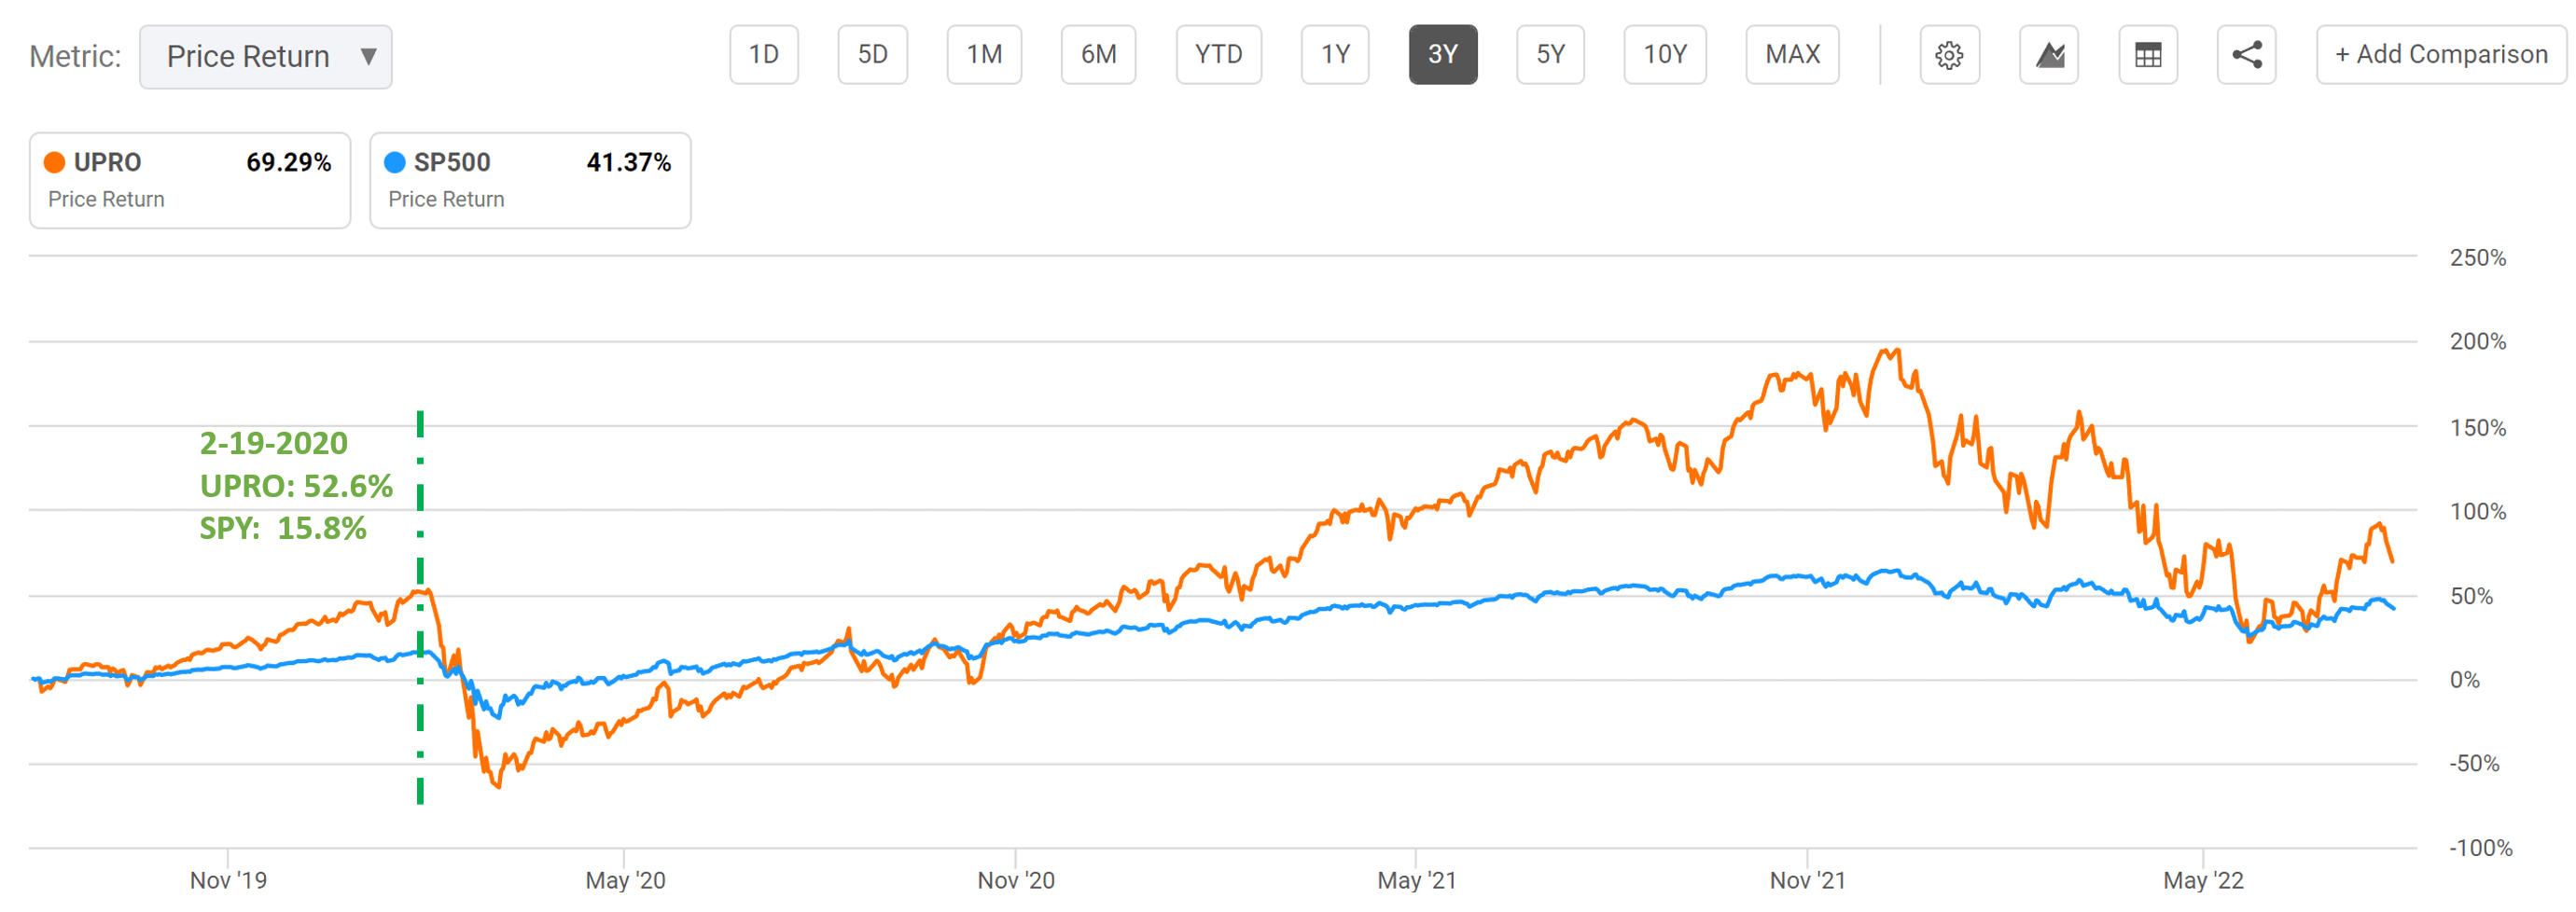
How to use SPY and UPRO in a disciplined way?
To strike that optimal balance, we adjust leverage dynamically based on market volatility. The concept is explained in the paper by Tony Cooper and the key is:
It is difficult to predict stock market returns but relatively easy to predict market volatility. But volatility predictions do not easily translate into return predictions since the two are largely uncorrelated. We put forward a framework that produces a formula in which returns become a function of volatility and therefore become somewhat more predictable. We show that this strategy produces excess returns giving us the upside of leverage without the downside.
The key results from Cooper’s paper are shown in the Figure below. It shows 135 years’ worth of daily US index prices going all the way back to when stock index data were available in the US market. The orange circles show leverage factors of 1x (e.g., SPY), 2x (e.g., SSO), and 3x (e.g., UPRO). As you can clearly see, the annualized return first rises when the leverage is increased beyond 1x. For instance, raising the leverage to 2x would result in a roughly 5% average yearly return (and 1% alpha compounded over 50 years, the typical investment timeframe for most retirement accounts, is A LOT). But you can’t go overboard because performance will start to suffer if the leverage is increased more. For example, 3x leverage will drag the performance below 4%. This figure clearly shows the need to strike an optimal balance.
Of course, this result does not mean that you could not use a 3x leveraged fund. The leverage ratio shown in the following chart is the effective leverage ratio for the entire portfolio. So in practice, you can use a 3x leverage fund such as UPRO. You just need to control its location so that the effective leverage for your entire portfolio is below 3x. And as to be detailed next, we actually cap our leverage to 1.25x in our portfolio (which is already sufficient to generate the aggressive growth we need as you can see in the 2nd chart).
Source: Alpha Generation and Risk Smoothing using Managed Volatility by Tony Cooper. Source: author.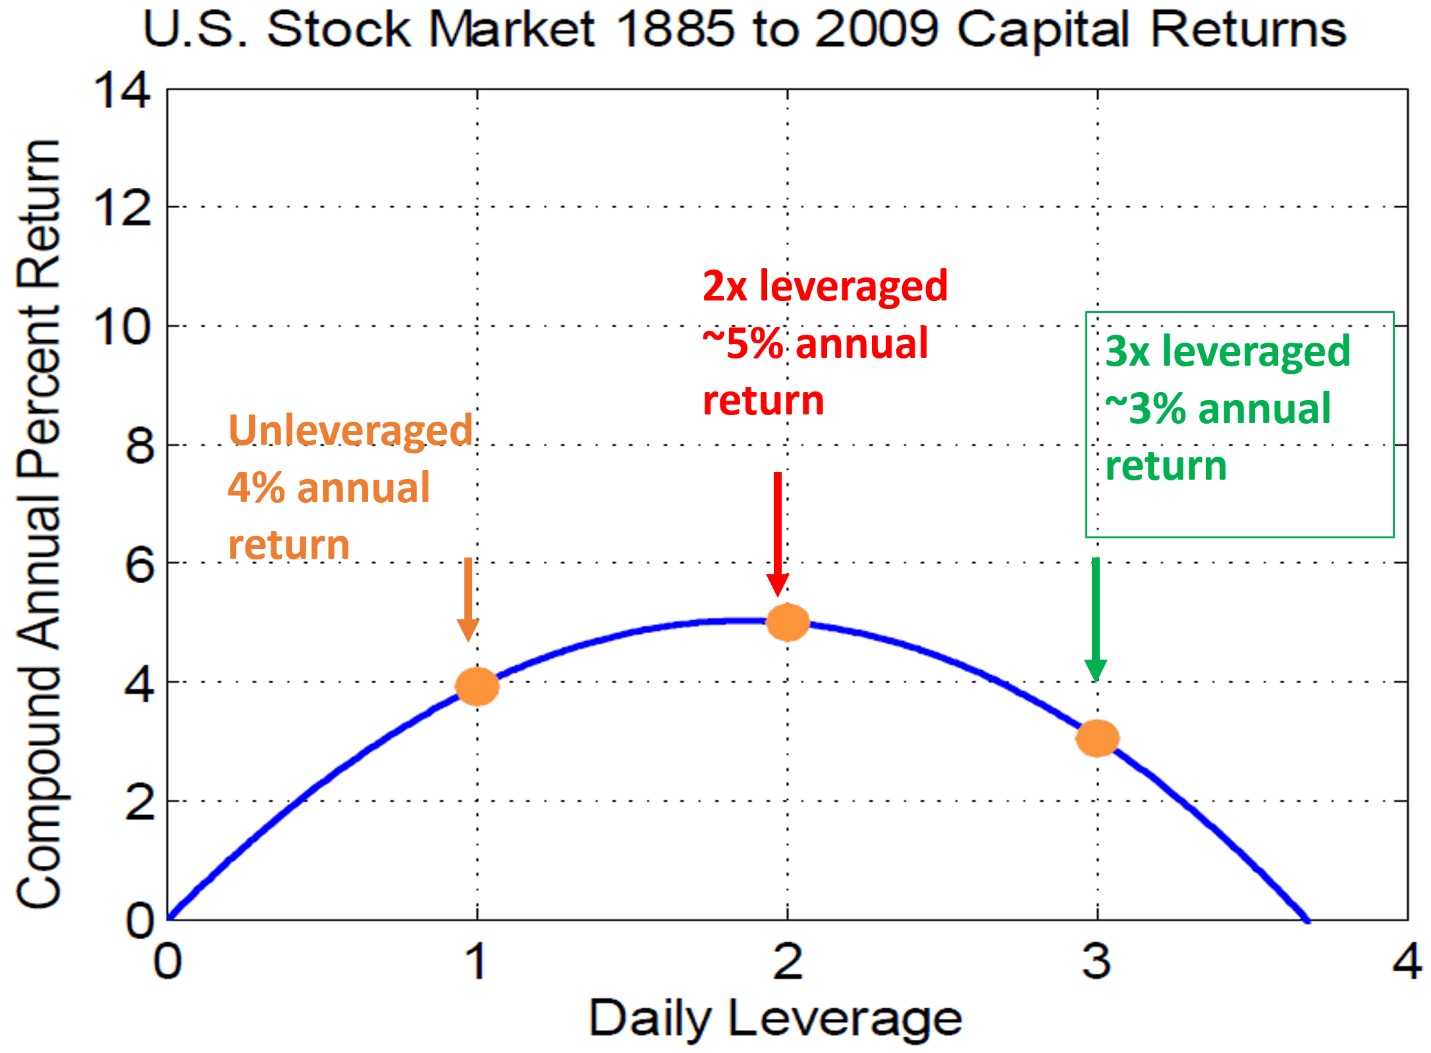
Our aggressive growth portfolio
We have been implementing the above strategy in our real-money account for more than a decade (and the long-term results are shown above). Many details of our implementation are different from Cooper’s original methods and these differences are elaborated in our earlier article. A few key points are summarized here to facilitate reference:
- Our key allocation curve for UPRO is shown in the chart below. We use the VIX index to measure the volatility of the market and adjust our leverage. We leverage less when VIX increases and more when the VIX decreases according to the blue curve.
- For the use of a 3x leverage fund such as UPRO, we also cap my maximum leverage at 25% as shown by the green line.
- More specifically, the blueline follows a 1.5th power-law relationship in the form of Leverage ~ 16/VIX^1.5. So that when VIX = 16, the leverage is 25%, i.e., the maximum is reached and 25% of our equity exposure will be leveraged. The central idea is to adjust leverage by A/VIX^B. We tailor (and you should too) A and B considering the different leverages provided by the given fund and also the sensitivity you desire.
Source: author.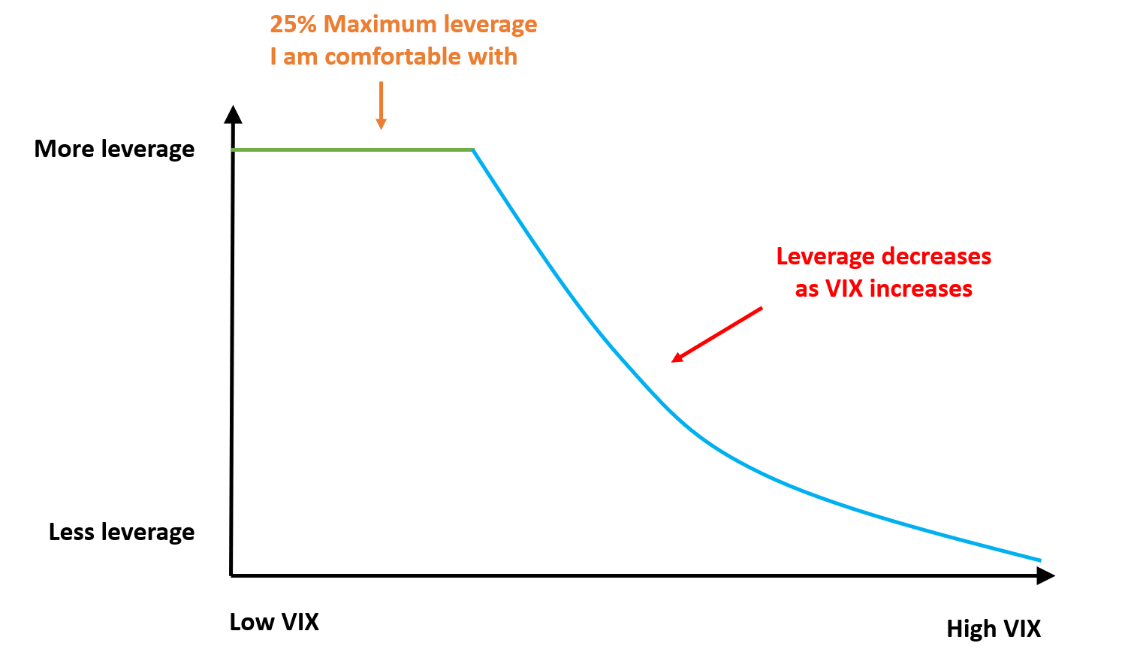
Our leveraged aggressive growth portfolio (“AGP”)
Now, let’s see the details of our aggressive growth portfolio. Our free blog article here provides more details about the AGP. The chart below provides a snapshot of our exposure in the past few months.
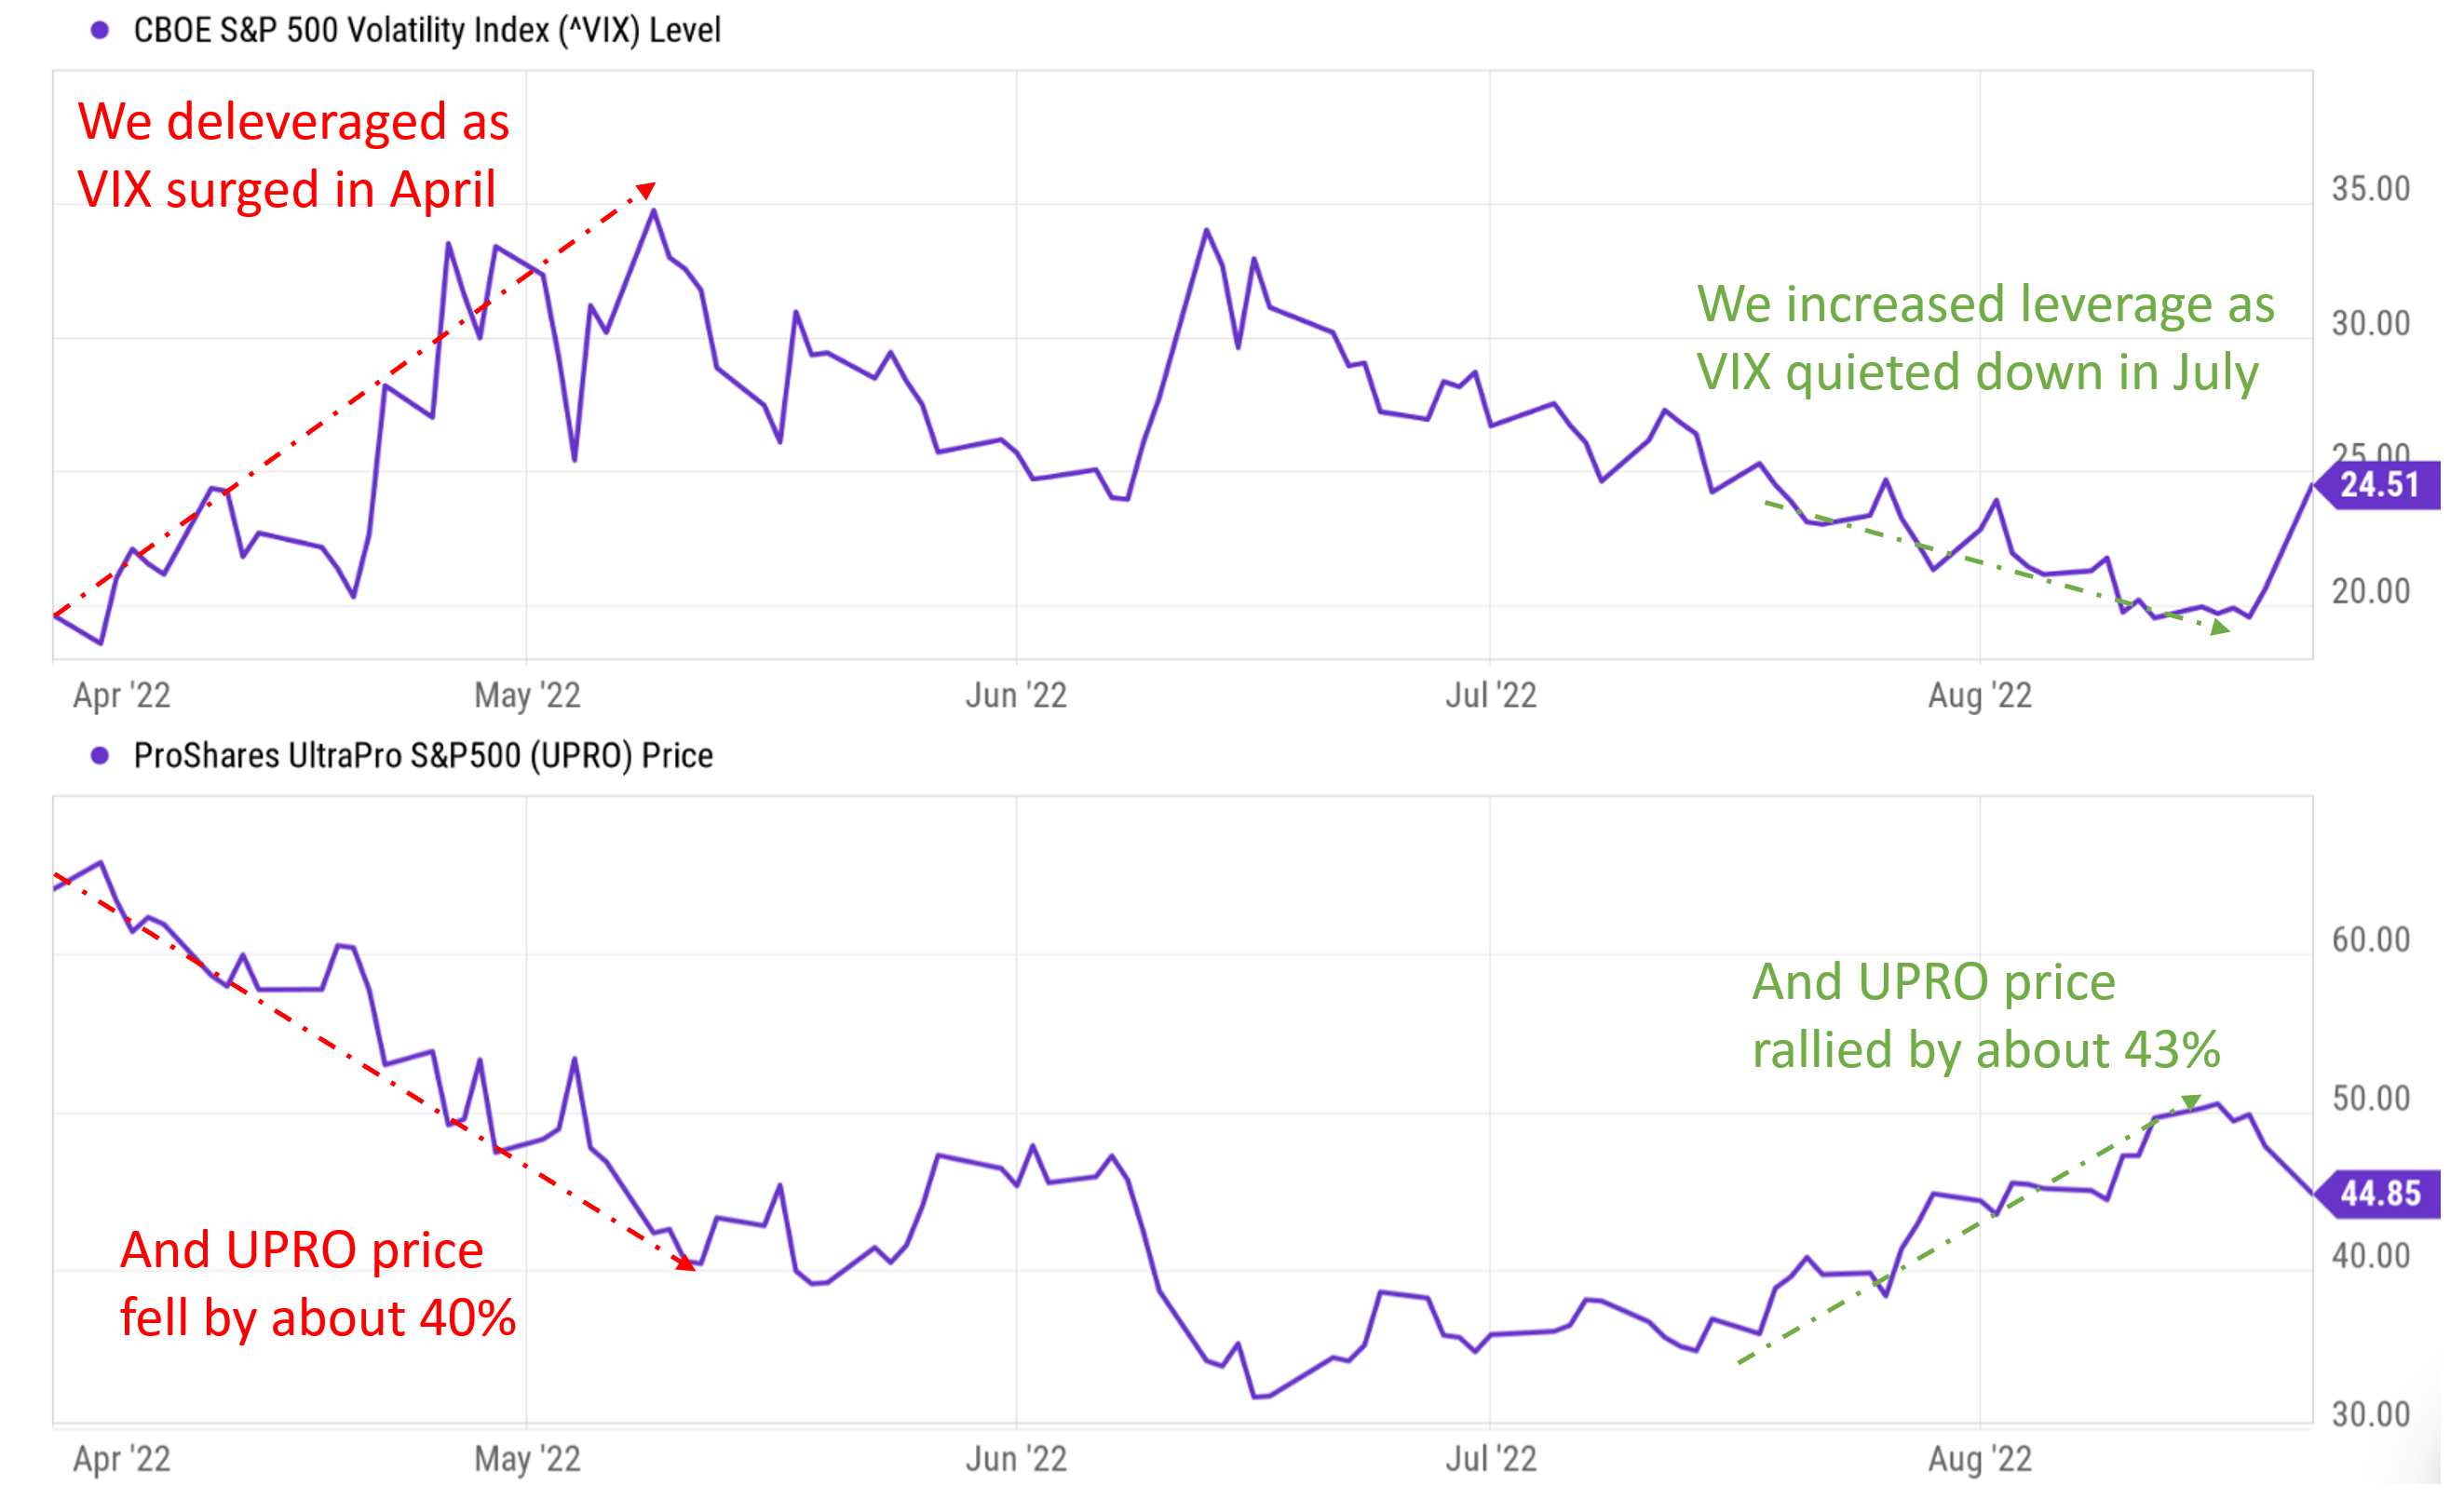
We adjust our leverage based on the VIX index on a monthly basis. And in our April adjustment, we wrote to our readers substantially decreased our leverage because of the surge in VIX. As you can see from the following chart, we’ve decreased the allocation of UPRO from 8.3% in March to 5.0% now due to the higher volatilities following the allocation curve shown above. The VIX index was about 30 at the time of our adjustment (about 90% percentile historically), compared to about 20 back in March (about 65% percentile historically). We then held the leverage at this low level till July because the VIX has stayed at an elevated level till then. And then in our July adjustment, we substantially increased the leverage ratio to 9%.
The bottom panel of the second chart below shows the price action of UPRO during the period of time. As you can see, the UPRO price plunged by as much as 40% from about $65 to about $40 since we reduced our exposure in April. And it rallied by about 43% from $35 to about $50 since we increased our leverage in July.
I hope these recent examples from our real account illustrate the importance of sticking to a disciplined approach, especially during turbulent times.
Source: author. Seeking Alpha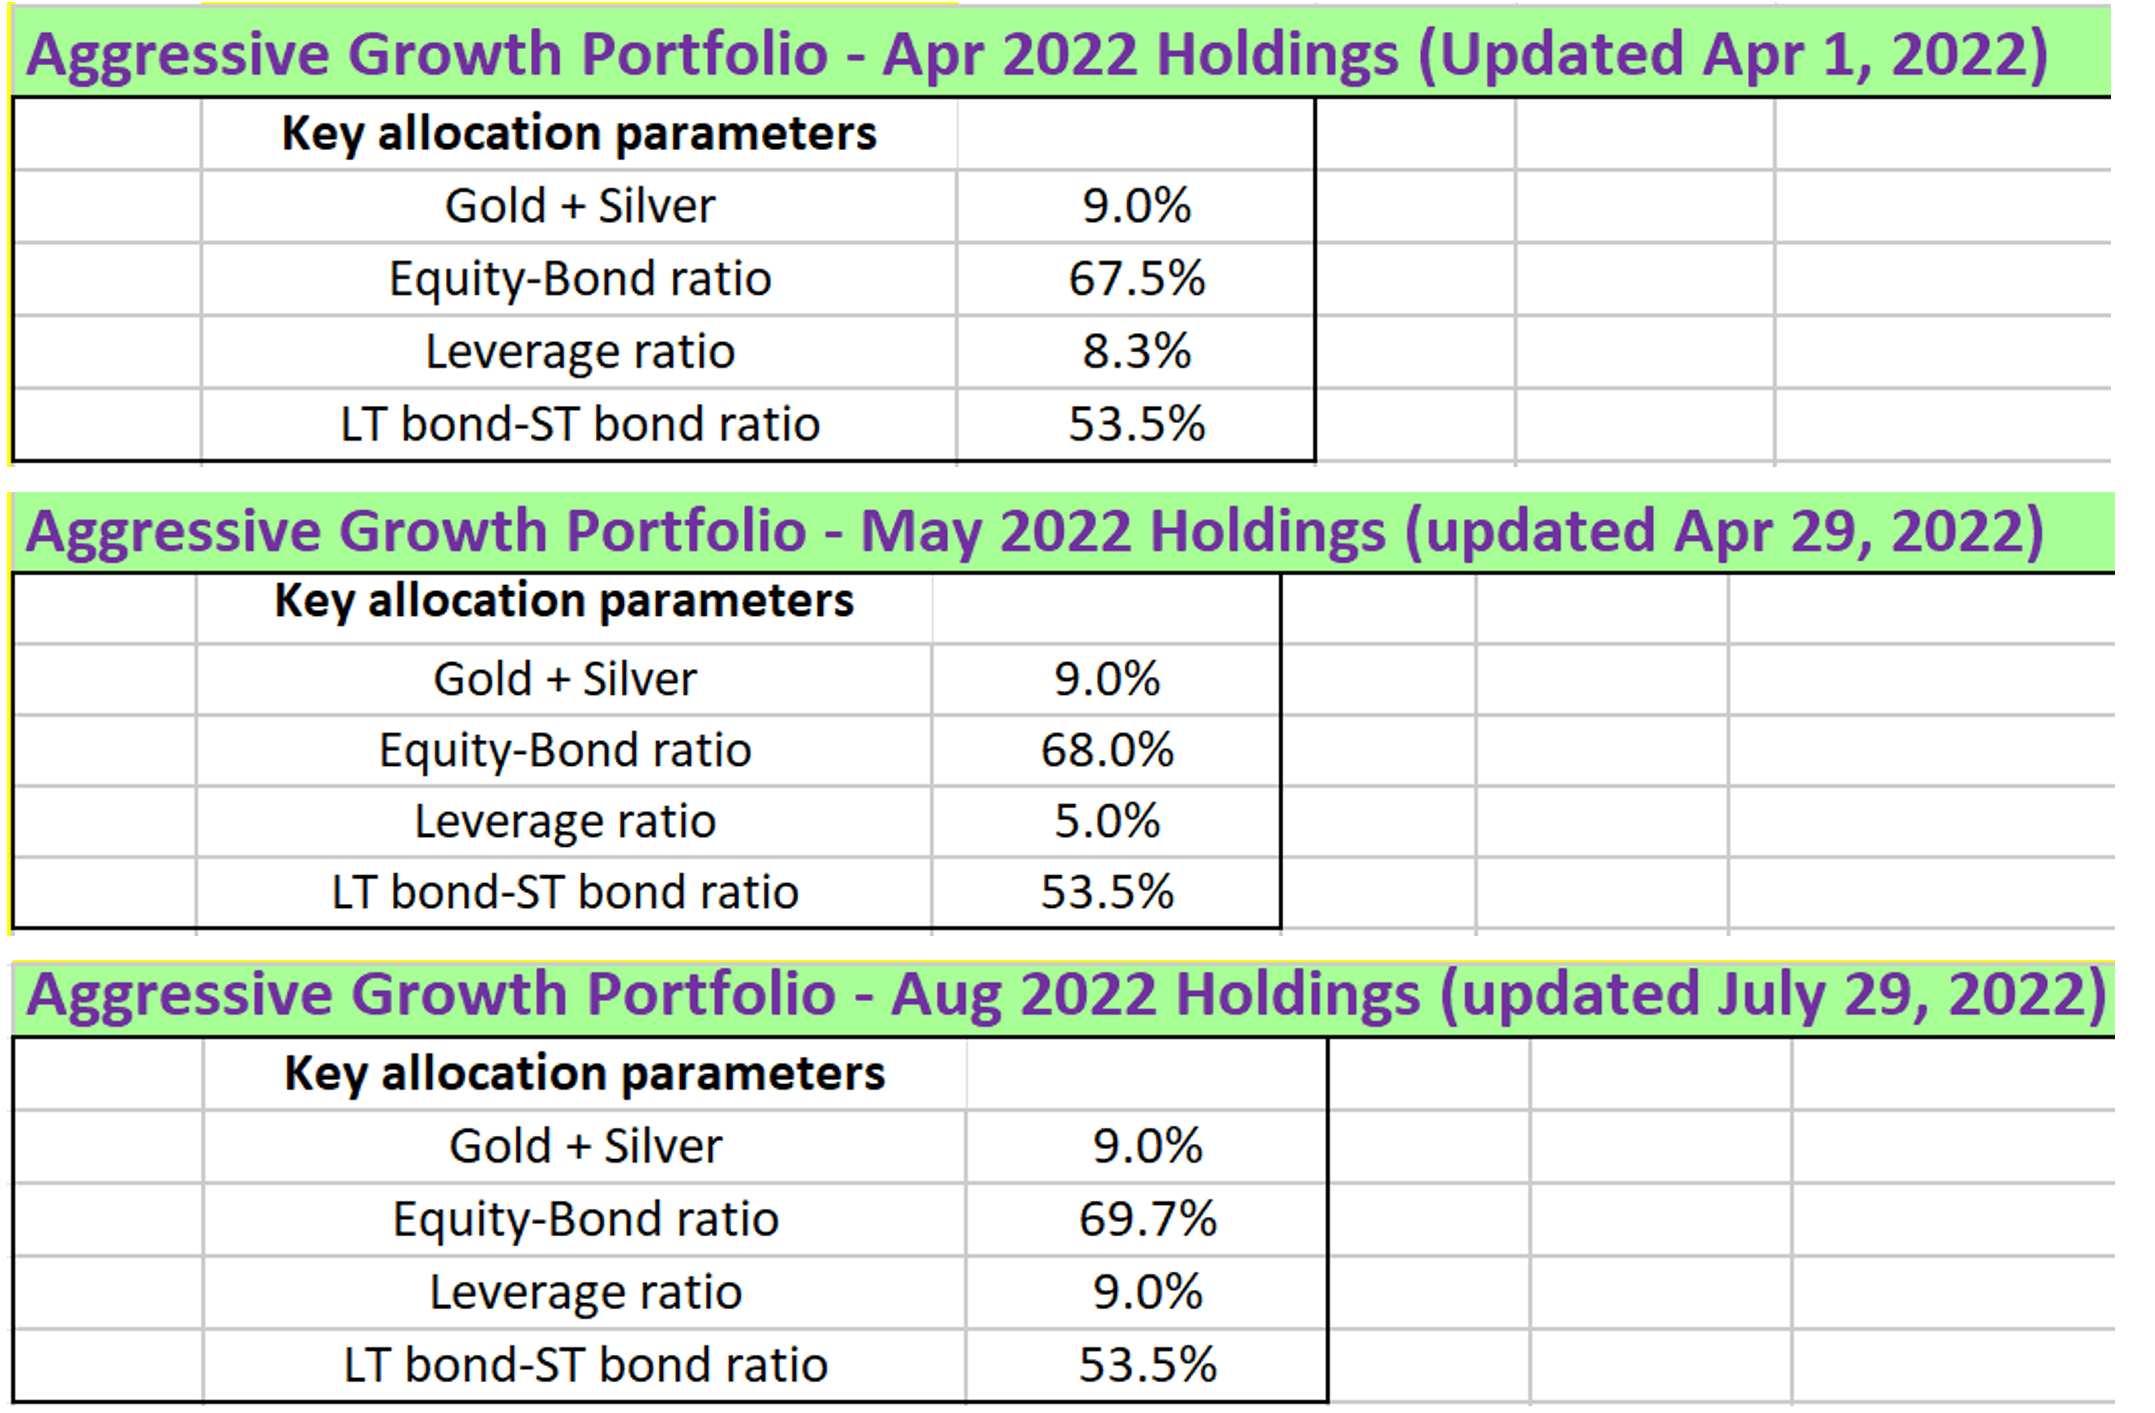
Final thoughts and other risks
Finally, two quick notes. Firstly, note that in our real portfolio, we hold ProShares UltraPro QQQ (TQQQ). In general, we favor the tech sector more for long-term growth. And our detailed considerations of using TQQQ instead of UPRO are also detailed in our blog article. But the same underlying concept applies to both TQQQ and UPRO (or other leveraged funds).
Secondly, currently, we are seeing another volatility surge in the past few days. The market volatility has been really quiet for the earlier part of the week and VIX dropped to as low as 19.5. And as of this writing, VIX has surged to 24.5, more than 25% higher than about only 2 days ago. To provide broader context, a volatility of 24.5 is at the top 82% percentile of historical volatility. While a VIX of 19.5 is only at the 62% percentile only. We are scheduled to adjust our leverage at the end of the month in a few days, and we will deleverage should the volatility remain at the current elevated level.
Finally, risks. With market funds like UPRO or SPY, they both face the same underlying macroeconomic risks. There is a risk of a recession in the near future. The yield curve inversion has occurred (again) since in July. And before that, we saw the inversion in April also. As I am typing these lines, the 10-year treasury rate (3.03%) remains below 1-year treasury rates (3.33%), 2-year rates (3.32%), and 5-year rates (3.18%).
Be the first to comment