

Justin Sullivan/Getty Images News
This article was co-produced with James Marino Sr. of Portfolio Insight.
Created by the author
This article series compiles a list of upcoming ex-dividend dates of stocks in Dividend Radar, a spreadsheet containing stocks with dividend increase streaks of five years or more.
To earn the next dividend, be sure to buy a stock before its ex-dividend date, which usually is one business day before the record date. Unfortunately, if you wait until the ex-dividend date or thereafter, you won’t receive the next dividend payment! Instead, the seller will receive the next dividend.
Upcoming Ex-Dividend Dates
The following table presents a summary of ex-dividend dates for the next two weeks. The table is divided into sections by Ex-Div Date and sorted by Ticker for each date. Yrs are years of consecutive dividend increases, Yield is the new dividend yield for the market close Price on the date listed, and 5-yr DGR is the compound annual growth rate of the dividend over a 5-year period (on a trailing 12-month basis). Note that Payout is the dollar amount payable per share or unit on the Pay Date.
| Company (Ticker) | Yrs | Price | Fwd | 5-Yr | Next | Pay |
| (06/22) | Yield | DGR | Payout | Date | ||
| Ex-Div Date: 06/24 (Last Day to Buy: Thursday, 06/23) | ||||||
| Equity Residential (EQR) | 5 | $71.36 | 3.50% | -12.9% | 0.625 | 07/08 |
| Guaranty Bancshares (GNTY) | 5 | $36.26 | 2.43% | N/A | 0.22 | 07/13 |
| Great Southern Bancorp (GSBC) | 9 | $59.35 | 2.70% | 10.1% | 0.4 | 07/12 |
| Hurco (HURC) | 9 | $25.08 | 2.39% | 9.0% | 0.15 | 07/11 |
| Independent Bank (INDB) | 12 | $80.21 | 2.54% | 10.4% | 0.51 | 07/08 |
| Portland General Electric (POR) | 16 | $46.03 | 3.93% | 6.1% | 0.453 | 07/15 |
| W. R. Berkley (WRB) | 21 | $66.93 | 0.60% | 8.5% | 0.1 | 07/07 |
| Ex-Div Date: 06/27 (Last Day to Buy: Friday, 06/24) | ||||||
| Canadian Imperial Bank of Commerce (CM) | 5 | $49.64 | 5.20% | 5.7% | 0.83 | 07/28 |
| Medifast (MED) | 7 | $178.75 | 3.67% | 38.9% | 1.64 | 08/08 |
| Ex-Div Date: 06/28 (Last Day to Buy: Monday, 06/27) | ||||||
| CBTX (CBTX) | 5 | $27.59 | 1.88% | N/A | 0.13 | 07/15 |
| Ex-Div Date: 06/29 (Last Day to Buy: Tuesday, 06/28) | ||||||
| Ares Commercial Real Estate (ACRE) | 6 | $12.17 | 10.85% | 4.7% | 0.33 | 07/15 |
| Agree Realty (ADC) | 9 | $70.95 | 3.96% | 6.4% | 0.234 | 07/14 |
| Algonquin Power & Utilities (AQN) | 11 | $13.28 | 5.45% | 9.5% | 0.181 | 07/15 |
| Alexandria Real Estate Equities (ARE) | 12 | $133.39 | 3.54% | 6.9% | 1.18 | 07/15 |
| AvalonBay Communities (AVB) | 11 | $191.89 | 3.31% | 3.1% | 1.59 | 07/15 |
| Axis Capital (AXS) | 19 | $54.94 | 3.13% | 3.1% | 0.43 | 07/15 |
| BancFirst (BANF) | 29 | $95.03 | 1.52% | 13.6% | 0.36 | 07/15 |
| Franklin Resources (BEN) | 42 | $24.10 | 4.81% | 8.5% | 0.29 | 07/15 |
| BRT Apartments (BRT) | 5 | $22.22 | 4.50% | N/A | 0.25 | 07/08 |
| Camden Property (CPT) | 13 | $131.89 | 2.85% | 2.7% | 0.94 | 07/15 |
| CareTrust (CTRE) | 8 | $17.77 | 6.19% | 9.0% | 0.275 | 07/15 |
| Dillard’s (DDS) | 12 | $258.95 | 0.31% | 21.8% | 0.2 | 08/01 |
| Amdocs (DOX) | 10 | $80.01 | 1.97% | 12.9% | 0.395 | 07/29 |
| EastGroup Properties (EGP) | 11 | $152.43 | 2.89% | 9.6% | 1.1 | 07/15 |
| Ensign (ENSG) | 15 | $71.84 | 0.31% | 5.4% | 0.055 | 07/29 |
| Essex Property (ESS) | 28 | $255.93 | 3.44% | 5.3% | 2.2 | 07/15 |
| First Bancorp (FBNC) | 5 | $34.97 | 2.52% | 20.7% | 0.22 | 07/25 |
| Four Corners Property (FCPT) | 6 | $26.05 | 5.11% | 6.0% | 0.333 | 07/15 |
| Fifth Third Bancorp (FITB) | 12 | $34.46 | 3.48% | 16.7% | 0.3 | 07/15 |
| FMC (FMC) | 5 | $107.62 | 1.97% | 25.1% | 0.53 | 07/21 |
| First Industrial Realty (FR) | 10 | $46.53 | 2.54% | 7.2% | 0.295 | 07/18 |
| FirstService (FSV) | 6 | $117.10 | 0.69% | 15.6% | 0.203 | 07/07 |
| Humana (HUM) | 11 | $448.05 | 0.70% | 17.9% | 0.788 | 07/29 |
| Innovative Industrial Properties (IIPR) | 5 | $110.93 | 6.31% | N/A | 1.75 | 07/15 |
| Investar (ISTR) | 8 | $21.70 | 1.66% | 43.7% | 0.09 | 07/29 |
| Illinois Tool Works (ITW) | 59 | $181.38 | 2.69% | 13.9% | 1.22 | 07/14 |
| Kilroy Realty (KRC) | 5 | $51.39 | 4.05% | -3.8% | 0.52 | 07/13 |
| Kennedy-Wilson (KW) | 11 | $18.90 | 5.08% | 9.3% | 0.24 | 07/07 |
| Lincoln Electric (LECO) | 27 | $124.29 | 1.80% | 9.8% | 0.56 | 07/15 |
| Lennox International (LII) | 13 | $188.29 | 2.25% | 16.4% | 1.06 | 07/15 |
| Mondelez International (MDLZ) | 9 | $60.28 | 2.32% | 13.0% | 0.35 | 07/14 |
| Monolithic Power Systems (MPWR) | 5 | $400.46 | 0.75% | 26.1% | 0.75 | 07/15 |
| National Fuel Gas (NFG) | 52 | $66.01 | 2.88% | 2.4% | 0.475 | 07/15 |
| National HealthCare (NHC) | 19 | $69.35 | 3.29% | 3.5% | 0.57 | 08/01 |
| Nucor (NUE) | 49 | $107.84 | 1.85% | 3.8% | 0.5 | 08/11 |
| Rexford Industrial Realty (REXR) | 9 | $57.35 | 2.20% | 13.5% | 0.315 | 07/15 |
| Regal Rexnord (RRX) | 17 | $111.69 | 1.25% | 11.5% | 0.35 | 07/14 |
| Safehold (SAFE) | 5 | $34.18 | 2.07% | N/A | 0.177 | 07/15 |
| STAG Industrial (STAG) | 9 | $30.41 | 4.80% | 0.9% | 0.122 | 07/15 |
| Steel Dynamics (STLD) | 12 | $67.40 | 2.02% | 14.3% | 0.34 | 07/15 |
| Stantec (STN) | 7 | $42.71 | 1.35% | 9.0% | 0.18 | 07/15 |
| STORE Capital (STOR) | 8 | $25.98 | 5.93% | 5.9% | 0.385 | 07/15 |
| Sun Communities (SUI) | 6 | $155.87 | 2.26% | 5.2% | 0.88 | 07/15 |
| Stryker (SYK) | 29 | $196.75 | 1.41% | 10.5% | 0.695 | 07/29 |
| TFI International (TFII) | 7 | $74.03 | 1.46% | 13.0% | 0.27 | 07/15 |
| TowneBank (TOWN) | 11 | $28.12 | 3.27% | 9.0% | 0.23 | 07/12 |
| Terreno Realty (TRNO) | 12 | $56.18 | 2.42% | 10.9% | 0.34 | 07/14 |
| TC Energy (TRP) | 7 | $51.40 | 5.61% | 9.8% | 0.9 | 07/29 |
| U.S. Bancorp (USB) | 12 | $46.50 | 3.96% | 10.5% | 0.46 | 07/15 |
| W. P. Carey (WPC) | 25 | $85.43 | 4.96% | 1.3% | 1.059 | 07/15 |
| Willis Towers Watson Public (WTW) | 6 | $197.26 | 1.66% | 3.4% | 0.82 | 07/15 |
| York Water (YORW) | 25 | $38.99 | 2.00% | 3.9% | 0.195 | 07/15 |
| Ex-Div Date: 06/30 (Last Day to Buy: Wednesday, 06/29) | ||||||
| Andersons (ANDE) | 26 | $33.49 | 2.15% | 2.4% | 0.18 | 07/22 |
| Air Products and Chemicals (APD) | 40 | $241.00 | 2.69% | 11.6% | 1.62 | 08/08 |
| Bristol-Myers Squibb (BMY) | 16 | $76.55 | 2.82% | 12.4% | 0.54 | 08/01 |
| Cardinal Health (CAH) | 27 | $52.59 | 3.77% | 1.8% | 0.496 | 07/15 |
| CubeSmart (CUBE) | 13 | $41.10 | 4.18% | 9.9% | 0.43 | 07/15 |
| General Dynamics (GD) | 31 | $216.01 | 2.33% | 9.4% | 1.26 | 08/05 |
| Heico (HEI) | 17 | $130.14 | 0.14% | 15.7% | 0.09 | 07/15 |
| Heico (HEIA) | 18 | $87.02 | 0.21% | 15.7% | 0.09 | 07/15 |
| Ingredion (INGR) | 12 | $84.78 | 3.07% | 5.9% | 0.65 | 07/26 |
| Morningstar (MORN) | 9 | $233.85 | 0.62% | 13.4% | 0.36 | 07/29 |
| Realty Income (O) | 28 | $66.39 | 4.47% | 3.4% | 0.248 | 07/15 |
| Philip Morris International (PM) | 14 | $99.18 | 5.04% | 3.6% | 1.25 | 07/15 |
| Royal Gold (RGLD) | 20 | $109.20 | 1.28% | 18.0% | 0.35 | 07/15 |
| Raymond James Financial (RJF) | 10 | $88.67 | 1.53% | 9.0% | 0.34 | 07/15 |
| Republic Services (RSG) | 19 | $124.97 | 1.47% | 7.5% | 0.46 | 07/15 |
| State Street (STT) | 11 | $63.33 | 3.60% | 13.2% | 0.57 | 07/11 |
| Sysco (SYY) | 52 | $78.30 | 2.50% | 14.6% | 0.49 | 07/22 |
| Washington Trust Bancorp (WASH) | 12 | $49.69 | 4.35% | 7.5% | 0.54 | 07/08 |
| Ex-Div Date: 07/01 (Last Day to Buy: Thursday, 06/30) | ||||||
| Agilent Technologies (A) | 11 | $113.80 | 0.74% | 5.4% | 0.21 | 07/27 |
| Dollar General (DG) | 8 | $240.52 | 0.91% | 17.5% | 0.55 | 07/19 |
| Globe Life (GL) | 16 | $94.41 | 0.88% | 11.6% | 0.208 | 08/01 |
| Main Street Capital (MAIN) | 12 | $37.25 | 6.93% | 0.9% | 0.215 | 07/15 |
| Ex-Div Date: 07/04 (Last Day to Buy: Friday, 07/01) | ||||||
| Bank of Nova Scotia (BNS) | 7 | $60.22 | 5.35% | 1.3% | 1.03 | 07/27 |
| Ex-Div Date: 07/05 (Last Day to Buy: Friday, 07/04) | ||||||
| Comcast (CMCSA) | 14 | $38.90 | 2.78% | 12.7% | 0.27 | 07/27 |
| Cisco Systems (CSCO) | 12 | $43.57 | 3.49% | 7.3% | 0.38 | 07/27 |
| Quest Diagnostics (DGX) | 12 | $134.34 | 1.97% | 8.5% | 0.66 | 07/20 |
| Erie Indemnity (ERIE) | 32 | $179.24 | 2.48% | 7.2% | 1.11 | 07/20 |
| Healthcare Trust of America (HTA) | 10 | $27.42 | 4.74% | -4.1% | 0.325 | 07/15 |
| JPMorgan Chase (JPM) | 12 | $115.18 | 3.47% | 15.1% | 1 | 07/31 |
| Ex-Div Date: 07/06 (Last Day to Buy: Tuesday, 07/05) | ||||||
| ABM Industries (ABM) | 55 | $42.64 | 1.83% | -2.9% | 0.195 | 08/01 |
| Sempra Energy (SRE) | 18 | $143.44 | 3.19% | 7.6% | 1.145 | 07/15 |
| Simpson Manufacturing (SSD) | 9 | $92.07 | 1.13% | 1.4% | 0.26 | 07/28 |
| Ex-Div Date: 07/07 (Last Day to Buy: Wednesday, 07/06) | ||||||
| Brady (BRC) | 37 | $44.86 | 2.01% | 1.8% | 0.225 | 07/29 |
| Gentex (GNTX) | 11 | $27.97 | 1.72% | 6.2% | 0.12 | 07/20 |
| Mastercard (MA) | 11 | $316.15 | 0.62% | 18.0% | 0.49 | 08/09 |
| NetApp (NTAP) | 9 | $64.70 | 3.09% | 21.4% | 0.5 | 07/27 |
| Roper Technologies (ROP) | 29 | $383.34 | 0.65% | 13.1% | 0.62 | 07/22 |
| Toronto-Dominion Bank (TD) | 7 | $67.09 | 4.21% | 9.1% | 0.89 | 07/31 |
| Verizon Communications (VZ) | 18 | $50.79 | 5.04% | 2.1% | 0.64 | 08/01 |
Previous Post: Upcoming Ex-Dividend Dates: June 17-30, 2022
High-Quality Candidates
We use DVK Quality Snapshots to assess the quality of dividend growth stocks. DVK Quality Snapshots is an elegant and effective system that employs five quality indicators and assigns 0-5 points to each quality indicator for a maximum quality score of 25 points.
To find high-quality candidates from Dividend Radars stocks with upcoming ex-dividend dates, we screened for the stocks with quality scores of 23 or higher. There are eight such candidates this week.
Below we present the quality scores, an assessment of fair value (whether Above, At, or Below fair value), and two measures of each stock’s recent performance (1-year and 3-year trailing total returns [TTR]). Key metrics from the previous table are repeated here for convenience.
Created by the author from data in Dividend Radar and using DVK Quality Snapshots 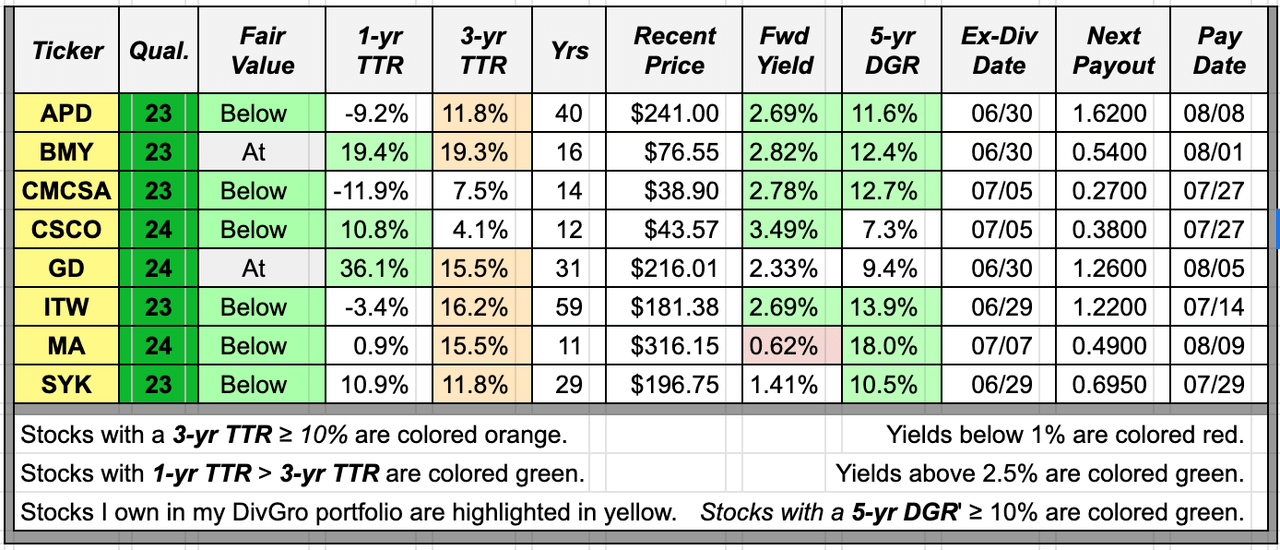
Dividend Radar views fair value as a range. Two stocks are fairly valued as they are trading within the fair value range, and six stocks have discounted valuations below the fair value range. These are indicated with green cells in the Fair Value column.
TTR adds the returns due to stock price appreciation (or depreciation) and dividend payments over each time frame. Dividend Radar provides 1-year and 3-year TTRs. The summary table highlights 3-year TTRs of 10% or higher in orange and any 1-year TRR that exceeds the 3-year TTR in green (indicating stronger recent performance).
Six of this week’s candidates have 3-year TTRs above 10% and three candidates have a 1-year TTR that exceeds the 3-year TTR. BMY and GD are the only candidates for which both these statements are true.
We also color-code the Yield and 5-yr DGR columns, preferring dividend yields above 2.5% and 5-year dividend growth rates of 10% or higher.
Six candidates have 5-year dividend growth rates above 10% and five have yields above 2.5%. Only AMD, BMY, CMCSA, and ITW top both.
An Interesting Candidate
Ideally, we’d like to see green cells in each of the Fair Value, 1-yr TTR, Yield, and 5-yr DGR columns. That rarely happens, though, so we look for a candidate that offers the best metrics overall, at least based on our current investment objectives.
Let’s highlight Dividend Contender CSCO this week.
Cisco Systems designs, manufactures, and sells Internet protocol-based products and services. The company also delivers integrated solutions to develop and connect networks around the world. CSCO serves businesses of various sizes, public institutions, governments, and communications service providers. The company was founded in 1984 and is headquartered in San Jose, California.
CSCO is rated Excellent (quality score 23-24):
Created by the author from a personal spreadsheet based on DVK Quality Snapshots
The stock yields 3.49% at $43.37 per share and has a 5-year dividend growth rate [DGR] of 7.3%.
Over the past 10 years, CSCO has outperformed the SPDR S&P 500 ETF (SPY), an ETF designed to track the 500 companies in the S&P 500 index:
Portfolio-Insight.com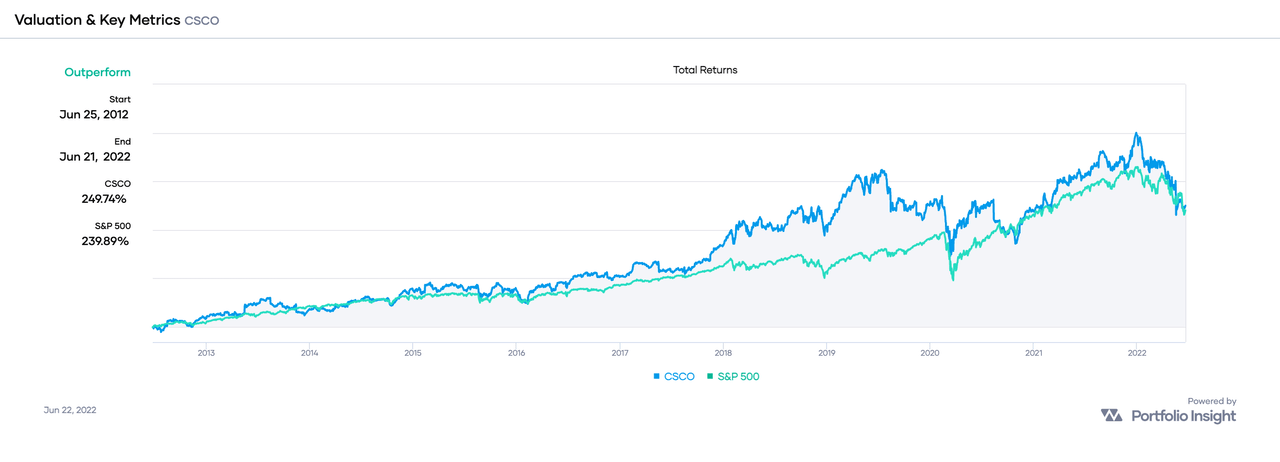
CSCO delivered total returns of 250% versus SPY’s 240%, a margin of 1.04-to-1.
If we extend the time frame of comparison to the past 20 years, CSCO actually underperformed SPY, with total returns of 344% versus SPY’s 455% (a margin of 0.76-to-1).
Here is a chart showing CSCO’s dividend growth history through the end of 2021:
Portfolio Insight 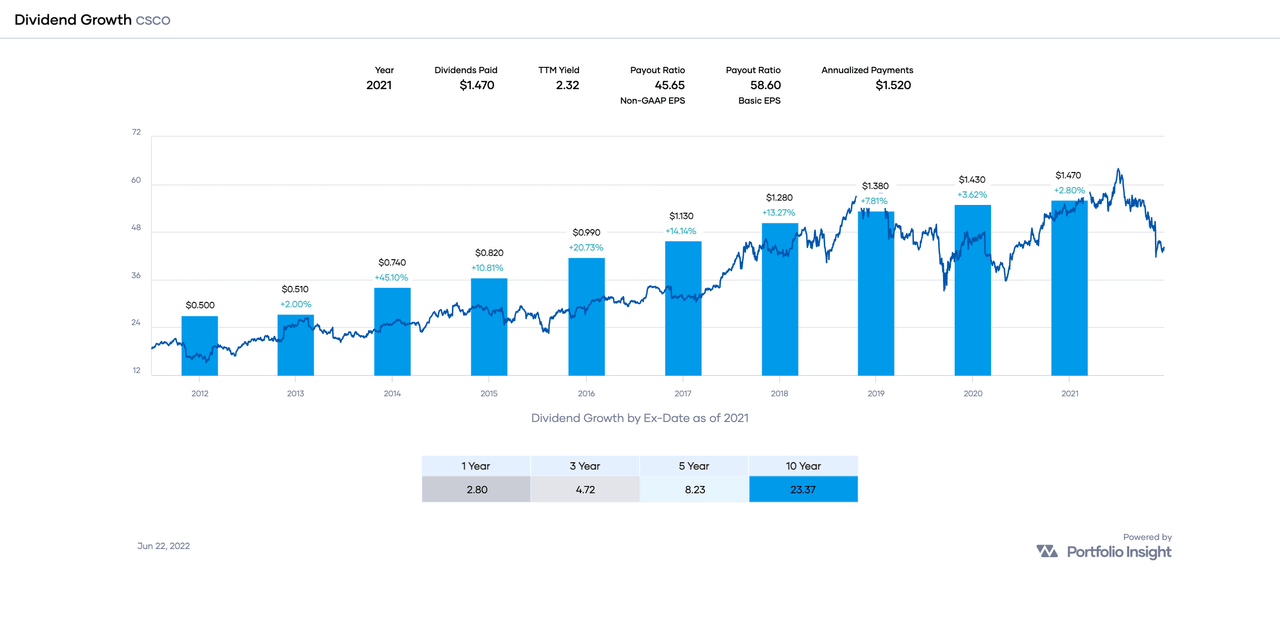
CSCO is growing its dividend but at a decelerating rate. We can see this by dividing the 5-year DGR by the 10-year counterpart: 8.23 ÷ 23.37 = 0.35. A ratio below 1.00 indicates a deceleration of the DGR.
I’m impressed by CSCO’s EPS history, which is a model of consistency!
Portfolio Insight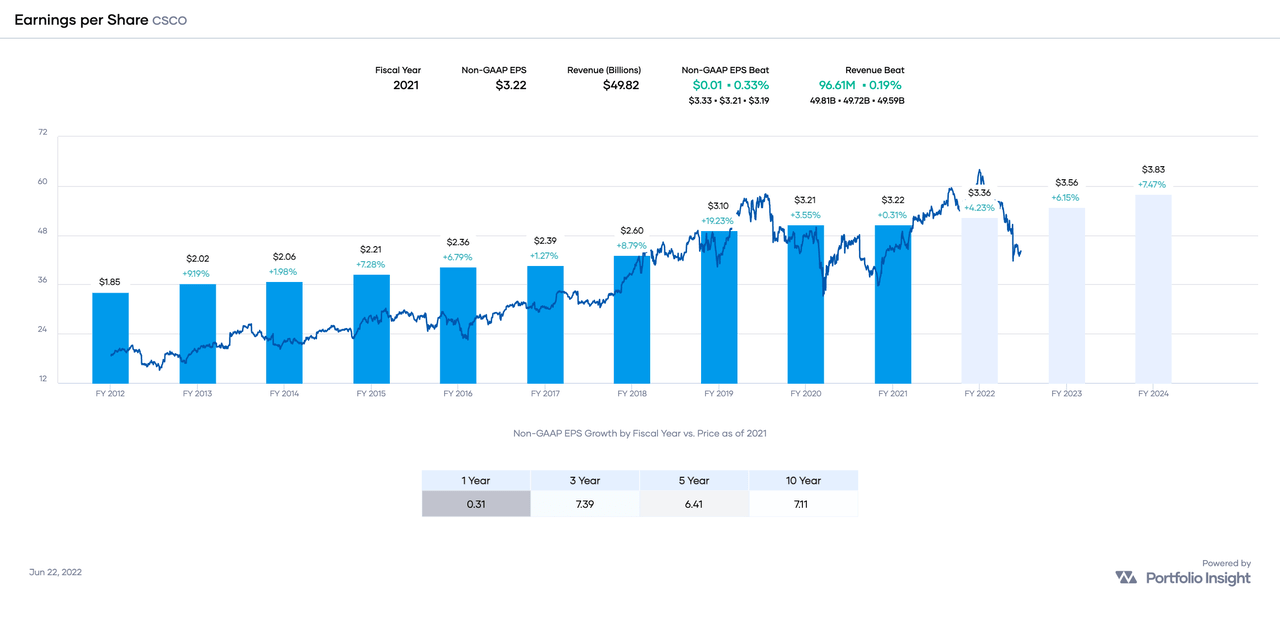
If realized, CSCO’s EPS estimates for FY 2022 through FY 2024 would continue the steady upward trend.
CSCO’s payout ratio of 44% is “low for most companies,” according to Simply Safe Dividends:
Simply Safe Dividends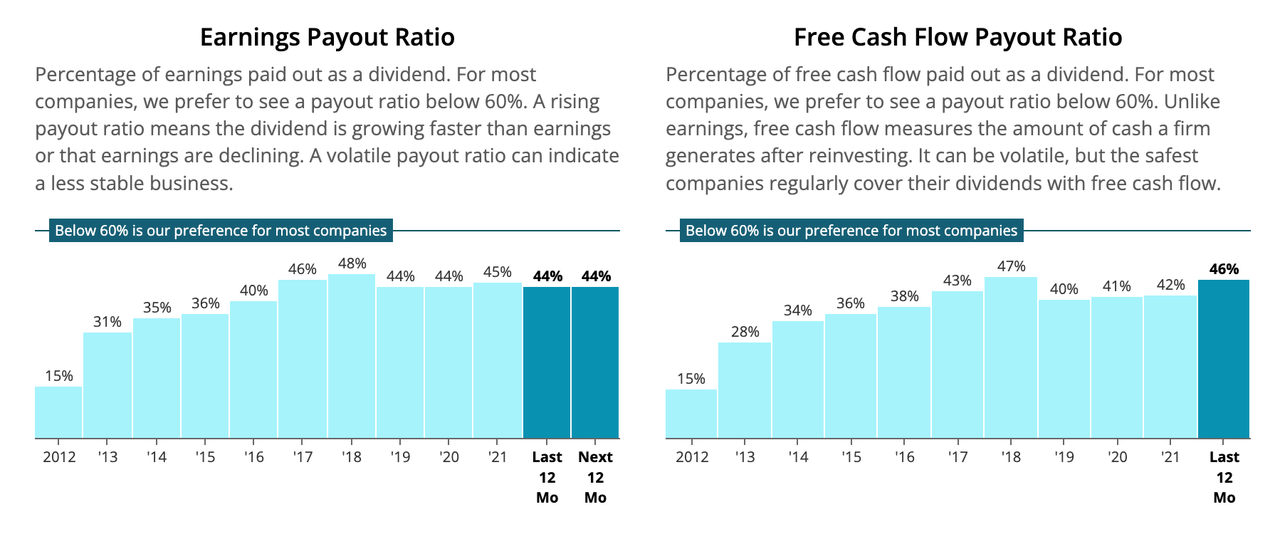
CSCO has plenty of room to continue paying and increasing its dividend! Moreover, Simply Safe Dividends considers CSCO’s dividend Very Safe with a Dividend Safety Score of 91.
Let’s now consider CSCO’s valuation.
Portfolio Insight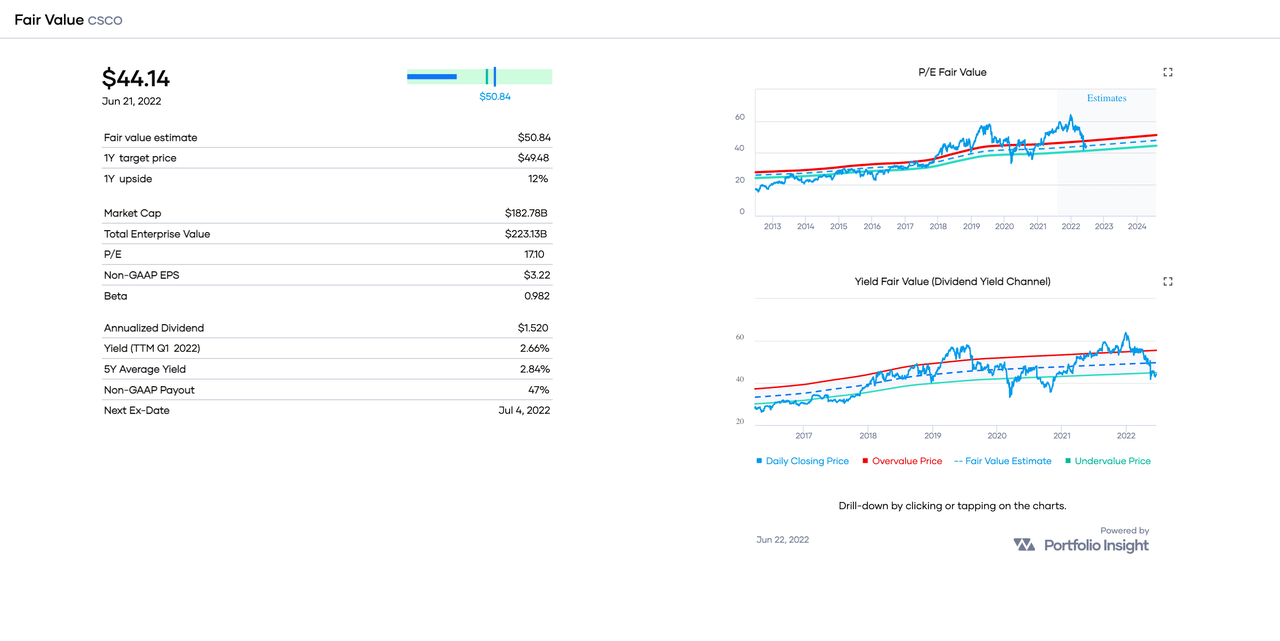
A quick way to estimate fair value is to divide the annualized dividend ($1.52 by the stock’s 5-year average yield (2.84%). That results in a fair value [FV] estimate of $53 based on CSCO’s dividend yield history.
For reference, CFRA’s FV is $40, Portfolio Insight’s FV is $51, Morningstar’s FV is $54, and Finbox.com’s FV is $62.
My own FV estimate of CSCO is $52.
The average of all these estimates is $52, which happens to match my FV estimate. Given the stock’s current share price of $43.37, it appears that CSCO is trading at a discounted valuation of about 17%.
Here are the most recent Seeking Alpha articles covering CSCO:
Conclusion: CSCO is a high-quality dividend growth stock trading below my fair value estimate of $52. For stocks rated Excellent, I allow a premium valuation of up to 5%. Therefore, my Buy Below price for CSCO is $55 per share. For conservative investors, a buy below $47 would be more appropriate.
Please note that we’re not recommending CSCO or any of the stocks listed in this article. Readers should do their own research on these companies before buying shares.
Be the first to comment