

Adrian Vidal/iStock via Getty Images
The market provided a false positive as its reaction was initially bullish after the Fed hiked rates by 0.75%, but another massive selloff the following day. The S&P 500 closed -3.41% on the week, pushing it further into a bear market as it’s now down -23.39% in 2022. The Nasdaq closed in the green on Friday but still closed the week down -2.01%, which added to its total year decline, pushing it lower by -31.80% YTD. Just like everyone else, I am not immune to market dynamics, and while the Dividend Harvesting portfolio has a strong track record of closing in the green, it fell into the red for the 3rd time since its inception. At the end of week 68, the Dividend Harvesting portfolio was -$467.58 (-7.38%).
I can’t predict what the market will do in the short-term, but historical data has indicated that the markets will rebound and make new highs over time. There has been more talk about whether the U.S economy is in a recession over the previous several weeks. Technically we are not in a recession, even though the inflationary period we’re currently experiencing is making it feel like we are. There needs to be 2 consecutive negative growth prints for GDP for the economic environment to be classified as a recession. While we are not currently in one, that doesn’t mean we won’t go into one. If you are not retiring next year and have dry powder to continuously invest in, recessions are nothing to be afraid of. There have been 12 recessions since 1948. There were 3 occurrences where the market finished in the green 6 months prior, during, and 1 year after the recession ended. There were 6 occurrences where the markets finished in the green during the recession. There was only 1 occurrence where the market finished negative 1 year after a recession. Ultimately the markets go up and to the right when looking at a chart, even when it seems as if a bottom will never be established.
NBER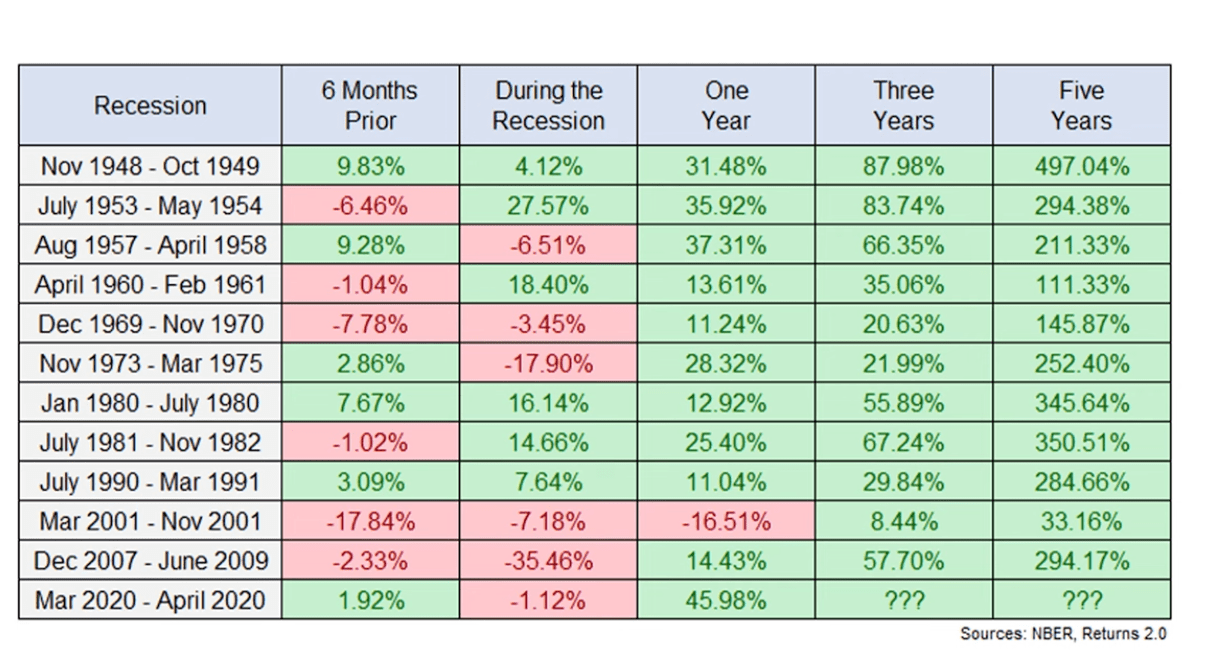
I am certainly not concerned about the Dividend Harvesting portfolio finishing in the red after the close of week 68. This has allowed me to add more to positions that I believe are significantly undervalued. As a long-term investor, I am not concerned if the downtrend lasts another week or another year. I will continue to invest $100 per week in this endeavor and add to dividend-producing positions. I will never understand why investors are so quick to jump on the bandwagon and invest with conviction during bull markets but are so quick to act timid when markets are declining. I look at this type of environment as an opportunity, not as the sky is falling. The Covid-Crash was a cataclysmic event as cities and most of the country shut down for a period. Looking back on that period, even though nobody knew what would happen, it became an amazing buying opportunity in the end. If the economy can bounce back from shutting the country down, then the markets can bounce back from all the negative factors impacting it today. I will continue to reinvest every dividend and look at these prices as opportunities for however long they last. I love shopping when items are on sale, especially stocks, ETFs, and CEFs I want to own more of.
It’s amazing how people click on this series and immediately write a negative comment without either reading the article or just skimming through it without grasping the concept. I started this series due to the number of questions I received regarding where to start with dividend investing. Every investor’s situation is different, and a major misconception about dividend investing is that the initial seed capital needs to be large. I allocate capital toward big tech, funds, dividends, and growth outside of my retirement accounts. These are not my only investments, but I did open a separate account, so I could easily track and document this series. I intentionally created broad diversification throughout the Dividend Harvesting portfolio so I could benefit from sector rotations and mitigate my downside risk. Investors who are too exposed to growth companies or large-cap tech have gotten crushed as the investment landscape changes. On the growth and tech side of my investments, I am feeling the pain as some of my favorite companies, including Alphabet (GOOGL) (GOOG), Amazon (AMZN), and Meta Platforms (META), have been taken to the woodshed.
This series has never been about hitting a target yield, generating a certain amount of profit, or beating the market. I had two specific goals with this series. The first was to create a blueprint for constructing a dividend portfolio by documenting the journey starting from the beginning. The second goal was to illustrate how allocating capital each week toward investing, regardless of the amount, would be beneficial in the long run. Too many people are under the illusion that you need tens of thousands or even hundreds of thousands to benefit from investing. Instead of using my real dividend portfolio as an example, I decided to start a new account, fund it with $100, and add $100 weekly, providing a step-by-step guide to dividend investing. This methodology doesn’t have to be used for dividend investing, and it could be as simple as an S&P index fund or a Total Market fund. Hopefully, this series is inspiring people to invest in their future to attain financial freedom.
Steven Fiorillo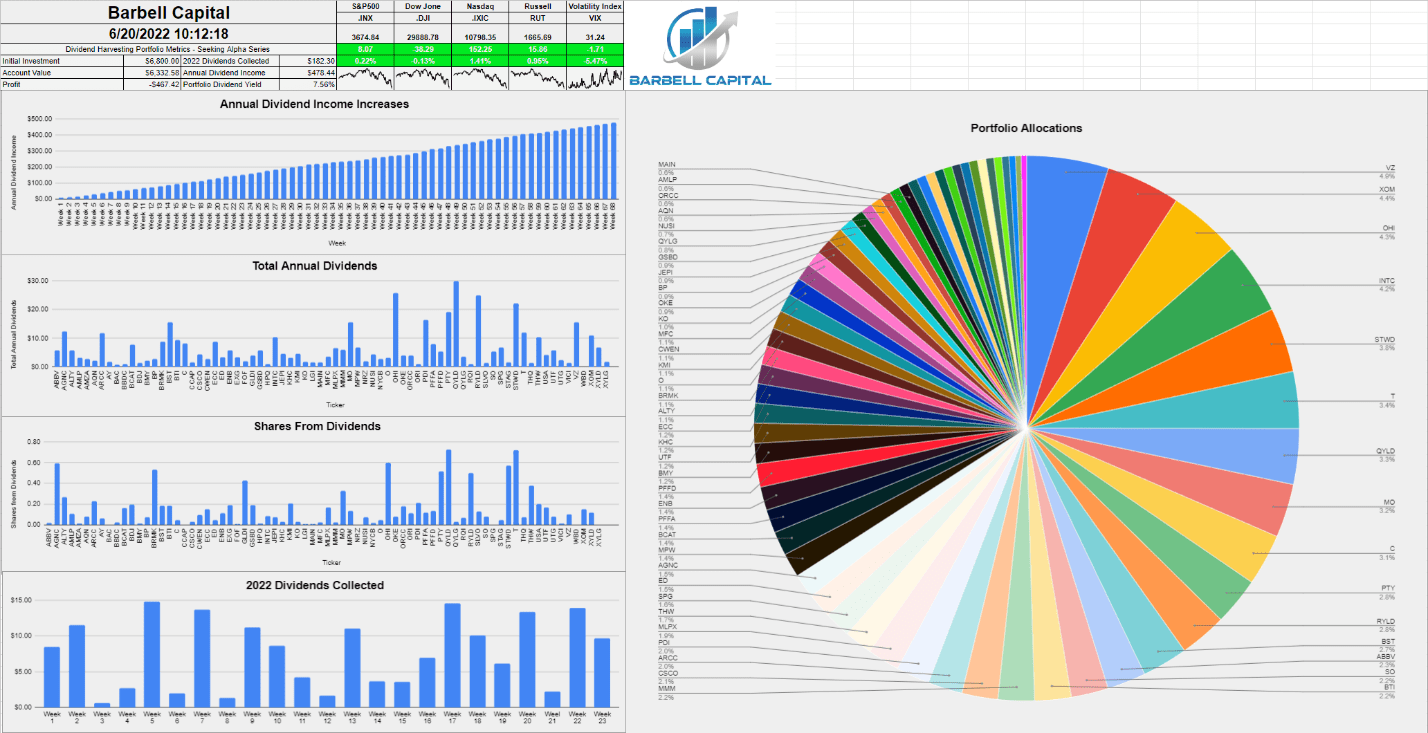
A Historical recap of the Dividend Harvesting portfolio’s investment principals and historical performance
Below are the fundamental rules I have put in place for this portfolio:
- Allocate $100 weekly to this portfolio
- Only invest in dividend-producing investments
- No position can exceed 5% of the portfolio
- No sector can exceed 20% of the portfolio
- All dividends & distributions are to be reinvested
Below is a chart that extends from week 1 thru the current week to illustrate the Dividend Harvesting Portfolio’s Progression
- Blue line is my initial investment $100 in week 1, $1000 in week 10, etc.
- Red line is the account value at the end of each week
- Yellow line is the annual dividend income the Dividend Harvesting Portfolio was projected to generate after that week’s investments and dividends reinvested
Steven Fiorillo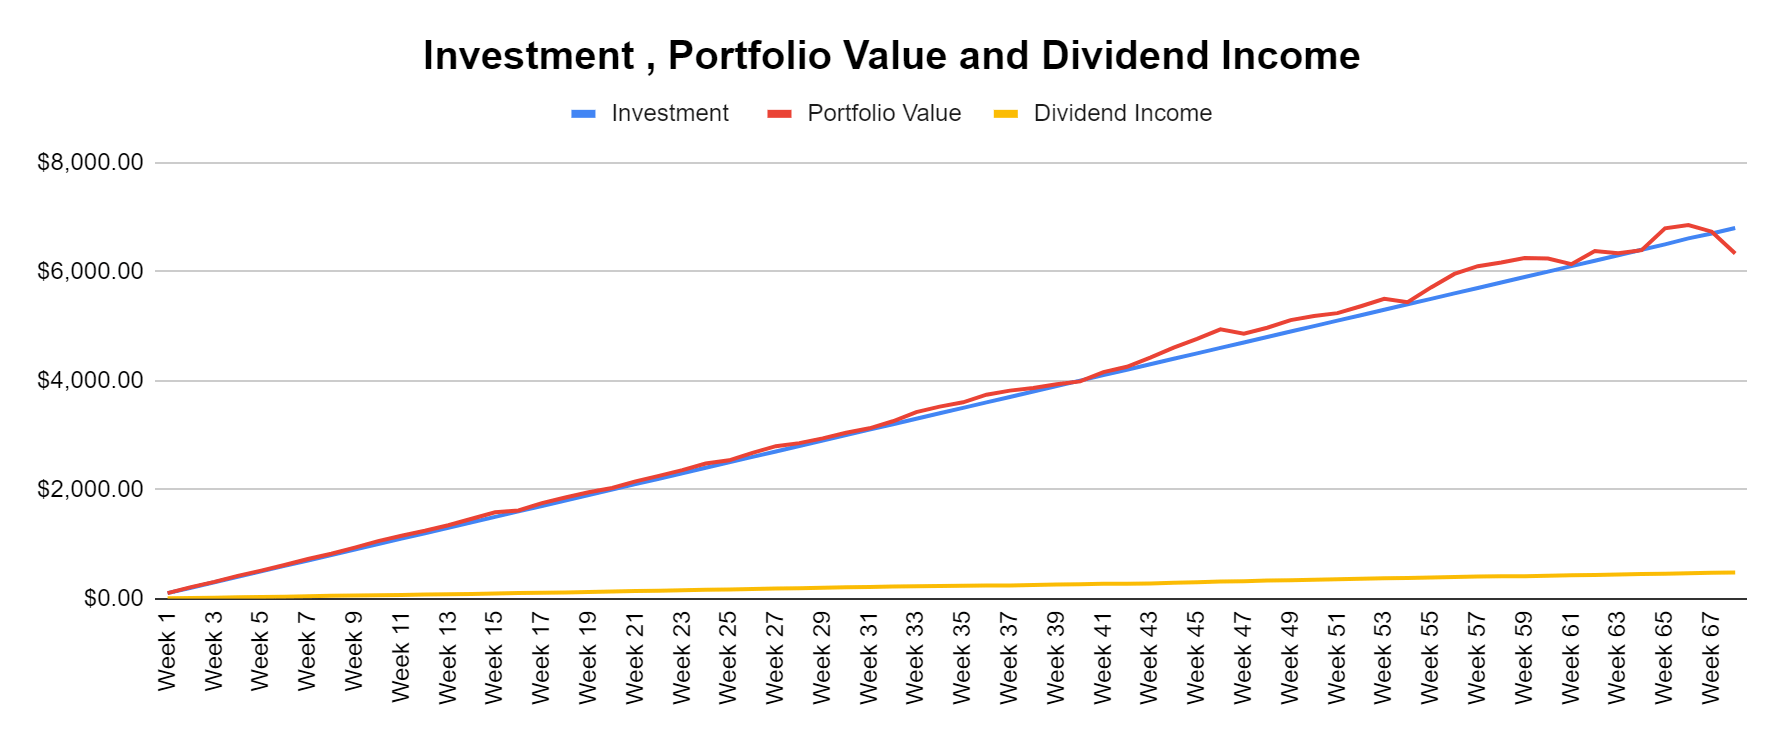
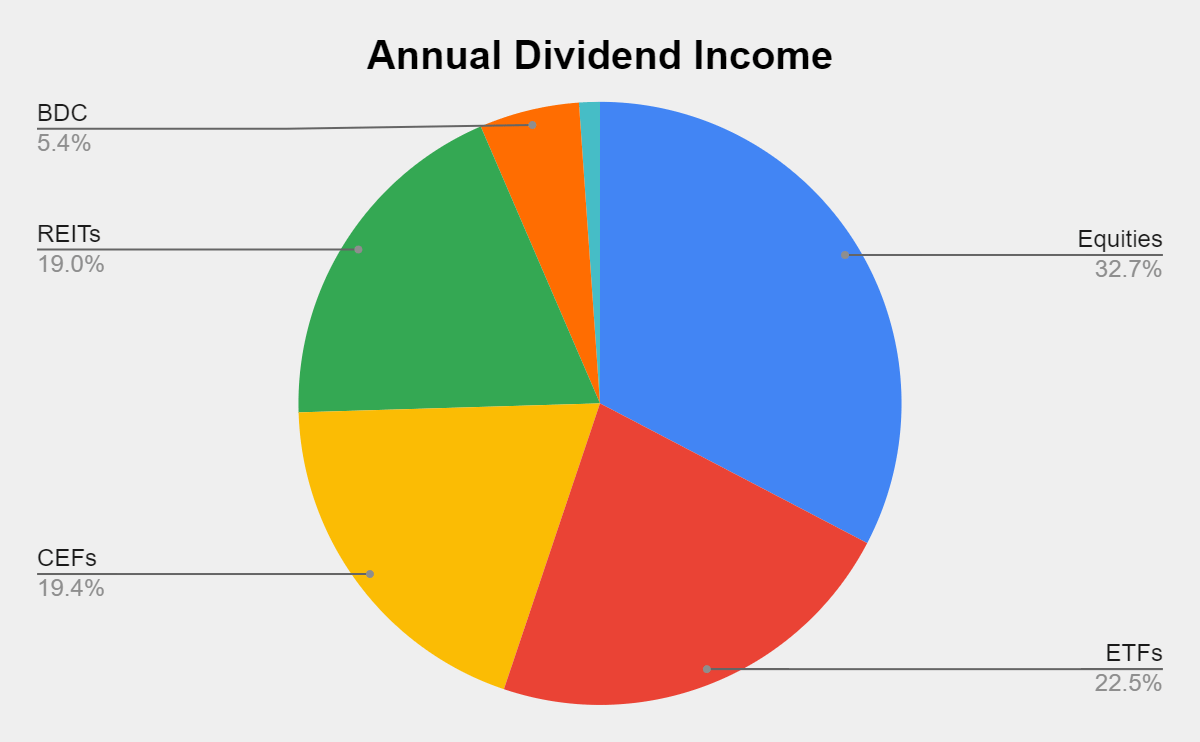
The Dividend Harvesting Portfolio dividend section
Here is how much dividend income is generated per investment basket:
- Equities $156.30 (32.67%)
- ETFs $107.62 (22.49%)
- CEFs $92.63 (19.36%)
- REITs $90.91 (19%)
- BDC $25.64 (5.36%)
- ETNs $5.34 (1.12%)
Steven Fiorillo Steven Fiorillo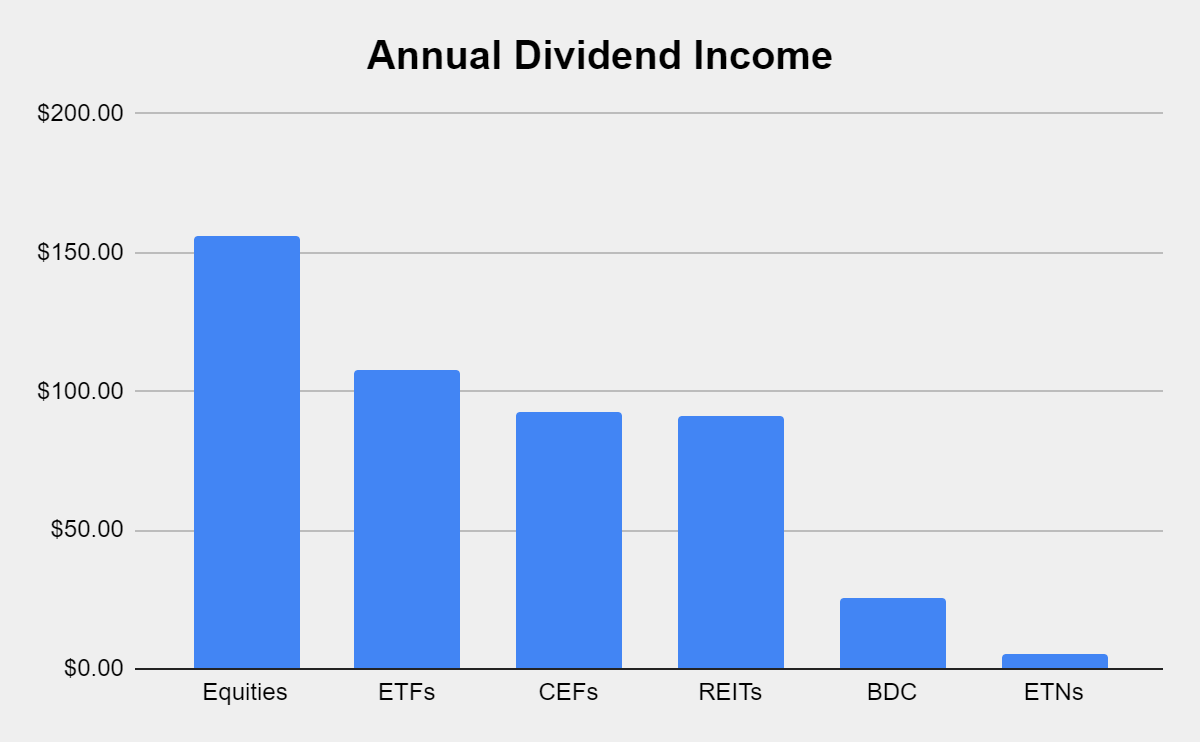
Collecting dividends can serve many functions in a portfolio. Some investors utilize dividends to supplement their income and live off. I am building a dividend portfolio for myself 30 years into the future. Since I am reinvesting every dividend, they serve multiple purposes today. In 2022 alone, I have collected $182.30 in dividend income from 232 dividends across 24 weeks. This has allowed the Dividend Harvesting portfolio to stay in the black while growing the snowball effect. These dividends allow me to gain additional equity in my investments while increasing my future cash flow in down markets. This style of investing isn’t for everyone, but if you’re looking to generate consistent cash flow while mitigating downside risk, this method has worked for me. I am hoping to collect between $450-$500 in dividends in 2022, which will be reinvested, and finish the year generating >$700 in annual dividends.
Steven Fiorillo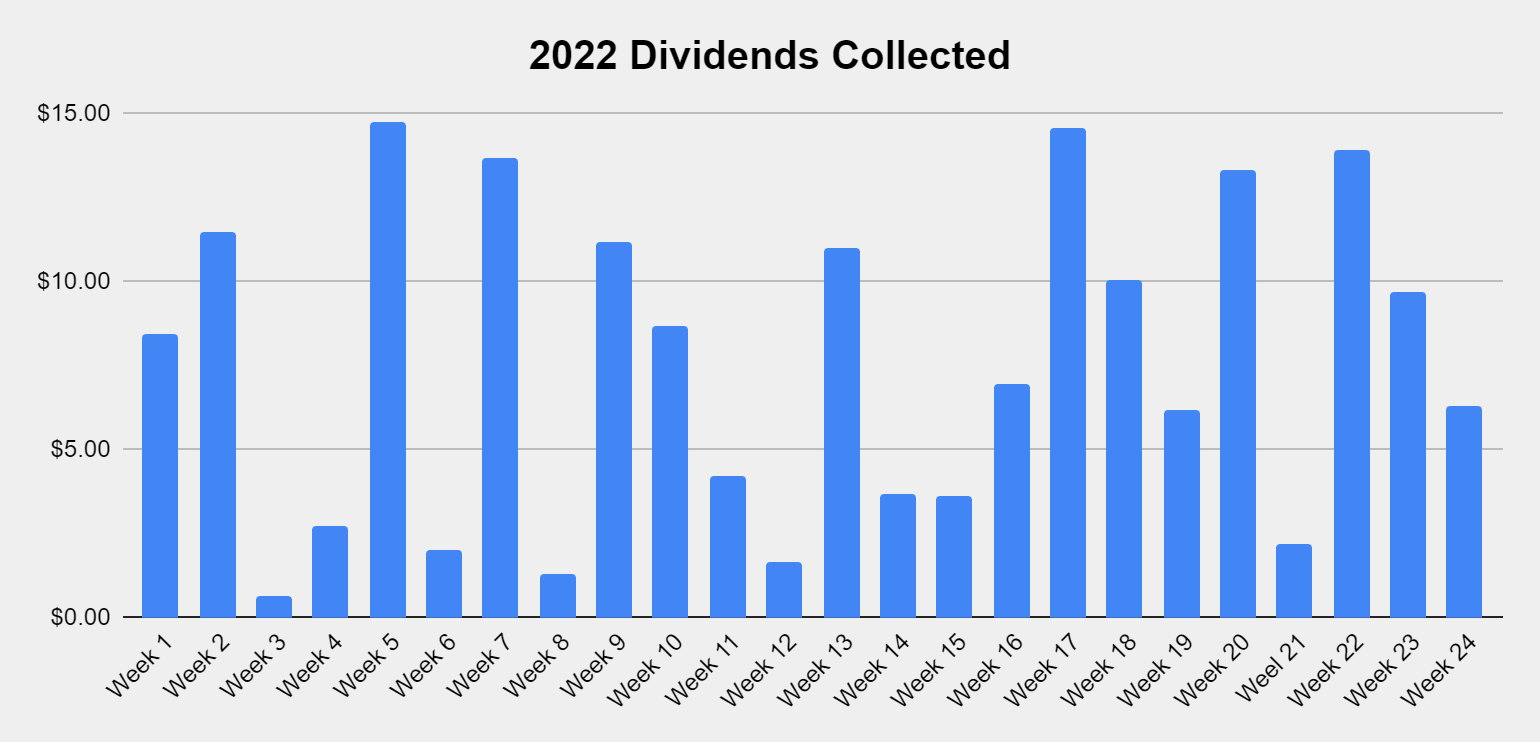
The never-ending stream of dividend income continues to flow within the Dividend Harvesting portfolio. I didn’t add any new positions in week 68, but there are 548 dividends being produced annually. I have my eye on some new positions, and I think this portfolio will defiantly exceed 600 annual dividends and might come closer to 650 annual dividends before 2022 is over.
Steven Fiorillo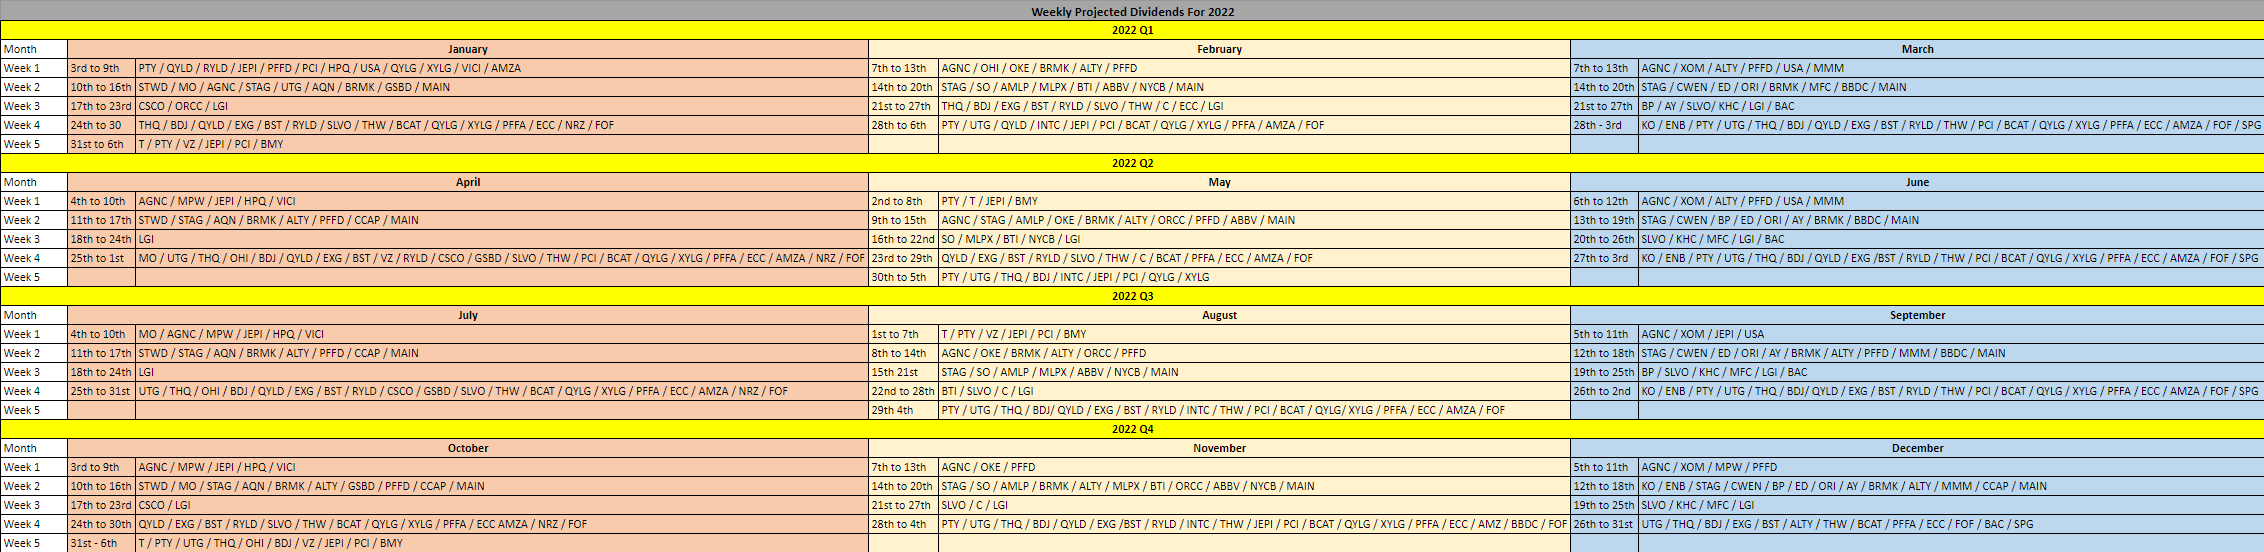
The goal of generating enough income from the dividends to purchase an additional share per year has been the never-ending project of this portfolio. There are now 5 positions that are generating at least 1 share annually through their dividends which include the PIMCO Corporate & Income Opportunity Fund (PTY), Broadmark Realty Capital (BRMK), Starwood Property Trust (STWD), AGNC Investment Corp. (AGNC), the Global X Russell 2000 Covered Call ETF (RYLD), and the Global X NASDAQ 100 Covered Call ETF (QYLD). I am trying to get more of the current positions over the finish line. Eventually, more positions will generate one share per year in dividend income.
|
Shares from Dividends Annually |
||||||||||
|
0-9.9% |
10-19.99% |
20-29.99% |
30-39.99% |
40-49.99% |
50-59.99% |
60-69.99% |
70-79.99% |
80-89.99% |
90-100% |
Generating > 1 share |
|
BP |
MLPX |
KMI |
PFFA |
GLDI |
BCAT |
ARCC |
ECC |
PDI |
OHI |
QYLD |
|
KHC |
C |
INTC |
MO |
BST |
ALTY |
T |
THW |
PTY |
||
|
AMLP |
AQN |
PFFD |
GSBD |
MPW |
USA |
BRMK |
||||
|
CWEN |
XYLD |
UTF |
VZ |
EXG |
RYLD |
|||||
|
JEPI |
QYLG |
NRZ |
ORCC |
AGNC |
||||||
|
UTG |
BDJ |
BTI |
NYCB |
STWD |
||||||
|
SO |
ENB |
NUSI |
SLVO |
|||||||
|
RQI |
XOM |
MFC |
||||||||
|
THQ |
AMZA |
FOF |
||||||||
|
OKE |
LGI |
|||||||||
|
SPG |
CCAP |
|||||||||
|
XYLG |
CSCO |
|||||||||
|
AY |
BBDC |
|||||||||
|
VICI |
||||||||||
|
STAG |
||||||||||
|
O |
||||||||||
|
MMM |
||||||||||
|
ORI |
||||||||||
|
MAIN |
||||||||||
|
ABBV |
||||||||||
|
ED |
||||||||||
|
HPQ |
||||||||||
|
BMY |
||||||||||
|
KO |
||||||||||
|
BAC |
||||||||||
|
WBD |
||||||||||
The Dividend Harvesting portfolio composition
ETFs remain the largest segment of the Dividend Harvesting portfolio. Individual equities make up 48.80% of the portfolio and generate 32.67% of the dividend income, while ETFs, CEFs, REITs, BDCs, and ETNs represent 51.20% of the portfolio and generate 67.32% of the dividend income. I have a 20% maximum sector weight, so when a singular sector gets close to that level, I make sure capital is allocated away from that area to balance things out. In 2022, I will make an effort to even out these portfolio percentages. As more capital is deployed, the bottom half of the portfolio weighting will increase.
|
Industry |
Investment |
Portfolio Total |
% of Portfolio |
|
ETFs |
$1,016.41 |
$6,332.58 |
16.05% |
|
REIT |
$990.00 |
$6,332.58 |
15.63% |
|
Closed End Funds |
$909.58 |
$6,332.58 |
14.36% |
|
Oil, Gas & Consumable Fuels |
$539.30 |
$6,332.58 |
8.52% |
|
Communication Services |
$507.00 |
$6,332.58 |
8.01% |
|
Consumer Staples |
$462.95 |
$6,332.58 |
7.31% |
|
Technology |
$455.82 |
$6,332.58 |
7.20% |
|
Financials |
$415.55 |
$6,332.58 |
6.56% |
|
BDC |
$279.82 |
$6,332.58 |
4.42% |
|
Utility |
$266.83 |
$6,332.58 |
4.21% |
|
Pharmaceuticals |
$215.78 |
$6,332.58 |
3.41% |
|
Industrials |
$132.57 |
$6,332.58 |
2.09% |
|
Independent Power & Renewable Electricity Producers |
$100.52 |
$6,332.58 |
1.59% |
|
ETN |
$40.18 |
$6,332.58 |
0.63% |
|
Cash |
$0.28 |
$6,332.58 |
0.00% |
Exxon Mobil (XOM), Verizon (VZ), and Omega Healthcare Investors (OHI) each remain above 4% of the portfolio holdings. VZ is close to the 5% threshold. I will keep my eye on these, but with no plans of adding to these 3 positions, I am not that concerned about XOM, OHI, or VZ exceeding 5%.
I was asked a question about if I would trim a position if, for some reason, it caught a bid and appreciated unexpectedly. I thought I would add my comment to the series. Hypothetically if VZ went to $70, it would certainly represent more than 5% of the portfolio next week. I wouldn’t sell a single share. The reason is that I am still allocating capital weekly, and the new capital would dilute its percentage of the portfolio over time. If this was a much larger portfolio that I wasn’t adding to, my answer would be different, and I would probably trim a bit.
This doesn’t mean that I wouldn’t take profits on positions in the portfolio, and I have considered selling XOM in the future. XOM has caught fire, and I am slightly worried about this administration. While I believe XOM is a great long-term hold, this could turn into a situation where I sell in the future and reestablish a position if it sells off. I really need to watch XOM and see what happens.
|
Week 68 Top 10 By % |
|
|
VZ |
4.73% |
|
XOM |
4.28% |
|
OHI |
4.20% |
|
INTC |
4.14% |
|
STWD |
3.73% |
|
T |
3.28% |
|
QYLD |
3.21% |
|
MO |
3.10% |
|
C |
2.97% |
|
PTY |
2.76% |
Week 68 additions
In week 68 I added 1 share to each of the current positions in the Dividend Harvesting portfolio:
INTC
- Shares of INTC have fallen off a cliff as they are -35.34% over the past year and -30.52% in 2022. Shares of INTC have fallen so far that its dividend is now yielding 3.95%. INTC has provided shareholders with 8 consecutive years of dividend growth, and its current payout ratio is 28.43%. INTC and Advanced Micro Devices (AMD) are the only games in town for x86 architecture and have a stranglehold on the PC market. The last time AMD looked to ellipse INTC in market share was 2006, and there is still a large spread between the two. Both companies are coming out with new chips in the fall, and I believe INTC will always be a viable option. Even if INTC’s turnaround plan takes years to implement, I will be happy adding shares along the way and reinvesting the dividends.
PassMark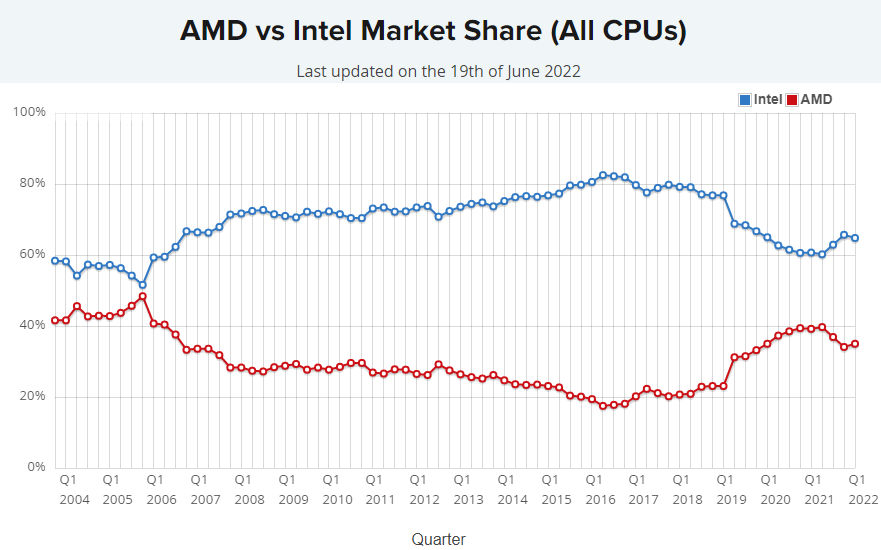
CSCO
- CSCO is another big tech company that has seen better days. YTD CSCO is -31.30%, and its dividend is now yielding 3.5%. CSCO has provided investors with 10 consecutive years of dividend growth and has a 44.21% payout ratio. CSCO is the backbone of many corporations in regard to their networking infrastructure. CSCO has been investing in the software side of the business and is diversifying its revenue streams, so reoccurring revenue is a larger part of its revenue mix. This is another company that I am happily adding to at depressed levels as they generate large levels of FCF, buyback shares, and provide dividend increases.
QYLD
- I recently wrote an article on QYLD and still view this ETF as a great income investment. QYLD has followed the market down, and I am happy to add QYLD under $18 per share. No matter what price QYLD trades at, if it’s $17 or $22, you will see me adding to it. Every distribution will be reinvested, and as its yield is over 15%, it’s hard to resist adding at this level.
Week 69 Gameplan
My game plan for week 69 has changed several times, but I think I have come to a conclusion. I wrote an article on Simon Property Group (SPG) several weeks ago, and it was trading at a great valuation compared to its peers. Since I had invested in SPG its decline has continued, and I plan on dollar-cost averaging into this investment. SPG is now yielding 7.11%, and I believe I added my first share at around $114. If I can add a share at $96, it would bring my average down to $105.
Conclusion
My investing philosophy is to be a long-term investor and keep buying. I will continue buying individual equities and funds each week, and I am looking at this investing environment as an opportunity. Week 68 was rough as it was the 3rd time this portfolio has finished in the red, but over the long run, I think it will be a blip on the radar. I think there are a lot of companies on sale, and while they may go lower, ultimately, the markets will go up. Please start sending in suggestions for week 70 as reader suggestion week is approaching. In week 70, I will use the $100 allocation to add new positions based on reader suggestions or add to previous positions I added from reader suggestions. Thanks for continuing to read this series, and please leave your comments below.
Be the first to comment