

Pgiam/iStock via Getty Images
This article is part of a continuing series of articles (here) on how to use investor buying in exchange-traded funds (“ETFs”) to help determine the direction of the stock market, and specific sectors of it. These articles are about investor sentiment and the measurement of “investor expectations.” Every article will have follow-up articles until the concept behind that original article is complete. This one focuses on ProShares UltraPro Short S&P 500 ETF (NYSEARCA:SPXU) – a ProShares ETF that goes 3x short the S&P 500.
SPXU
Named the UltraPro Short S&P500, SPXU is one of numerous ProShares ETF’s that go long or short the S&P 500. Some are leveraged 1x, some 2x, while others are leveraged 3x. SPXU is leveraged 3x. As of August 26th, it had 69 million shares outstanding with $1.61 billion in total assets.
History of SPXU Net Asset Value (Michael McDonald)
This graph shows the price history of SPXU since inception. It started with an adjusted price of $32,000 in 2009, and it’s currently down to $14.75. That’s an annualized loss of 44% per year. Of course, we’ve essentially been in a long-term bull market since 2009, so this is not surprising for a highly leveraged, short ETF.
But other factors play into this and make it worse. To achieve a 3x short position, the fund’s money managers have to use S&P futures and sometimes S&P options. These come with carrying costs and varying price premiums over spot. In a nutshell, these additional factors accentuate the losses in SPXU.
The situation is made extra hard because of an additional fact. Stock prices advance 67% of the time and decline only 33% of the time. So, it’s twice as hard to find a market top than it is a market bottom. However, since the price gains can be very large if you succeed, the temptation to try is always there.
We highlighted on the chart four moments in the last 11 years – labelled A, B, C and D, where it would have been highly profitable to short the market using SPXU if your timing was perfect.
(A) was the two-week market decline in July and August of 2011 caused by the global financial crisis. In two weeks SPXU rose 60.5%
(B) was a four week decline in August of 2015 where SPXU went from $651.8 to $912.8 for a 40% increase.
(C) was the three-month market decline from early October 2018 to the end of December 2018 where SPXU rose 81%.
(D) was the five week, COVID-induced, bear market where SPXU rose 139%.
Timing these moments, however, is very difficult. You can lose half the expected gains if you’re right about the decline but are three to six months early.
SPXU Shares Outstanding
The chart below plots the number of shares outstanding in SPXU over the last two and a half years. Notice the huge increase in shares from July 1st until August 1st. The number of shares rose from 40,000 to 100,000, which is 150%, in just one month! Since then, the number has come back somewhat to around 70,000. We believe this is a very positive indicator for higher prices in the stock market. It represents simply too much bearish sentiment, which is both a necessary and sufficient condition for a market bottom.
Shares Outstanding In SPXU (Michael McDonald)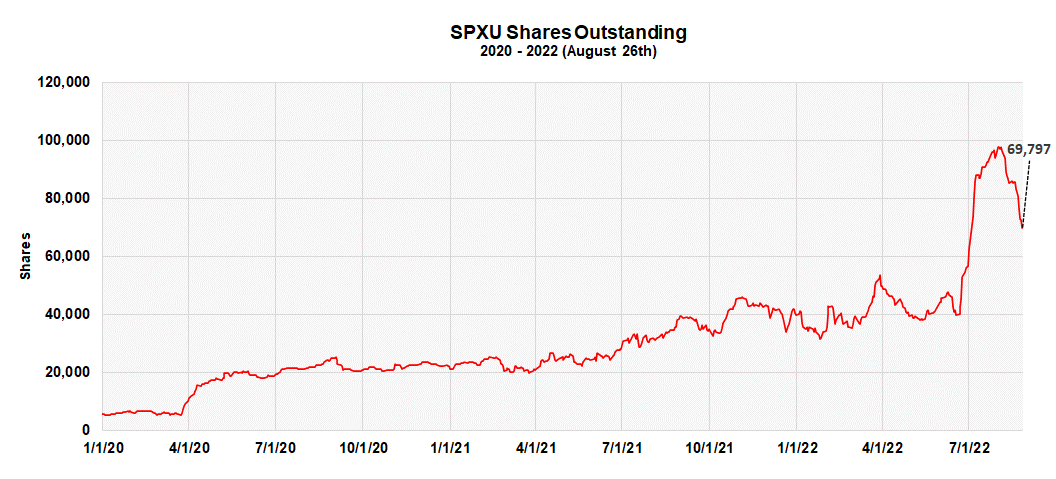
This is also confirmed by average daily buying in SPXU, which is shown in the next graph. Notice the large increases in buying of SPXU that have historically occurred just prior to major advances in stock prices.
Buying in SPXU as % of Assets (Michael McDonald)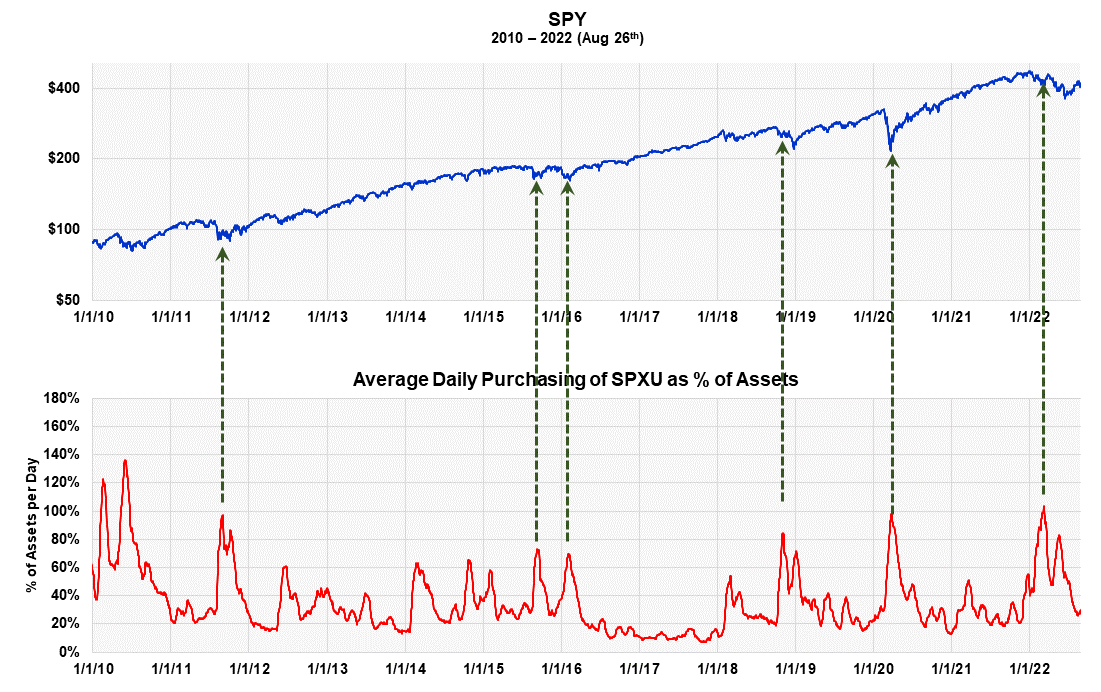
Contrary Opinion
Other, well tested indicators still show extreme levels of bearish sentiment. This is very important because, while the economic picture is always different, extremely negative sentiment is the one, common denominator at the start of every bull market. Many investors don’t know this and get lost in the arguments and alarming economic picture of the moment. Because of this, we are highlighting the data and theory that supports this at the end of every article.
The Master Sentiment Indicator Continues to Point to Higher Stock Prices
We combine seven classic sentiment indicators to form one Master Sentiment Indicator. The seven indictors that make up the composite are:
The CBOE equity puts and calls ratio
The CBOE total puts and calls ratio
The Commitment of Trader data on the E-mini S&P Futures
The Buying Level in the SH ProShares ETF
The Exposure Level of the National Association of Active Investment Managers
The daily Hulbert Stock and Nasdaq Sentiment readings
The AAII Sentiment Survey.
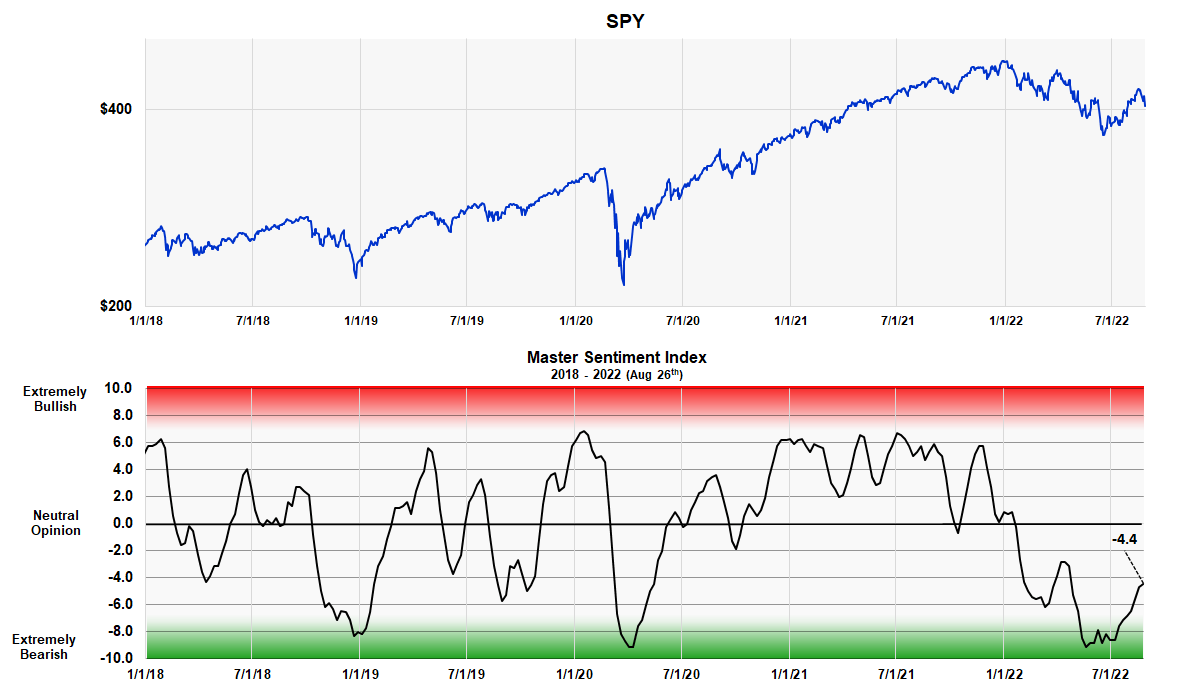
The MSI is designed to locate major market lows. It’s shown in the next two charts – one is a long-term view from 2007, the other starts in 2018 and shows more detail. The indicator is currently -4.4, which is still relatively low after a four-week rally and, in our opinion, points to higher prices.
Master Sentiment Index – long term view (Michael McDonald) Master Sentiment Index – Shorter Term View (Michael McDonald)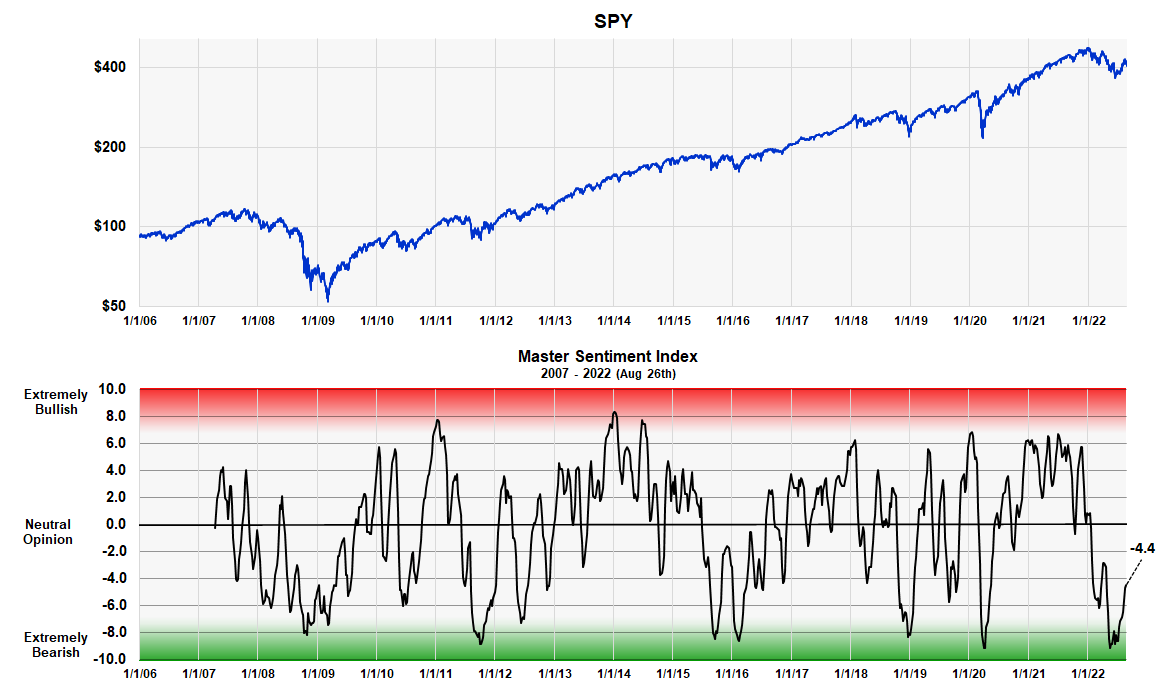
Forming the Master Sentiment Indicator
Combining multiple indicators to form one sentiment indicator is not easy. How do you combine a puts and calls ratio of 1.0 with a 40% Investor’s Intelligence bearish percent? When forming a composite, everything has to be mathematically consistent. We accomplished it in the following way.
We took each indicator back as far as history allowed (the smallest time period being 17 years) and determined the range of values that contained the highest 5% of its values. Then we determined the range of values that contained the next highest 5%. This procedure was continued in 5% increments down to the 5% band that contained the smallest values. This activity allowed us to put every indicator on the same 21 range scale which was labeled 10 to -10.
We then added each indicator’s position number (10 to -10), which determines where it is historically, and divided the total by the number of indicators in the composite. Out came a composite number between 10 and -10 that represented the average bracket value of all the sentiment indicators.
The MSI Red and Green Zones
As you can see, the MSI oscillates between 10 and -10. The large, grey area in the middle represents periods when there is no extreme opinion. The red area shows when the indicator is getting into the “extremely bullish” range. The lower green band shows when it’s getting into the “extremely bearish” range. There is no sudden demarcation, but instead graduated numbers that shows greater or lesser degrees of sentiment. The chart clearly shows how recent levels compare to readings at major lows over the last 16 years.
The MSI Table
The table shows the ranking of each of the seven components that make up the composite, as well as the composite itself.
Master Sentiment Index and Its Indicator Components (Michael McDonald)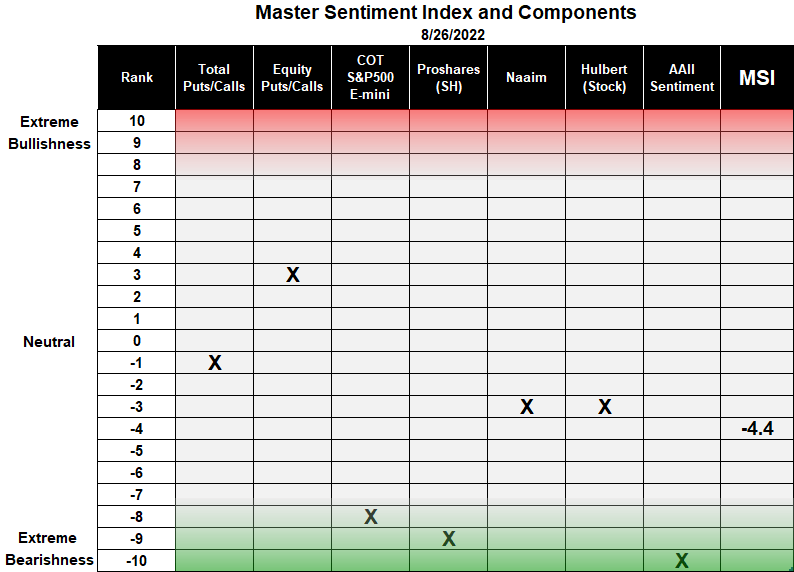
The first column in the table lists the 21 rankings that go from +10 to -10. This is followed by the names of the seven indicators used in the composite with an X showing the current ranking of each. Two of these indicators – the buying of ProShares Short S&P 500 ETF and the short position of asset managers in the S&P 500 E-mini futures – were explained in Seeking Alpha articles (here) and (here). The last column displays the ranking number of the MSI index, which on August 26 was -4.4.
Conclusion
We recommend investors avoid SPXU unless they have a proven track record of correctly timing market declines. But since the market only declines 33% of the time, finding the start of a sudden decline is very difficult. We also don’t think this is the right time due to our belief that the market is ready to begin a major advance.
However, purchasing SPXU at this time to hedge against possible catastrophic events does make sense for a small portion of one’s assets. But the position should be terminated as soon as one thinks the event risk has passed.
Be the first to comment