

Drazen_
Fundamental 10-Step Analysis Of United Rentals Health & Valuation
It’s been one year since we last looked at United Rentals, Inc. (NYSE:URI), which, at the time, was sitting at $304 per share in early July 2021. Having surged over 100% from the prior twelve months in 2021, the valuation and fundamentals still looked appealing – and now the nearly $22B market cap has declined to a $17.3B market cap. Is the pullback in line with overall market weakness in 2022 or has there been a change in the fundamentals that warrant concern with the equity? Let’s take a look at the current share price’s justification by valuation metrics and the fundamentals over the past 5 years.
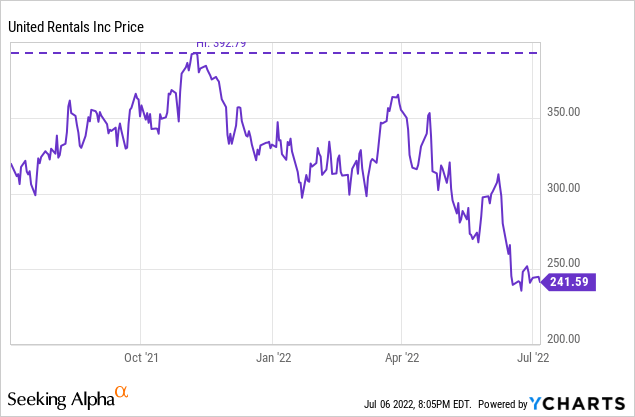
With a $17.3B market cap as of July 6, 2022, United Rentals sits just over 38.5% off from its 52-week high of $392.79 – and is just barely above its 52-week low at $241.59 at present. Management, along with CEO Matthew Flannery, believes 2022 will provide record demand for United Rentals even despite concerns of a weakening economy, and with a depressed share price, this is an appealing entry point at present. Let’s dig deeper.
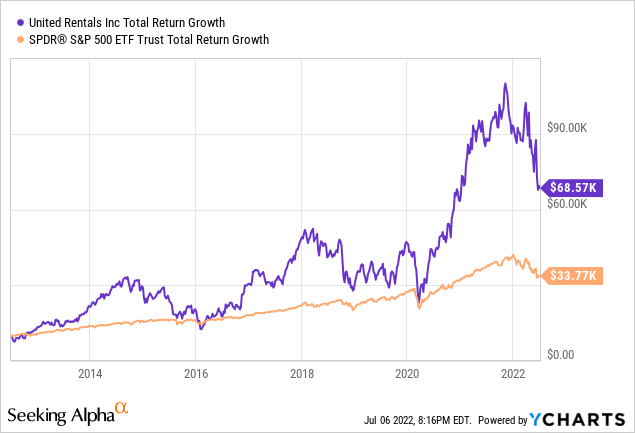
As the graph below shows, investors in United Rentals have far exceeded the S&P 500 over the last 10 years even with the latest cool-off factored in, when accounting for price growth of $10,000. In fact, URI has more than doubled the return, albeit with a much rockier ride as would be expected from a cyclical industrial. Does United Rentals have the economic setup required for a prolonged recovery forward? Let’s take a look.
Using a 10-Step Fundamental Analysis detailed further here, I will examine 10 important components of United Rentals and how the company measures up on each metric, either assigning a 1/1, 0.5/1, or a 0/1 for each of the 10 components.
Revenue & Income Growing at Impressive Rates, With Management & Analysts Expecting Continued Growth
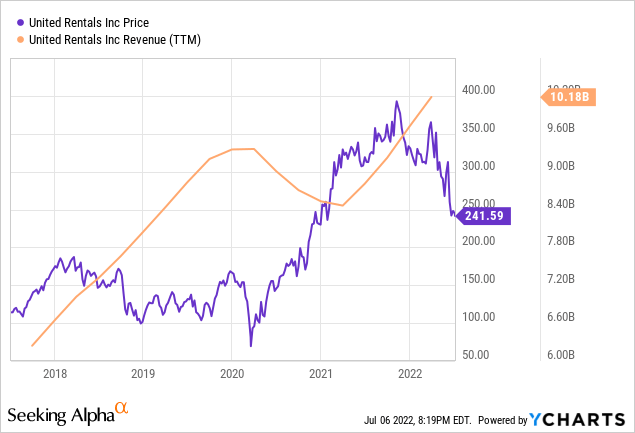
Looking at trailing 12-month numbers as of March 31, 2022, for operating revenue over the past 5 years, United Rentals has increased from $5.808B to $10.18B – representing an 11.86% CAGR. This revenue increase has come from a wave of industry changes that benefit United Rentals significantly – contractors and construction firms no longer own equipment in as great of quantity as before and now find it more advantageous to rent equipment for their jobs. This factor is a massive benefit to United Rentals. In fact, the CEO specifically noted this factor with backhoes and other large equipment pieces in the April 2022 conference call.
What’s more, due to the significant amount of share buyback activity over the 5-year period, on a per-share basis the revenue increases are even more dramatic – from $68.72/share in Q12017 to a staggering $142.15/share in Q12022: representing an impressive 15.65% CAGR in revenue over the 5-year stanza. This is the effect of share buybacks and how they can even further enhance growth for the investor.
Looking slightly forward, management is guiding toward $11.1B to $11.5B for fiscal 2022 (Source), which is up 16% from the $9.72B in fiscal 2021 – an increase from the past 5 years of nearly 12% compounded growth in revenues.
Revenue Growth: $5.808B -> $10.18B over 5 years / 11.86% CAGR with Impressive 15.65% CAGR/share |
I have the utmost confidence in revenues going forward and management has steered the company impressively over the past 5 years to double-digit compounded growth. Remember that the multibillion-dollar Infrastructure Investment and Jobs Acts (IIJA) will be a major catalyst beginning in 2023, regardless of any economic headwinds. Score: 1/1
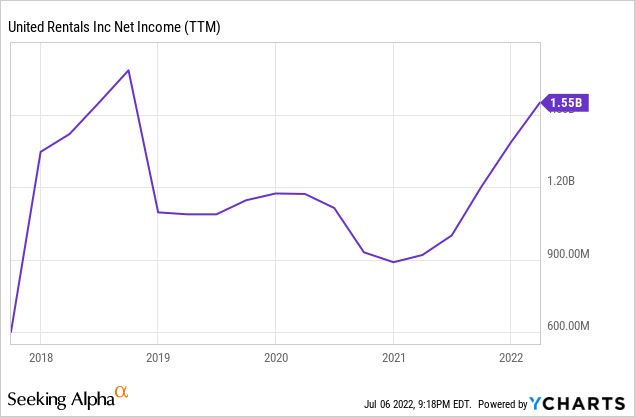
Net income over the past 5 years has grown from $583MM to $1.55B on a trailing twelve-month basis representing a massive 21.6% CAGR during the period. This was achieved in two ways that show not only management’s competence in growing the business but also management’s skill in running the business efficiently: first revenue growth came in at nearly 12% compounded during the 5-year period and then bottom-line margins increased from 10% in 2017 to over 15% in the trailing twelve months of 1st quarter 2022.
While I consider free cash flow to be a more measured and meaningful measure of health, there is still meaning to be found in the earnings data. The bottom line earnings margin is especially impressive when considering the toll depreciation takes on earnings in a business beset by high capital expenditures with equipment.
On a per-share basis over 5 years taking into account buybacks, income went from $6.90/share to $21.64/share, or a 25.68% CAGR during the period. This is unbelievably impressive and alone speaks highly of management’s ability to not only grow the business but also shrink the share count even in a business that requires significant reinvestment into equipment.
Income Growth: $583MM -> $1.55B over 5 years, 21.6% CAGR / Over 25% CAGR Per Share – Incredible! |
Again, while I value the impacts of free cash flow more than GAAP earnings, there is importance to this metric, and United Rentals absolutely knocks it out of the park with margin expansion and the ability to bring more down to the bottom line for shareholders. Score: 1/1
Balance Sheet Experiences Slight Bump in The Road Gearing Up For Continued Growth
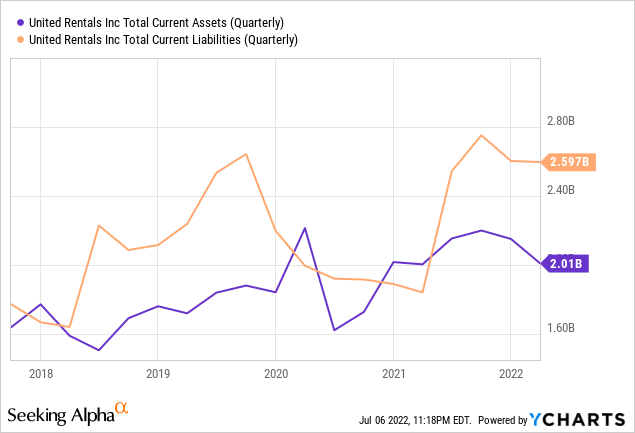
An important factor in determining liquidity, United Rentals, due to the industry it operates in, has struggled to keep current assets above current liabilities for many years and has let current liabilities balloon towards their highest level ever as the business continues to grow rapidly. While this isn’t ideal, there are some industries where the imbalance is more normal and this industry of heavy equipment purchases is one where this is fairly standard.
Assets vs. Liabilities: $2.01B current assets v. $2.597B current liabilities / Not ideal, but also not unexpected |
An expected, though not ideal situation that does not appear to massively harm the company’s balance sheet. Score: 0.5/1
When we last looked at the debt situation at United Rentals one year ago, the situation was very positive – let’s re-visit.
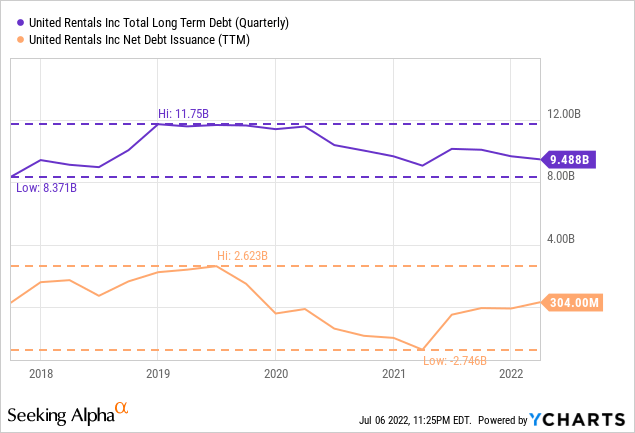
One of the biggest factors representing management’s strong focus on long term health of the business is the debt reduction that has taken place in the past 12 months. As of March 31, 2021 — United Rentals total long term debt stands at $9.082B, representing a nearly 23% reduction from the debt highs of early 2020. United Rentals has paid off nearly $2.7B in debt in just over 1 year, leading to a much stronger balance sheet and decreased financial leverage. — June 11, 2021 (Source)
Unfortunately, this progress has not continued with gusto and has actually reversed with approximately $460MM more long-term debt than one year ago representing net debt issuance during the year. While nowhere near the debt issuance of mid-2019 at over $2.5B, it still represents a shift in progress and a reversion towards issuing debt in a time when interest rates are significantly higher than any point in the last 10 years, which will become a drag on net income. To be clear, however, the shift is small relatively speaking compared to overall market capitalization + debt ratios and is likely management ramping up towards anticipated growth and preparing for opportunities.
Long Term Debt: Increasing, But Still More Than Manageable With Regards to Debt Ratios |
While I obviously would love to see debt reduction continuing to progress uninterrupted, especially during higher interest rate environments, progress is not always a straight-line and management is ramping up capital spending from a historically weak 2020 spending cycle (only $4.16/share capital spending). This is the qualitative reasoning of investing – realizing the meaning behind the numbers and why they are occurring. Score: 1/1
Great Return On Capital Coupled With Strong Share Decreases = Long Term Winning Formula for United Rentals
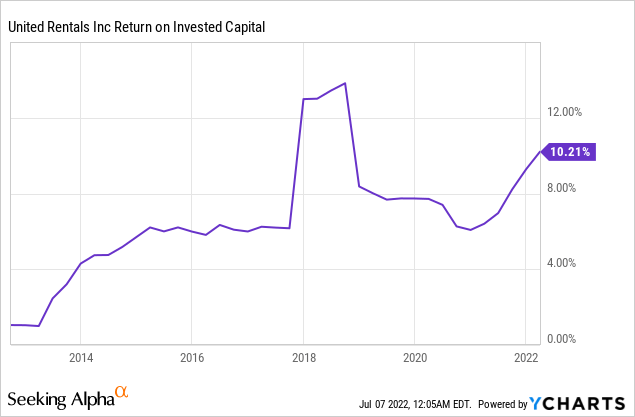
After noting the slight increase of long-term debt recently for United Rentals, it seems an ideal opportunity to examine management’s returns from the capital invested back into the business to see how this capital is being allocated – responsibly or otherwise. Return on invested capital is one of the most reliable measures of an engaged and knowledgeable management team – how they invest and allocate capital into the business. The average of all S&P 500 companies is approximately 7%. Looking at improving upon the S&P’s average and towards companies deploying capital into high-quality investments, I look for businesses earning more than 10% return on invested capital.
Return on invested capital is a financial metric favored by Charlie Munger, stating “It’s obvious that if a company generates high returns on capital and reinvests at high returns, it will do well.” (Source). With a 10.21% return on invested capital at present, United Rentals management is deploying capital at rates above the market average. YCharts does show a slight discrepancy from ValueLine, which pegs the values as noted below at 12.2% for 2021, and projected higher for fiscal 2022 & 2023 at 14.5%.
ValueLine
This return on invested capital in the low-to-mid teens depending on source is certainly above average, but is particularly impressive when considering just how much capital is required to be spent in this industry of equipment rentals (over $2B in fiscal 2021 alone) – this is how nearly 90% of revenues are earned is through the rental of capital equipment. Therefore, this figure of return on invested capital should likely mirror returns over time.
Investment Returns: 10.2%-14.5% ROIC avg. at present – Great Overall, Particularly in This Industry |
An important metric scores well for United Rentals, especially in such a capital-intensive industry. Score: 1/1
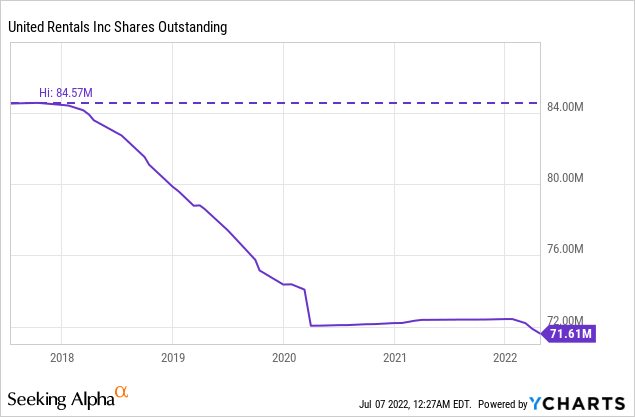
This is the one place on a chart where seeing a precipitous decline should bring an investor complete joy – the shares outstanding. United Rentals has managed to decrease the shares of the company from 84.5MM in the beginning of 2018 to 72MM by Q12020 just before the pandemic – a nearly 15% decrease in just over 2 years. Now, after a little less than 2 years of capital preservation and re-investment in the business, the buybacks are beginning again with vigor. We saw how this total decrease in share count boosted per-share revenue and income figures, leading to a compounding effect internally that leads to higher share prices over time. With no dividend, share buybacks and capital reinvestment are the two components of increasing share price for shareholder return United Rentals offers.
Buybacks: 84.57MM -> 71.61MM shares over 5 years, 15.3% reduction overall / Remarkable Progress |
While repurchasing was halted for 2 years during the pandemic, the aggressive share buybacks did wonders for per share growth in terms of all metrics. 15% is a very strong figure that appears to be re-starting, hopefully with vigor. Score: 1/1
United Rentals has never provided shareholders with a dividend, preferring to utilize free cash flow towards share buybacks, company acquisitions, and re-investing in capital expenditures to fuel further growth and expansion. This pro-shareholder choice by management allowed maximum flexibility during the pandemic, as opposed to losing investor confidence by suspending a dividend. I also personally believe that a lack of a dividend tends to encourage more long-term holders of the business, as shareholders tend to appreciate the internal “snowball” compounding effect.
Dividend: $0 dividend annual, 0% yield / Allowed Great Flexibility During Pandemic & Maximum Buyback |
Score: 1/1
Very Strong Free Cash Flow Increases Signal Stability In The Future
From the standpoint of a company’s operational strength and long-term stability, free cash flow represents a very meaningful metric and the primary factor I look towards when creating a valuation metric and measuring long-term stability and growth. Quite simply – this factor is of great importance. In this industry in particular however, it is important to note two unique factors that play an important role in cash flow as well:
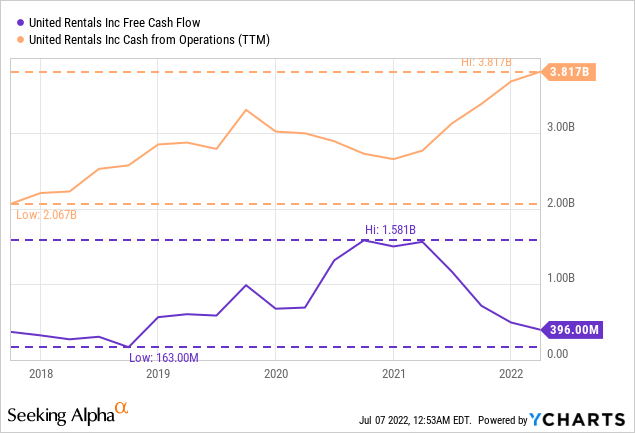
1) Normally free cash flow is calculated using cash from operations minus capital expenditures, but in the case of United Rentals, using cash from operations minus NET capital expenditures (purchases less dispositions or sales of property plant and equipment or PPE) makes greater sense due to the fact that United Rentals is frequently upgrading equipment and selling off old equipment in the process. I will be using NET capital expenditures in calculating free cash flow which is not reflected in the “free cash flow” chart above, and
2) United Rentals is ramping up purchases significantly in order to continue expansion and growth, which eats into free cash flow as a matter of capital expenditures into property, plant and equipment. In order to show the health of the business from a cash standpoint, I also want to highlight cash from operations to show how much cash flow the business has to place towards new equipment & upgraded equipment, as well as cash flow for buybacks. Ultimately the cash from operations is the impetus behind both of these aspects which serve as the two primary uses for cash for the business.
#1 Free Cash Flow: This calculation of free cash flow includes net PPE, and has been growing slower than revenue and income due to the constant reinvestment required for growth. Looking at the past 5 years on a trailing twelve month basis, United Rentals has grown free cash flow from $1B in 2017 to $1.336B in 2022, at a roughly 6% CAGR. This was lower than I expected upon first calculation, but makes sense with the heavy reinvestment required to grow. Unlike with other businesses, all of the growth investment comes at a direct hit to free cash flow in the equipment rental business. On a per-share basis, due to share re-purchases, the numbers are enhanced: $11.83/share in 2017 to $18.66/share in 2022, or a 9.5% CAGR – much better!
#2 Cash From Operations: This calculation shows the raw ability for the company to investment in PPE and buyback shares. Looking at the past 5 years on a trailing twelve month basis, United Rentals has grown cash from operations from $1.959B in 2017 to $3.817B in 2022, at a roughly 14.3% CAGR near double. On a per-share basis, due to share re-purchases, the numbers are again enhanced: $23.18/share in 2017 to $53.30/share in 2022, or a 18.1% CAGR. This internal compounding is truly incredible and allows for future growth, expansion, and share buybacks.
That double in free cash flow translated nicely into share price – 5 years ago the shares were at $112, today they are at $241 – a double. Look at that, the market is based on fundamentals sometimes.
Cash Flow: $1B -> $1.336B in 5 yr & Cash From Operations at 18% CAGR Over 5 Yrs More Than Double |
Over the past 5 years, the cash from operations on a per-share basis assisted greatly by buybacks lead to more than a double in the share price. Score: 1/1
Now for the component of valuation with regards to United Rentals: Let’s look at a few methods, earnings, free cash flow, and cash from operations.
United Rentals, based on the $17.3B market cap, is selling for 12.72 times free cash flow for the trailing twelve months – representing a 7.86% initial rate of return based on free cash flow with a 6% CAGR free cash flow growth over the past 5 years.
United Rentals, based on the $17.3B market cap, is selling for 11.16 times earnings for the trailing twelve months – representing a 8.96% initial rate of return based on earnings with a 21.6% CAGR earnings growth over the past 5 years.
United Rentals, based on the $17.3B market cap, is selling for 4.53 times cash from operations for the trailing twelve months – representing a 22.07% initial rate of return based on cash from operations with a 14.3% CAGR cash from operations growth over the past 5 years.
By my standard metrics of looking for growth companies selling for under 20 times free cash flow, the valuation of United Rentals is very appealing from all three aspects noted above.
Valuation: 12.72x FCF; 11.16x Earnings; 8-9% implied initial return w/6% CAGR FCF and 21% CAGR Earnings |
Very appealing valuation on all three aspects, with the free cash flow and earnings being more heavily weighted to the aggressive purchases required for maintenance, but also growth. Score: 1/1
Overall United Rentals Recap & Valuation
Looking at all of these metrics and making assumptions based on the future is the key to creating assumptions on future returns and growth. We know that management is projecting double digit revenue increases in the next year and we know that the Infrastructure Bill will spur continued growth in 2023 and beyond, as well as the industry trends in construction towards rentals and leases and not purchases. Let’s take a series of assumptions based on earnings over a 5 year period:
– 14.5% annual compounded earnings increases (below the present 5-year growth of 21%)
– 4% annual share count reduction (higher than the average 5 year rate, but remember share buybacks didn’t occur for 2 years+ due to the pandemic)
– 11.2 times earnings terminal multiple (exactly where we are right now – no margin compression or expansion)
What does this give investors in terms of returns over the next 5 years?
Roughly a 18% annual return for United Rentals based on the present share price. I strongly believe management will continue growth spurred by industry tailwinds, resume buying back shares with vigor, and deliver internally compounding results to shareholders generously over the next 5 years — leading to a 5 year share price of $585 by 2027.
Please see this blog post here to understand the methodology behind the 10-step analysis.
Revenue Growth: $5.808B -> $10.18B over 5 years / 11.86% CAGR with Impressive 15.65% CAGR/share |
Income Growth: $583MM -> $1.55B over 5 years, 21.6% CAGR / Over 25% CAGR Per Share – Incredible! |
Assets vs. Liabilities: $2.01B current assets v. $2.597B current liabilities / Not ideal, but also not unexpected |
Long Term Debt: Increasing, But Still More Than Manageable With Regards to Debt Ratios |
Investment Returns: 10.2%-14.5% ROIC avg. at present – Great Overall, Particularly in This Industry |
Buybacks: 84.57MM -> 71.61MM shares over 5 years, 15.3% reduction overall / Remarkable Progress |
Dividend: $0 dividend annual, 0% yield / Allowed Great Flexibility During Pandemic & Maximum Buyback |
Cash Flow: $1B -> $1.336B in 5 yr & Cash From Operations at 18% CAGR Over 5 Yrs More Than Double |
Valuation: 12.72x FCF; 11.16x Earnings; 8-9% implied initial return w/6% CAGR FCF and 21% CAGR Earnings |
Management & Moat: Strong Leadership Has Grown All Metrics Impressively & Industry Tailwinds Assist |
Based on 10-Step Analysis: 9.5 out of 10 |
Be the first to comment