

Apriori1/iStock via Getty Images
By Robert Hughes
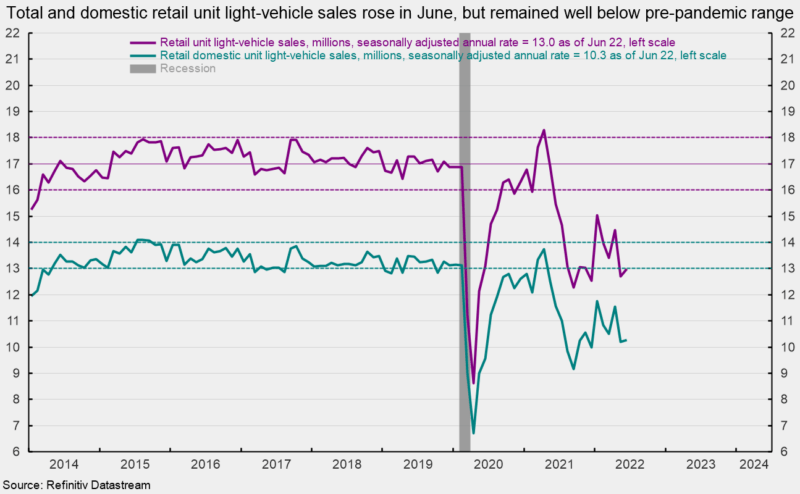
Sales of light vehicles totaled 13.0 million at an annual rate in June, up from a 12.7 million pace in May. The June result was a 2.3 percent increase from the prior month but was the thirteenth consecutive month below the 16 to 18 million range, averaging just 13.6 million over that period (see first chart). Weak auto sales are largely a result of component shortages that have limited production, resulting in plunging inventory and surging prices.
Breaking down sales by origin of assembly, sales of domestic vehicles increased to 10.3 million units versus 10.2 million in May, a rise of 0.8 percent, while imports rose to 2.72 million versus 2.51 million in May, a gain of 8.1 percent. Domestic sales had generally been in the 13 million to 14 million range in the period before the pandemic, averaging 13.3 million for the six years through December 2019. The domestic share came in at 79.1 percent in June versus 80.2 in May.
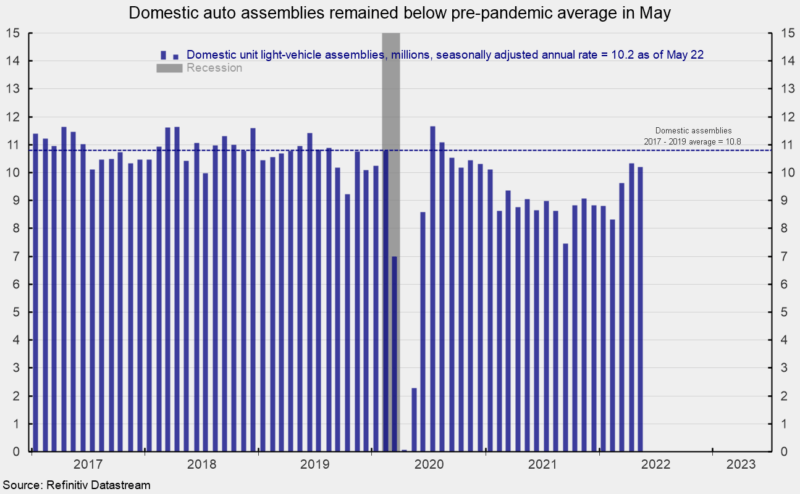
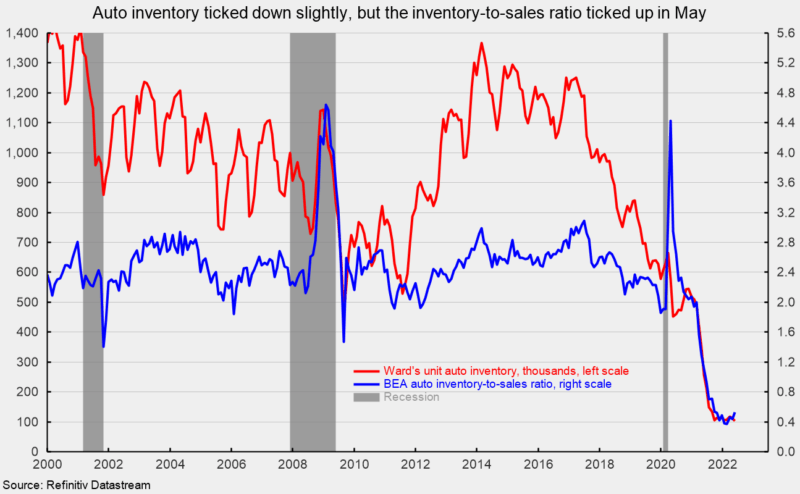
Component shortages, especially of computer chips, continue to restrain production for most manufacturers, creating a scarcity for many models, leading to lower inventory and higher prices. Ward’s estimate of unit auto inventory came in at 103,900 in May, down from 110,500 in April and still near the all-time low (see third chart). Inventory may be stabilizing as the average over the last nine months was 109,678 and has not dropped below 100,000. The Bureau of Economic Analysis estimates the inventory-to-sales ratio rose to 0.530 in May, up from 0.440 in April and the highest level since September (see third chart).
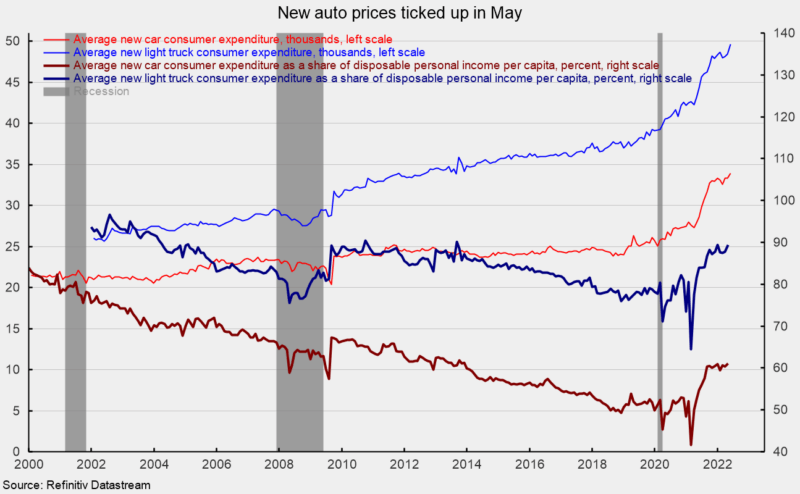
The low inventory levels have pushed prices sharply higher over the last two years, with the average consumer expenditure for a car coming in at $33,947 in May, up 1.8 percent from April to a new record high (see fourth chart). The average consumer expenditure on a light truck rose to $49,632 from $48,459 in April, up 2.4 percent for the month and a new record high (see fourth chart).
As a share of disposable personal income per capita, average consumer expenditures on a car came in at 61.2 percent versus 60.4 in April and up sharply from 51.8 percent in December 2019. The average consumer expenditure on a light truck as a share of disposable personal income per capita was 89.4 percent versus 87.7 percent in April and 78.8 percent in December 2019 (see fourth chart). Both measures are about equal to the 2014 percentages.
Editor’s Note: The summary bullets for this article were chosen by Seeking Alpha editors.
Be the first to comment