

Hispanolistic
By Robert Hughes
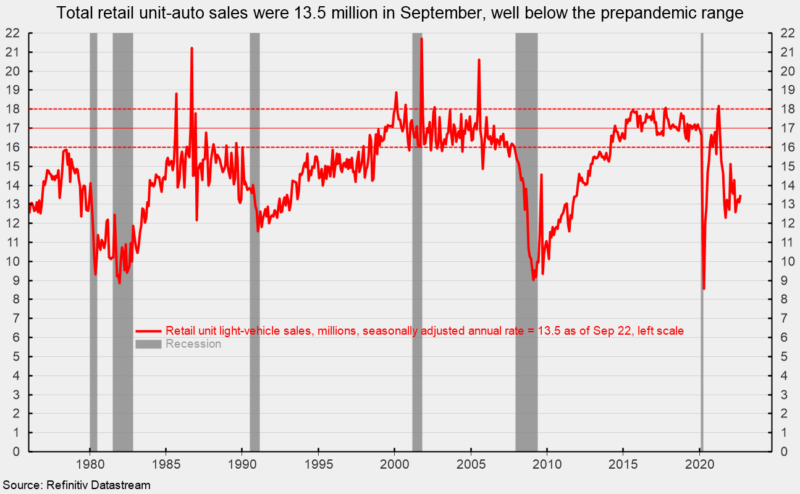
Sales of light vehicles totaled 13.5 million at an annual rate in September, up from a 13.1 million pace in August. The September result was a 2.9 percent increase from the prior month and the third decrease in the last four months. It was the sixteenth consecutive month below the 16 to 18 million range, averaging just 13.53 million over that period (see first chart). Weak auto sales are largely a result of component shortages that have limited production, resulting in plunging inventory and surging prices.
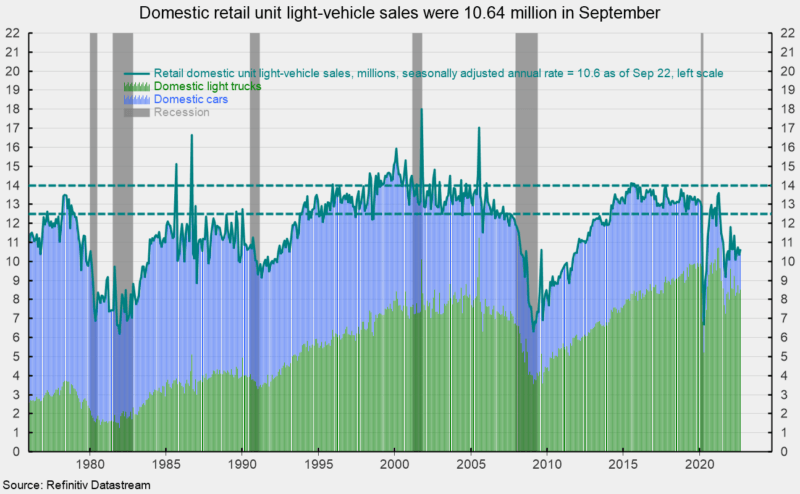
Breaking down sales by the origin of assembly, sales of domestic vehicles increased to 10.64 million units versus 10.34 million in August, a rise of 2.9 percent while imports rose to a 2.85 million rate from 2.78 in August, a rise of 2.6 percent. Domestic sales had generally been in the 13 million to 14 million range in the period before the pandemic, averaging 13.3 million for the six years through December 2019. The domestic share came in at 78.9 percent in September versus 78.8 in August.
Within the domestic light vehicles category, domestic car sales were 2.09 million in September versus 1.99 million in August, a gain of 5.0 percent. Domestic light truck sales were 8.55 million versus 8.35 million in the prior month, an increase of 2.4 percent. That puts the domestic light truck share of total domestic auto sales at 80.4 percent (see second chart).
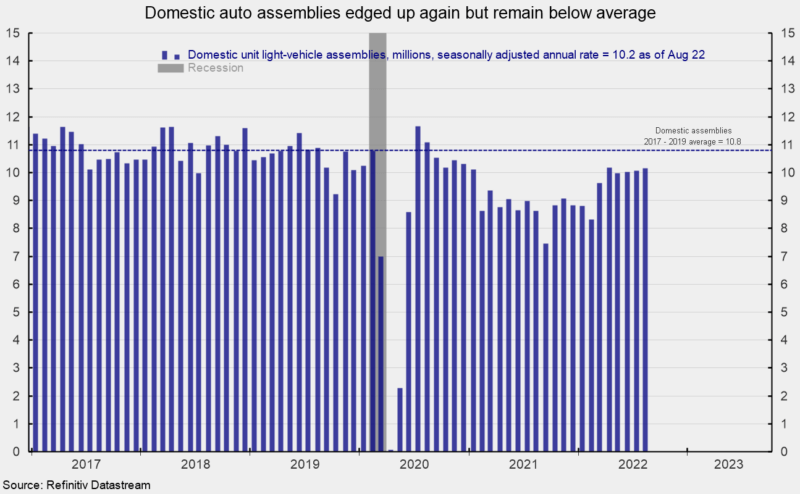
Domestic assemblies increased in August, coming in at 10.48 million at a seasonally adjusted annual rate. That is up 0.9 percent from 10.38 million in July but still below the 10.8 million average pace for the three years through December 2019 (see third chart).
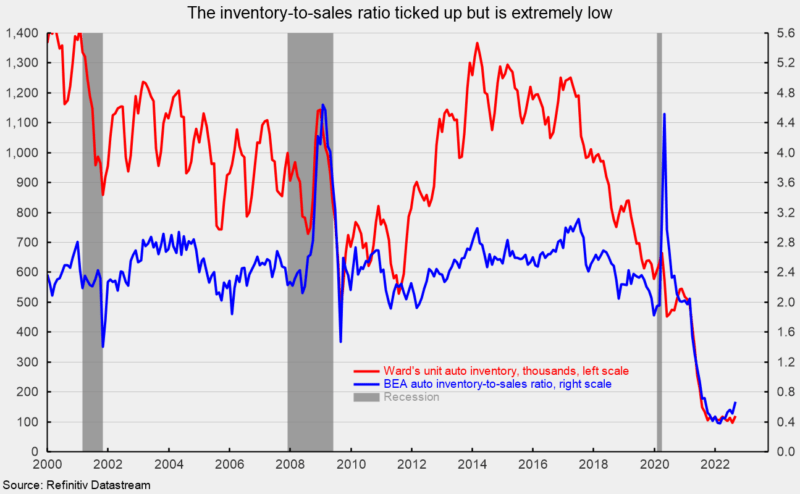
Component shortages, especially computer chips, continue to restrain production for most manufacturers, creating scarcity for many models and leading to lower inventory and higher prices. Ward’s estimate of unit auto inventory came in at 120,300 in August, up from 96,900 in July. August is at the highest level since August 2021 (see fourth chart). The Bureau of Economic Analysis estimates that the inventory-to-sales ratio rose to 0.665 in August, up from 0.511 in July and the highest level since August 2021 (see fourth chart).
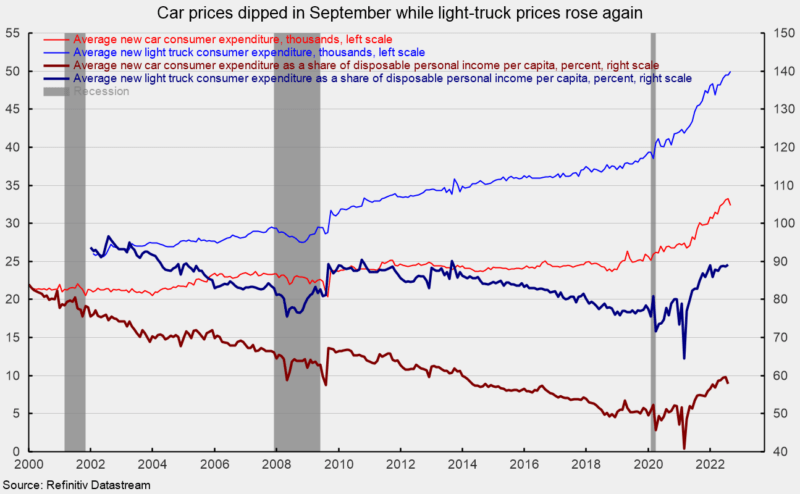
The average consumer expenditure for a car fell to $32,379 in August, down 2.8 percent from July (see fifth chart). However, the average consumer expenditure on a light truck rose to $49,985 from $49,488 in July, up 1.0 percent for the month and a new record high (see fifth chart).
As a share of disposable personal income per capita, average consumer expenditures on a car fell to 57.80 percent versus 59.63 in July while the average consumer expenditure on a light truck as a share of disposable personal income per capita was 89.23 percent versus 88.63 percent in July (see fifth chart).
Editor’s Note: The summary bullets for this article were chosen by Seeking Alpha editors.
Be the first to comment