

Poulssen
Introduction: Why Is Unilever Stock Up?
Unilever (NYSE:UL, OTCPK:UNLVF, OTCPK:UNLYF) released their H1 2022 results this morning (July 26), and shares closed up 3.0% in London.
We initiated our Buy rating on Unilever in December 2020. Since then Unilever shares in London have lost 3.8% (after dividends) in GBP, though the GBP has lost approximately 9% of its value against USD in this period.
|
Unilever Share Price (Last 5 Years) 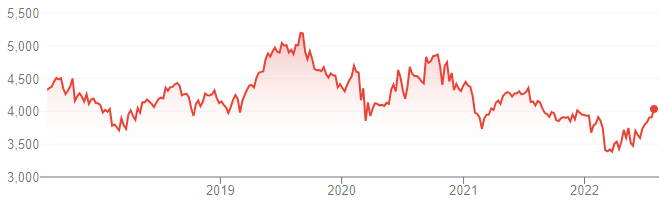 Source: Google Finance (26-Jul-22). |
H1 results showed that Unilever was able to only partially pass on cost increases through pricing, though currency tailwinds mean that EPS was up 1% in euros. Inflation should peak in H2, FY22 EPS is expected to decline by only a low-single-digit, and margin should improve in 2023 and 2024. The involvement of activist investor Trian Partners is in in its early stages, but a positive. Unilever shares currently trade at 18.0x 2021 EPS and a 3.6% Dividend Yield. Our revised forecasts show a total return of 48% (12.7% annualized) by 2025 year-end. Buy.
Unilever Buy Case Recap
Our original investment case on Unilever has been one of recovery in both earnings growth and valuation.
The Consumer Staples industry has high barriers to entry and good Return on Invested Capital, and Unilever has some of the strongest franchises globally. Growth at Unilever had slowed in 2017-19, but management has been making efforts to reaccelerate it through better innovations, marketing and sustainability credentials.
COVID-19 had been a net negative for Unilever earnings, due to its impact on out-of-home consumption and Emerging Markets, but the pandemic situation has been easing worldwide should eventually end.
We expected Unilever to return to its long-term targets of 3-5% Underlying Sales Growth and EBIT margin expansion over time. Buybacks should further enhance EPS growth. As sales growth re-accelerates, Unilever’s P/E should also recover from its multi-year low.
|
Unilever Underlying Sales Growth (ex. Currency) (Since 2011) 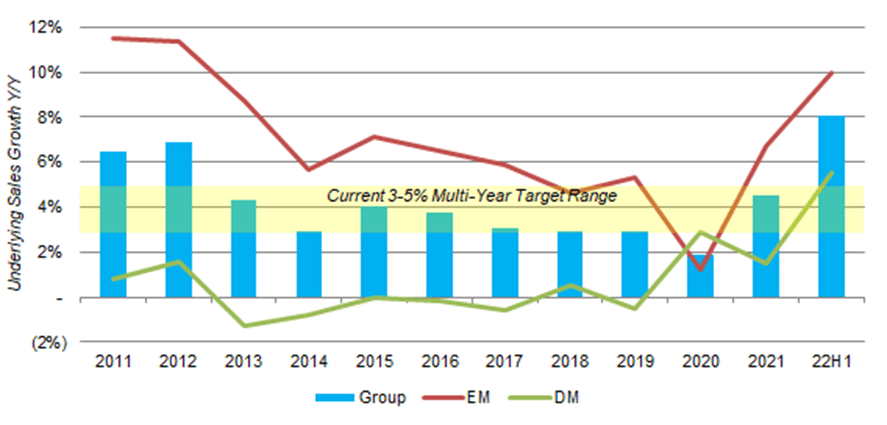 Source: Unilever results releases. |
We had not anticipated the global surge in inflation, especially following the Russian invasion of Ukraine in February, when we last published an update on Unilever in November 2021. The change in macro backdrop has delayed Unilever’s trajectory and led us to reduce our forecasts, but the fundamentals of our investment case remain in place.
Turnover Grew But Margin Fell in H1
The surge in inflation was the most important macroeconomic development in H1, and Unilever demonstrated only a partial ability to pass on cost increases in pricing, though currency served as a tailwind ((in euros)).
Unilever took price actions through H1 2022, with Underlying Price Growth (“UPG”) rising from 4.9% in Q4 2021, to 8.3% in Q1 2022 and 11.2% in Q2; Underlying Volume Growth (“UVG”) worsened correspondingly, to -2.1% by Q2:
|
Unilever Underlying Sales Growth (Since Q2 2021) 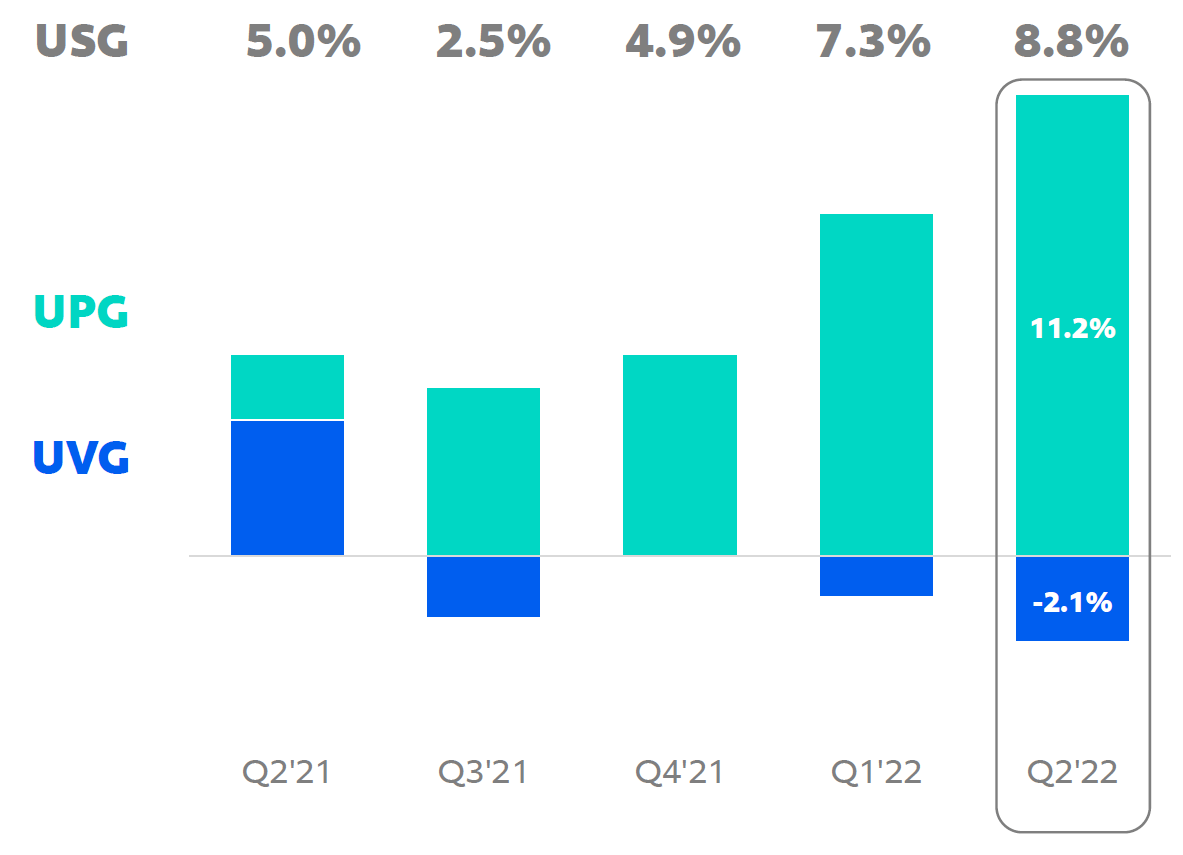 Source: Unilever results presentation (H1 2022). |
Largely as a result of price increases, Unilever had an Underlying Sales Growth (“USG”) (which is in local currencies) of 8.1% in H1; including currency, Turnover grew 14.9% year-on-year. However, costs & expenses grew even more, which means that Underlying EBIT only grew 4.1%, with EBIT margin shrinking 180 bps to 17.0%:
|
Unilever Underlying P&L (H1 2022 vs. Prior Year) 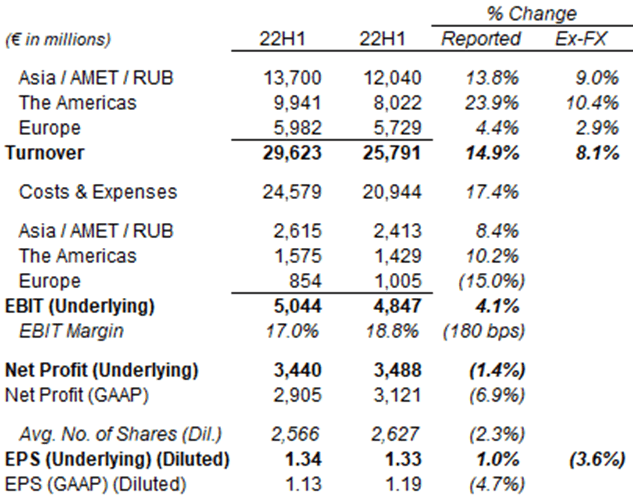 Source: Unilever results release (H1 2022). |
Underlying Net Profit fell 1.4% year-on-year, worse than EBIT due to higher financing costs and tax. Underlying EPS grew 1.0% in EUR, after buybacks reduced the share count by 2.3% year-on-year. Excluding currency, however, Underlying EPS fell 3.6% year-on-year in H1.
Unilever could only pass on part of the cost increases. Management stated on the H2 call that they “only passed through so far just around 70% of cost increases.” Gross Margin fell 2.1% year-on-year in H1 as a result:
|
Unilever Underlying EBIT Margin Bridge (H1 2022 vs. Prior Year) 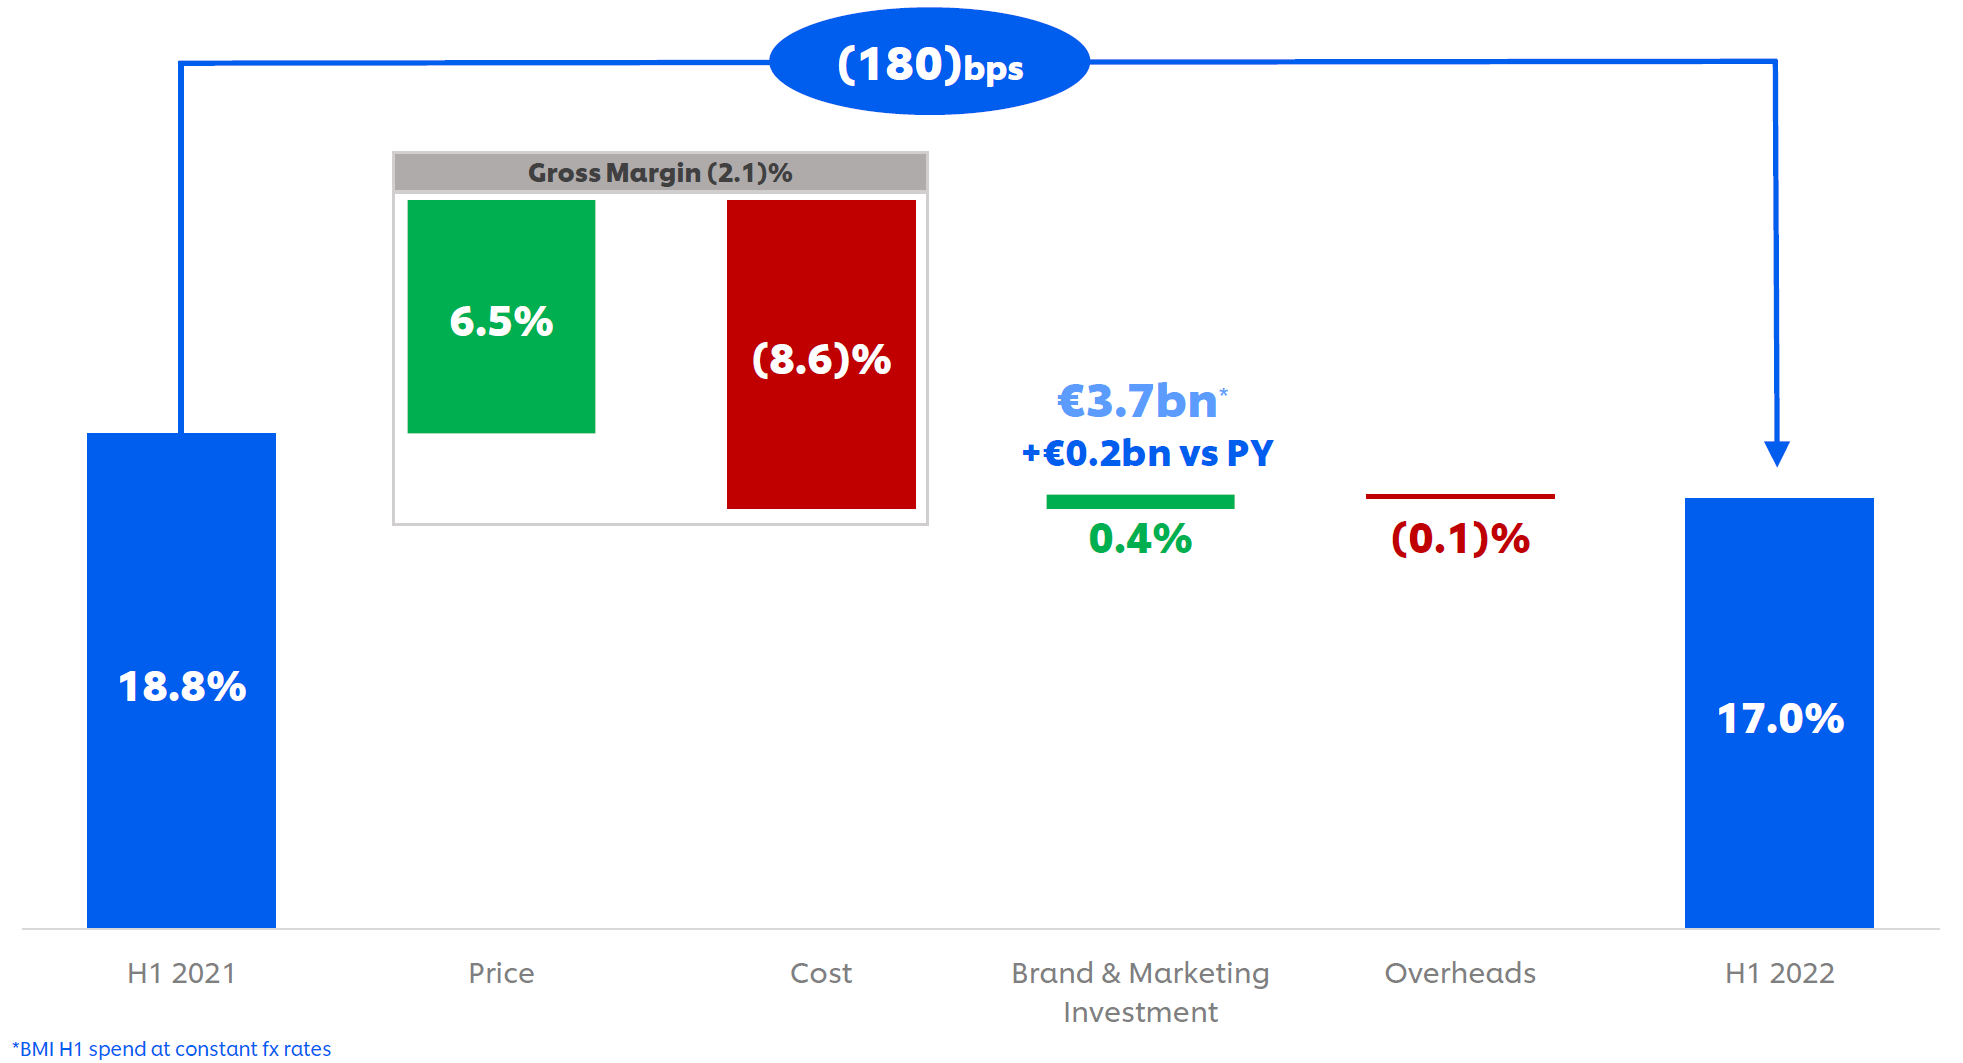 Source: Unilever results presentation (H1 2022). |
Brand & Marketing Investment was kept relatively stable in H1, up €0.2bn to €3.7bn, though margin fell due to the larger turnover.
Unilever believes it has mostly maintained its competitiveness, despite price increases. Management estimated that 53% of its businesses (by revenues) had gained share on a Moving Annual Total basis in Q2, down from 58% in Q1 but still more than half.
We continue to believe that a sustained return to the upper half of the historic 3-5% USG target range is achievable, especially if inflation remains higher than pre-COVID levels.
UL’s Outlook Implies Small EPS Decline in 2022
Unilever released a slightly revised full-year 2022 outlook, which includes:
- USG to be “above” the 4.5-6.5% range (was “towards the top end”)
- Underlying EBIT margin to be 16%, at the bottom of 16-17% range guided (unchanged)
- EPS to have a currency translation tailwind of “around 4%” (was “a little bit less than 4%”).
These imply an Underlying EBIT decline of up to 7.4% in local currencies, and an EPS decline in low-single-digits in euros.
The margin guidance for FY22 is likely reliable. Management stated that they have “locked in about 80% of our costs for the second half.” Some commodity prices have been softening recently, and Unilever, in fact, reduced its expectation of 2022 net material inflation cost from €4.8bn in April to €4.6bn now (with €2.0bn already in H1).
EBIT Margin To Improve After 2022
Beyond 2022, Unilever expects its margin to improve, “through pricing, mix, volume leverage, and savings delivery, and as market conditions normalize.”
However, Unilever “will not be setting a margin target” to allow the potential for additional investment. As CEO Alan Jope explained on the call:
“We are deliberately avoiding a margin target. We’re stepping away from any margin target as a signal that our priority is compounded steady topline, high-quality growth … we are studiously avoiding a margin target to preserve the ability to invest more in our brands should we need to.”
We believe Unilever had under-invested in the past, so an increase in investments (on the P&L) may be necessary and could create value over time. We, therefore, expect the EBIT margin to rise after 2022, but only modestly.
A modestly-expanding margin, together with a return to the upper half of the 3-5% USG target range described above, should result in Net Income growth of 5%, and an EPS growth of 6%, including buybacks.
Activist Involvement in Early Stages
Activist investor Trian Partners has built a 1.5% stake in Unilever this year, and Trian founder and CEO Nelson Peltz was appointed to the Board in May (effective July). Past Trian campaigns in Consumer Staples companies include successes at Procter & Gamble (PG), Heinz (now part of Kraft Heinz (KHC)), and Mondelez (MDLZ).
In late January, shortly after press reports of Trian’s stake-building, Unilever announced another reorganization. It, among other things, rearranged the company’s three business units to five and removed 1,500 management roles. The new reorganization was in place by July 1, and management credited it for helping speed up recent pricing decisions. We believe the new structure would also make it easier to dispose of entire business units if needed.
We see Trian’s involvement as a significant positive.
Valuation & Shareholder Returns
With shares at 4,032p, relative to 2021 financials, Unilever stock is at an 18.0x P/E and a 5.1% Free Cash Flow Yield:
|
Unilever Earnings, Cashflows & Valuation (2018-21) 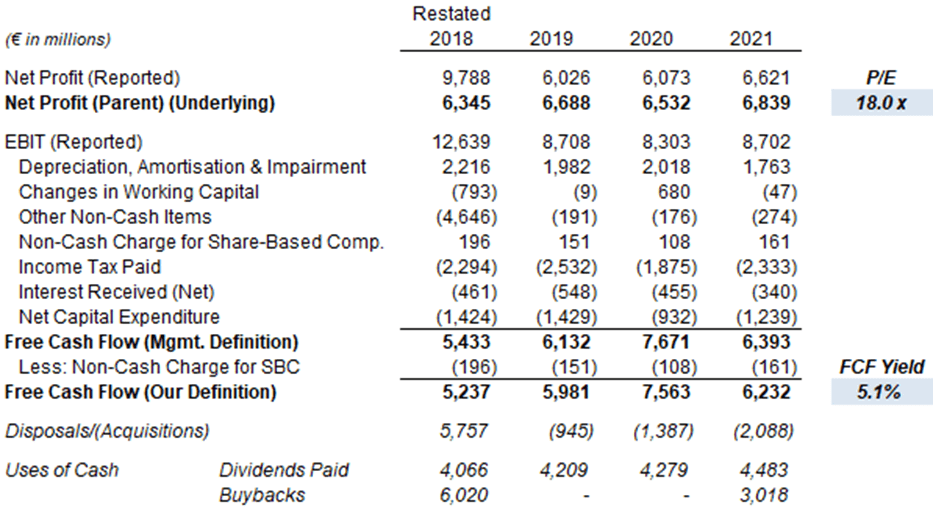 Source: Unilever results releases. |
If we conservatively assume a 5% decline in EPS in 2022, then Unilever stock is trading at 18.9x 2022 EPS.
Unilever pays a quarterly dividend of €0.4268 (143.67p annualized at spot rates), which represents a dividend yield of 3.6%. The dividend is well-supported, with a Payout Ratio of just over 65%.
Net Debt / EBITDA was 2.3x at the end of Q2, which management described as “in line with our broad leverage target” (the “ambition” is “around 2.0x”). Net debt of €27.1bn was before approximately €4.5bn of proceeds from the sale of the Ekaterra tea business arrived after the quarter. Unilever’s pension scheme has a €5bn surplus.
Unilever has a €3bn buyback target for 2022-23, with the first €750m tranche now completed and the second €750m tranche expected to be launched “early in the third quarter.” The latter is equivalent to 0.6% of the current market capitalization.
Unilever Stock Forecasts
Our previous forecasts underestimated 2021 EPS by about 8% (€2.43 vs. €2.62).
We extend our forecasts to 2025 and update our assumptions. We now assume:
- 2022 Net Income to decline by 4%
- 2022 share count to be down 2%
- 2023-25 Net Income growth to be 5.0%
- From 2023, share count to fall by 1% each year
- From 2023, Payout Ratio to be 65.0%
- 2024 year-end P/E of 21x.
Our new 2024 EPS forecast of €2.89 is 1.4% lower than our previous Base Case and 6.5% lower than our previous Upside Case (€3.09):
|
Illustrative Unilever Return Forecasts 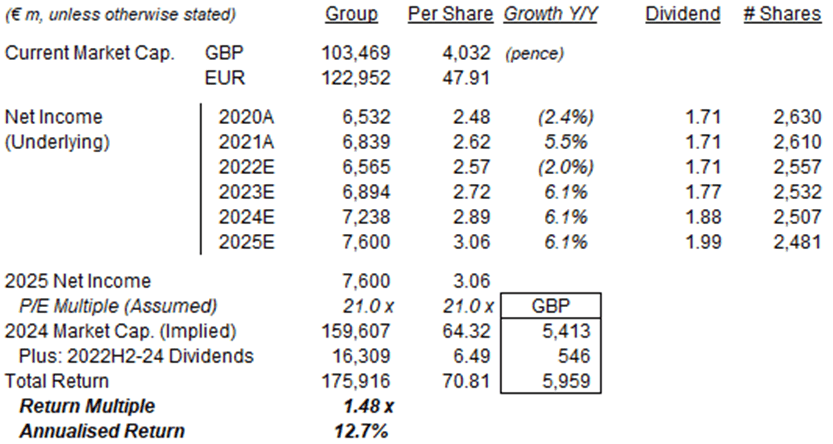 Source: Librarian Capital estimates. |
With shares at 4,032p, we expect an exit price of 5,413p and a total return of 48% (12.7% annualized) by 2025 year-end.
Is Unilever Stock A Buy? Conclusion
We reiterate our Buy rating on Unilever stock.
Be the first to comment