

everythingpossible
Investment Summary
Since our buy call on UFP Technologies, Inc. (NASDAQ:UFPT) it’s been satisfying to observe the total return on the long position lift to 31.29% at the time of writing. You can read the last publication by clicking here. UFPT has wormed its way higher since bouncing in February FY22′ and now rests at an $875mm market cap. We’ve now got shares trading at a PEG ratio of 0.21 and shares are trading below 5-year averages at 24.1x trailing P/E. As a reminder, we had built our buy thesis on UFPT based on the below factors:
- 5-year normalized return on invested capital (“ROIC”) of 9.2%.
- Sale of Molded Fibre Technology Inc. business adding ~$1.60 share in equity value.
- Management spent a great effort in consolidating the company’s portfolio and end-markets, shifting into the higher-margin med-tech offering.
- Supportive valuations, which advocated for valuation upside and downside protection looking ahead.
Since then, the stock has rallied >30% as mentioned, and I’m back today to reiterate our buy call on UFPT. Net-net, we continue to rate UFPT a buy on long-term value, shifting our next price objective to $128.
Exhibit 1. UFPT bifurcation away from S&P 500 across FY22′, continuing into new year. Further re-rating would widen the divergence.
Data: Updata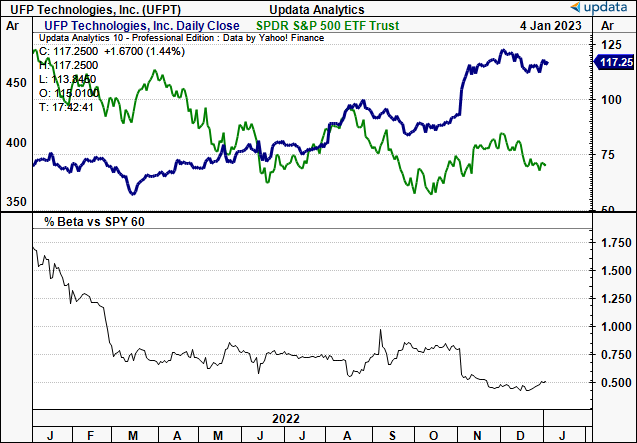
Q3 earnings rundown leading into full-year earnings
There were several data points worth mentioning for UFPT’s latest numbers, reported in mid-November. It was an impressive set of growth percentages UFPT achieved for the 3 months. Here, I’ll take a hard data approach to illustrate the company’s movements from Q3 FY21′-F3 FY22′ to exemplify the investment opportunity. Specifically, the following:
- First talking point is the substantial YoY increase in revenue of ~91.2% to reach $97.0mm. This compares $50.7mm reported in the same period last year. This significant upside is underlined by the 152% increase in its medical end-market. The majority of this upside being driven by acquisition accretions, totalling $40.3mm, and an organic sales increase of 27.6% YoY. In contrast, sales to customers in other markets decreased by 16.2%.
- Gross margin also decompressed by ~300bps YoY, reaching 26.3%. The increase in gross margin was attributed to leverage obtained from organic sales growth over fixed expenditures.
- Meanwhile, we also noted CFFO for the nine months to Q3 FY22 was ~$144,000. This included an increase in accounts payable of $6.3mm, and an increase in accrued expenses of $13.0mm. Both of these factors were largely influenced by the building of inventory for demand and order timing, per management.
- Perhaps the biggest takeout was that EPS lifted 416% YoY to $2.58 and to us this certainly justifies the re-rating UFPT’s exhibited on the charts these past 12 months. The quarterly EPS ramp from 2021-2022 is seen in the chart below.
Exhibit 2. UFPT EPS ramp demonstrating earnings leverage obtained from c.92% YoY gain in net sales.
Data: Seeking Alpha, UFPT, see: “Earnings”
In addition, when performing further analytics on the company’s performance, we noted its ROIC has maintained its upward trajectory above the cost of capital.
For those observing Exhibit 3, you’ll see that UFPT has also maintained a relatively flat cost of capital [represented via WACC] over the 2-year period to date as well. This, as the trailing ROIC has lifted to ~12% at the end of Q3, delivering ~5 percentage points in economic value added.
Should the company continue along this growth route in its next set of earnings [Q4 FY22′ and FY22′ full-year results, respectively], combined with further EPS upside, this sets the platform for an additional re-rating to the upside in our opinion. This demonstrates that UFPT can fund its own growth initiatives looking ahead, not relying on external financing.
It is important to note our calculations exclude goodwill reported on the balance sheet. We’d advise that UFPT has ~$112.7mm in goodwill reported last period. The debate of goodwill in the ROIC is an interesting one, as, on the one hand, the company should be ‘penalized’ for all of its capital budgeting considerations. However, goodwill is a non-cash, non-amortizing ‘asset’ that is provisioned each period. Hence, it isn’t required as an investment to run operations. We exclude it in this calculation for this reason.
Exhibit 3. UFPT continues to demonstrate it can fund its own growth initiatives down the line, with c.12% ROIC, above capital costs.
Note: In the calculation of NOPAT, intangibles do not include goodwill. Goodwill is not used to run the business, and therefore isn’t used on this premise. Adding the goodwill figure in does produce different results that aren’t discussed here. (Data: Author, UFPT SEC Filings)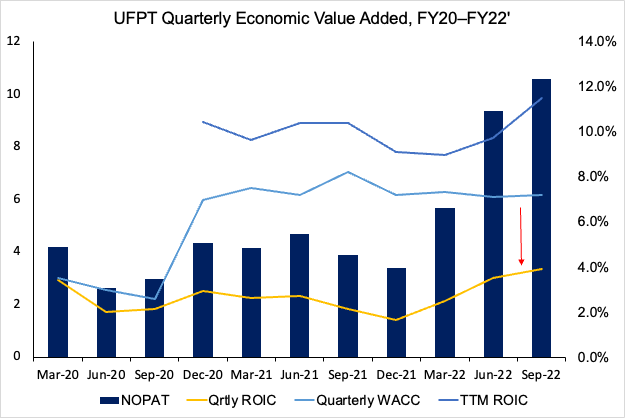
UFPT positioning: what to consider looking ahead
We firmly believe there is scope for UFPT to continue its ascending channel into FY23′. First, consensus has the company to print $348mm in revenue for FY22, lifting to $358mm this year [Exhibit 4]. At the same time, GAAP consensus EPS of $5.28 represents ~152% YoY growth at the bottom line, which certainly piques investor interest.
We’d need to see upsides versus consensus at each earning point along the way in FY23 in order for the market to continue pricing in the growth. Thankfully, the company has an extensive history of achieving this on a quarterly basis since FY17.
Exhibit 4. UFPT consensus revenue estimates for FY22 and FY23 point to further upside.
Data: Seeking Alpha, UFPT, see: “Revenue”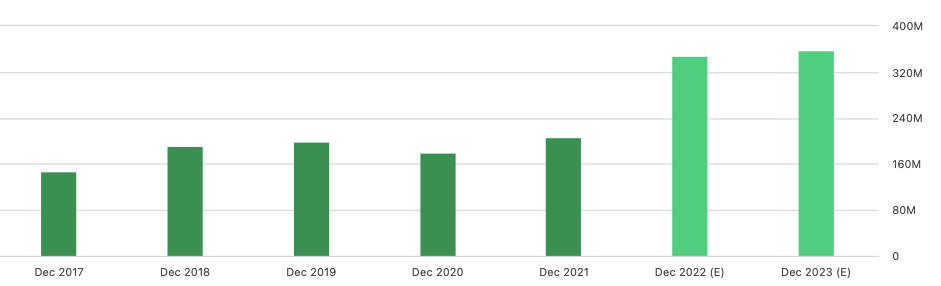
Technical studies are quite supportive as well. You’ll see in exhibit 5 that shares have just tested the upper bar of the ascending channel formed in 2022. The fact it’s broken above that range and pulled back gives us the impression it could continue to pull back to range further. This would open up the scope for entry even more in our opinion, should this occur.
The top of the move has opened up and the last 6 weeks has resulted in tight closes, whilst weekly volume still remains encouraging. This, after it spiked heavily at the last rally.
Exhibit 5. UFPT Weekly price evolution, with shares trading sideways with volume support still in situ.
Data: Updata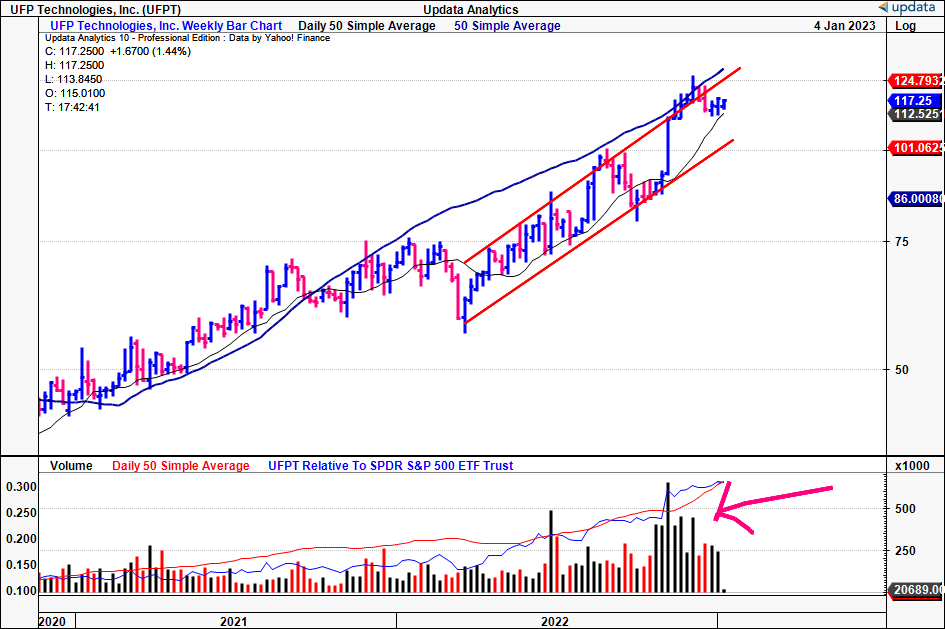
Further evidence of the same is seen in the long-term trend indicators, showing that on-balance volume has lifted to 6-month highs. Important to remember that large funds will accumulate a position over many days based on the dollar amount of daily liquidity/trading volume. Hence, this is suggestive of bullish momentum, backed by the position of the price line and lag line with respect to the cloud [Ichimoku chart] seen below. To us, price distribution is still bullish based on these studies.
Exhibit 6. Trading well above the cloud with lag line following in close pursuit. Cloud widening with on-balance volume within longer-term uptrend, all suggests bullish outlook in mid-term.
Data: Updata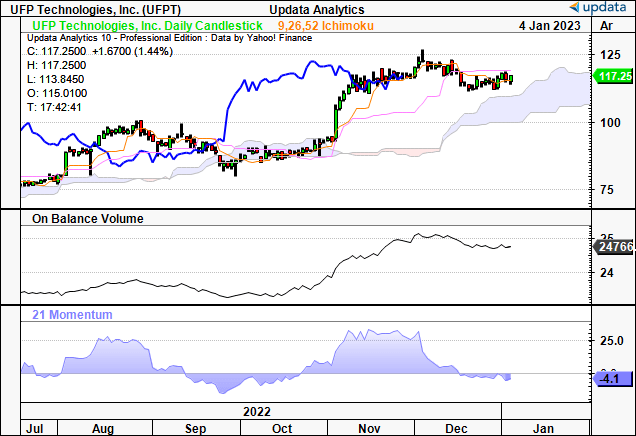
Valuation and conclusion
With all this in mind, it’s also worth noting that UFPT is trading at 16.6x forward EBITDA and that consensus has the stock priced at 21.9x forward P/E [GAAP estimates].
However, based on the same GAAP EPS estimates for FY22, we believe the stock should be trading higher at 24.25x forward earnings. This is above the S&P 500’s forward P/E of 18.8x, and thus we expect an outperformance for UFPT over the coming 12 months, despite the premium. The mathematics of these multiples and EPS estimates derives a price objective of $128. This also confirms our buy thesis.
Exhibit 7. Fair forward P/E 24.25x FY22 EPS estimate $5.28 = $128
Data: Author’s estimates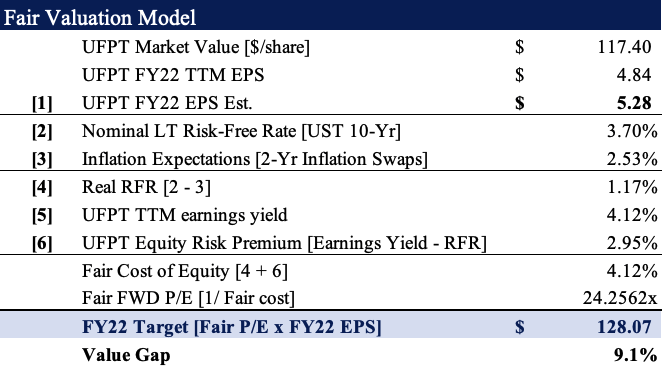
Finally, we’d note that UFPT is highly rated in Seeking Alpha’s quantitative factor grading. Despite the low valuation rating, we believe this is more than covered by the highest scored possible across growth, momentum and revisions.
Exhibit 8. UFPT Seeking Alpha factor grades, demonstrating good outlook downstream
Data: Seeking Alpha, UFPT quote page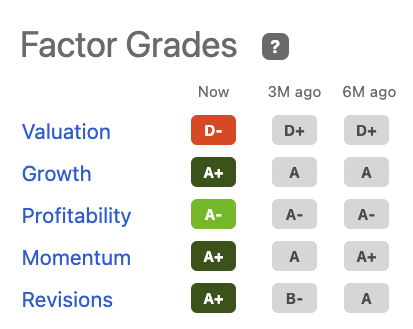
Net-net, we continue to rate UFPT a buy. Breaking down the economics of its business model and the return it sees from its capital allocation and the growth seen at the top-bottom lines last year. Its Q4 and FY22 earnings will be key inflection points to justify a further re-rating, and hence could also post as a key risk factor in the investment debate. Nevertheless, should it continue at this trajectory, we are very constructive on the long-term prospects of UFPT. Rate buy, $128 is our next price objective.
Be the first to comment