

Eoneren
This dividend ETF article series aims at evaluating products regarding the relative past performance of their strategies and quality metrics of their current portfolios. As holdings and weights change over time, I post updated reviews when necessary.
RDVY strategy and portfolio
The First Trust Rising Dividend Achievers ETF (NASDAQ:RDVY) has been tracking the NASDAQ US Rising Dividend Achievers Index since 01/06/2014. As of writing, RDVY has a portfolio of 50 stocks, a 12-month distribution rate of 1.63% and an expense ratio of 0.50%. Distributions are paid quarterly.
As described in the prospectus, in order to be eligible, a company must:
- have paid a dividend in the trailing 12-month period greater than the dividend paid in the trailing 12-month period three and five years prior,
- be a member of the NASDAQ US Benchmark Index,
- not be classified as a REIT,
- be in the top 1,000 market capitalizations of the NASDAQ,
- have an average daily trading volume of at least $5 million,
- have EPS in the last fiscal year greater than in the 3 prior fiscal years,
- have a cash-to-debt ratio above 50%,
- have a trailing 12-month payout ratio below 65%.
Companies passing these criteria are ranked by dividend increase over 5 years (higher is better), by dividend yield (higher is better) and by payout ratio (lower is better). These 3 ranks are aggregated into a single rank. The 50 best-ranked companies are equally weighted. If exposure to an industry is over 30%, the lowest ranked company in that industry is replaced with the next highest ranked company from another industry. The portfolio is reconstituted annually and rebalanced quarterly.
Constituents are exclusively U.S. companies, 62% large caps, 34% mid-caps and 4% small caps. The next chart compares sector breakdowns of RDVY now, RDVY in December 2021 (my last review of this fund), and the S&P 500 (SPY) now. Financials is the heaviest sector (30.8%), almost unchanged in weight. It is slightly above the limit defined in the underlying index. Technology comes second (19%), after losing half of its weight in 13 months. Industrials have almost tripled and come third (16%). Other sectors weigh no more than 10% individually and 34% in aggregate. Compared to the S&P 500, RDVY massively overweights financials and industrials.
Sector weights (chart: author; data: First Trust)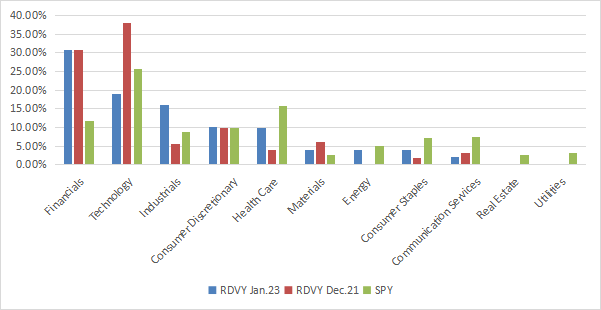
The portfolio follows an equal-weight methodology, but weights may drift between rebalancing dates. The current top 10 holdings, listed in the next table with some fundamental ratios, have an aggregate weight of 20.9%.
|
Ticker |
Name |
Weight |
EPS growth %ttm |
P/E ttm |
P/E fwd |
Yield |
|
Omnicom Group Inc. |
2.13% |
-3.02 |
13.25 |
12.29 |
3.39 |
|
|
Bank of America Corp. |
2.11% |
-5.69 |
10.63 |
10.63 |
2.63 |
|
|
KeyCorp |
2.11% |
-14.22 |
8.03 |
8.34 |
4.66 |
|
|
U.S. Bancorp |
2.11% |
-15.80 |
10.65 |
10.39 |
4.30 |
|
|
The Allstate Corp. |
2.08% |
-101.10 |
N/A |
63.45 |
2.49 |
|
|
Interpublic Group of Cos., Inc. |
2.08% |
41.55 |
13.45 |
12.34 |
3.43 |
|
|
JPMorgan Chase & Co. |
2.08% |
-25.07 |
11.41 |
11.67 |
2.96 |
|
|
Regions Financial Corp. |
2.08% |
-24.68 |
10.69 |
9.26 |
3.73 |
|
|
Aflac Inc. |
2.07% |
27.03 |
9.14 |
13.70 |
2.35 |
|
|
Cognizant Technology Solutions Corp. |
2.07% |
26.64 |
12.82 |
12.93 |
1.88 |
Ratios from Portfolio123
Past performance
Since inception, RDVY has slightly outperformed SPY and some competitors in total return (see next table). However, it is significantly riskier regarding volatility and drawdowns, and gets a lower Sharpe ratio (a measure of risk-adjusted performance). DGRW beats RDVY in return and shows a lower risk.
|
Total Return |
Annual.Return |
Drawdown |
Sharpe ratio |
Volatility |
|
|
RDVY |
154.61% |
10.97% |
-39.56% |
0.64 |
18.45% |
|
VIG |
143.44% |
10.42% |
-29.58% |
0.8 |
13.25% |
|
NOBL |
145.86% |
10.54% |
-32.87% |
0.78 |
13.97% |
|
DGRW |
164.65% |
11.45% |
-30.13% |
0.82 |
14.13% |
|
SPY |
144.65% |
10.48% |
-32.05% |
0.72 |
14.89% |
In 2022, RDVY has been more resilient than SPY (-14% vs -18.8%), but it lags competitors: VIG (-9.7%), DGRO (-7.8%), DGRW (-6.4%), KNG (-6.9%), NOBL (-6.3%). My 14-stock dividend quality portfolio beats them all with -3.7% (more info below).
In previous articles, I have shown how three factors may help cut the risk in a dividend portfolio: Return on Assets, Piotroski F-score, and Altman Z-score.
The next table compares RDVY with a subset of the S&P 500: stocks with an above-average dividend yield, an above-average ROA, a good Altman Z-score, a good Piotroski F-score, and a sustainable payout ratio. The subset is rebalanced annually to make it comparable with a passive index.
|
Total Return |
Annual.Return |
Drawdown |
Sharpe ratio |
Volatility |
|
|
RDVY |
154.61% |
10.97% |
-39.56% |
0.64 |
18.45% |
|
Large cap reference subset |
181.24% |
12.21% |
-34.92% |
0.79 |
15.56% |
Past performance is not a guarantee of future returns. Data Source: Portfolio123
RDVY lags the dividend quality subset by 1.2 percentage point in annualized return. A note of caution: ETF performance is real and this subset is hypothetical. My dividend quality portfolio holds 14 stocks selected in this subset.
The sum of annual distributions per share was $0.42 in 2014 and $0.97 in 2022. This is an annualized dividend growth rate of 11%, which is excellent.
Scanning RDVY portfolio
The usual valuation metrics, reported in the next table, are cheaper than for the S&P 500. However, fundamentals are biased by the weight of financials, where valuation ratios are lower and unreliable. As an example, XLF has a price-to-book ratio of 1.68 vs. 3.82 for the S&P 500. Therefore, the numbers below must be considered with caution.
|
RDVY |
SPY |
|
|
Price/Earnings TTM |
11.6 |
20.15 |
|
Price/Book |
2.46 |
3.82 |
|
Price/Sales |
1.61 |
2.4 |
|
Price/Cash Flow |
11.45 |
15.04 |
Source: Fidelity
According to my calculations, the aggregate ROA is better than for the S&P 500 (SPY): 10.9% vs. 7.8%. The aggregate Altman Z-score and Piotroski F-score are similar.
|
RDVY |
SPY |
|
|
Atman Z-score |
3.5 |
3.5 |
|
Piotroski F-score |
5.6 |
5.7 |
|
ROA % TTM |
10.9 |
7.8 |
The ROA points to a portfolio quality superior to the benchmark.
In my ETF reviews, risky stocks are companies with at least 2 red flags among: bad Piotroski score, negative ROA, unsustainable payout ratio, bad or dubious Altman Z-score, excluding financials and real estate where these metrics are less relevant. With these assumptions, RDVY doesn’t have any risky stock in its portfolio. This is a good point, but once again, financials are not taken into account.
Takeaway
RDVY has a portfolio of 50 stocks, selected on dividend growth and quality factors once a year, and rebalanced in equal weight every quarter. Thanks to the equal-weight methodology, risks related to individual stocks are low. However, the fund is quite concentrated in financials. For this reason, the cheap valuation ratios are unreliable. Portfolio quality looks superior to the benchmark. RDVY is a bit ahead of the S&P 500 in annualized return since inception, but it is riskier regarding drawdowns and volatility. The low yield can’t satisfy income-seeking investors, but the annualized dividend growth rate is excellent. For transparency, a dividend-oriented part of my equity investments is split between a passive ETF allocation (DGRW is part of it, not RDVY) and my actively managed Stability portfolio (14 stocks), disclosed and updated in Quantitative Risk & Value.
Be the first to comment