

AlexImages/iStock via Getty Images
Last week, we covered U.S. Steel (NYSE:X) on the factor investing hub and discovered a few interesting talking points. Today’s article spans a few of U.S. Steel’s pros and cons in relation to the current market climate.
U.S. Steel seems like one of those stocks that could experience sharp action in the coming months as the market tries to find direction. In addition, the basic materials and manufacturing industries tend to be ultra-sensitive to macroeconomic variables, making this an exciting stock to analyze.
So, without further ado, here’s what I discovered about U.S. Steel.
Analysis of U.S. Steel’s Operations
Bull Case
United States Steel’s primary strength lies within its market positioning. The company owns approximately 9.71% of the global steel manufacturing market. I believe its market share is conveyed through its robust EBIT margin (24.83%), indicating that the company has achieved economies of scale.
CSI Market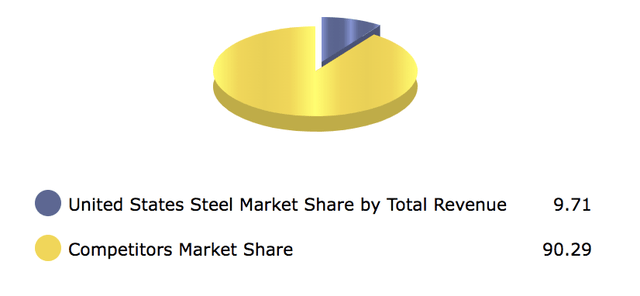
Another factor that could play a role is U.S Steel’s assumed exposure to future military defense spending and the industrial production that goes with it. We believe many governments might gear up on defense spending in the coming years as global tensions are exacerbated. For example, there’s a war in Ukraine, rising populist politics from the left and right wing parties, growing civil unrest in emerging markets, rising tension in the South China Sea, and global labor protests.
The likes of Germany and Japan have already started bolstering defense spending. I won’t be surprised if other nations begin doing the same, and U.S. Steel could be one of the primary steel suppliers in such a scenario.
Lastly, U.S. Steel has a degree of operating leverage ratio worth 5.52x, implying that it possesses a resilient income statement. As such, fading sales (due to a possible recession) won’t necessarily translate into an unprofitable company.
Bear Case
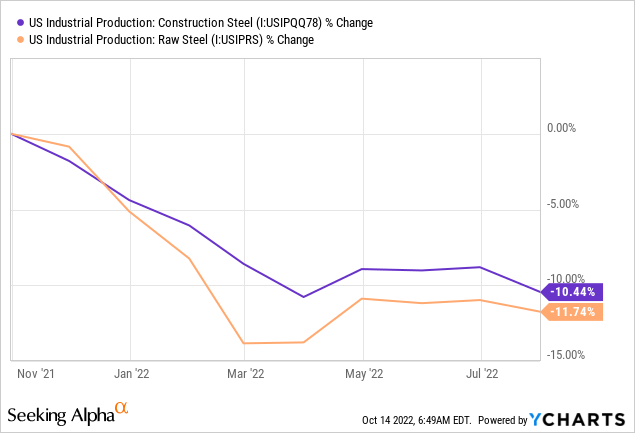
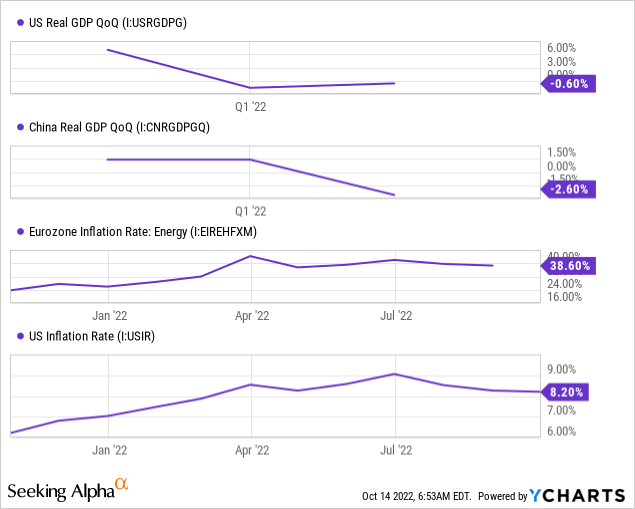
The standout headwind for United States Steel relates to the current unfavorable macroeconomic environment. Steel demand is waning as industrial production slows. In our opinion, the draw on the U.S. GDP, resilient non-core inflation in the Eurozone, slowing Chinese economic growth, and civil unrest in emerging markets could all coalesce to form a downward spiral in steel sales.
Furthermore, U.S. Steel’s struggling with a few operational aspects. For instance, I believe the company’s yet to formally agree to a new wage deal for its workers after its Union agreement expired on September 1st. It’s clear that many companies have struggled with wage disputes this year because of the convergence of revenue growth and global inflation.
Will U.S. Steel’s operations be foiled due to a wage strike? I won’t be surprised.
Another apparent issue is U.S. Steel’s maintenance. Two of the company’s furnaces recently broke down in less than a month. Does the company need to add to its maintenance-related CapEx spending? The signs are that there’s a possibility.
Seeking Alpha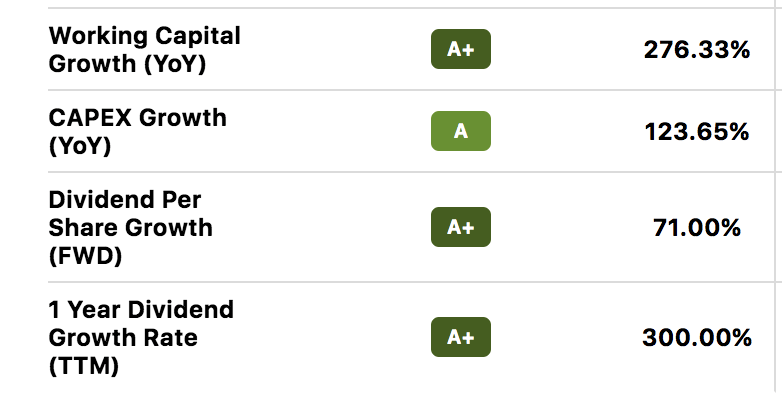
Valuation & Dividends
Discounted Free Cash Flow
I did my own valuation on the stock, and I couldn’t believe my eyes. The figure I arrived at was so low that I had to cross-check its viability. Thus, I looked at U.S. Steel’s second-quarter investor presentation, and apparently, my valuation range rings true.
According to U.S. Steel’s investor presentation, the company’s free cash flow stands at a mere $642 million, translating into a fair value of $2.07 per share.
United States Steel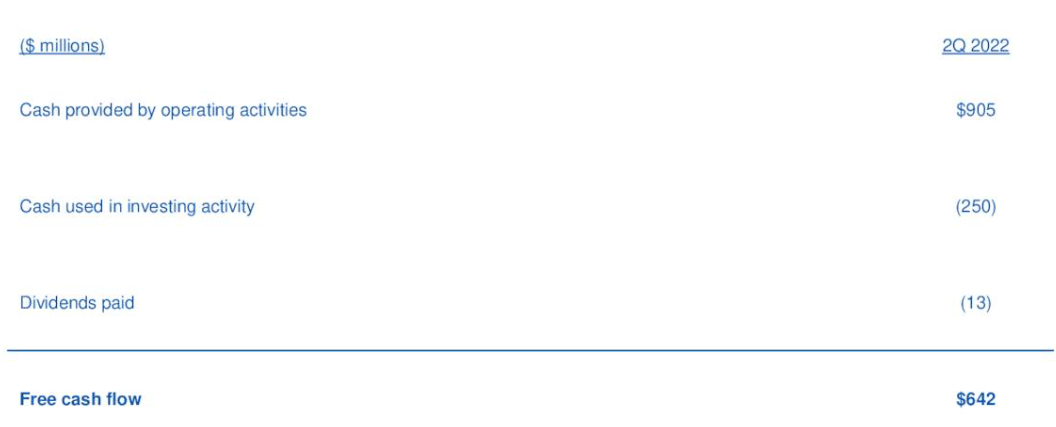
The chart below reveals my calculations. I opted to calculate the discounted Free Cash Flow to Firm as it represents capital available before distributions. I used the firm’s second-quarter data and forecasted every line item until 2023’s third quarter. My bottom-line result reveals a fair value per share of $4.44, which is significantly lower than U.S. Steel’s current stock price (in and around the $19 handle).
Pearl Gray Equity and Research; Data from GuruFocus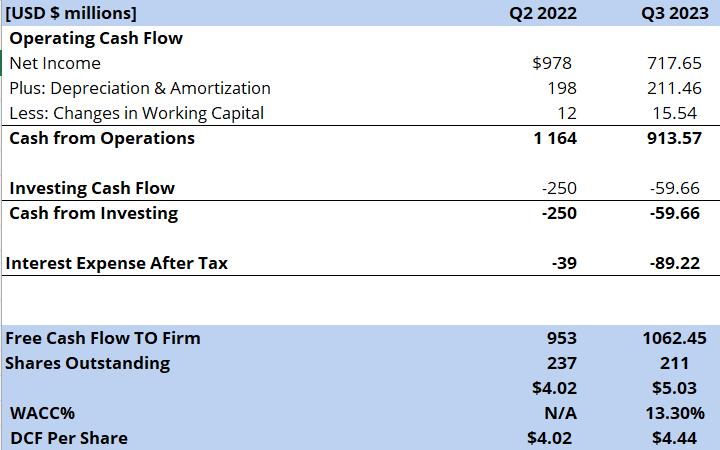
| FCFF Formula = Net Income + Non-Cash Costs + Interest (1-tax) – Cash from Investing – Change in Working Capital |
| Discounted Cash Flow Formula = FCFF/(1 + Weighted Average Cost of Capital) |
Source: Kaplan Schweser
Here’s how I went about forecasting U.S. Steel’s cash flow statement.
- I derived the company’s second-quarter cash flows from a 3rd party data provider.
- I used a SARIMA model and NumXL to forecast each required line item. SARIMA is a seasonal time-series regression that leverages past observations to formulate a forward-looking moving average.
- After forecasting each line item, I applied a standard FCFF (free cash flow to firm) formula.
- I then derived U.S. Steel’s current shares outstanding amount from Seeking Alpha and rounded it off. In addition, I applied U.S. Steel’s remaining $450 million in committed stock buybacks at $19 per share and arrived at a forecasted shares outstanding amount of 211 million.
- Lastly, I discounted my estimate back to today by utilizing the company’s moving average cost of capital.
Relative Valuation
Relative valuation metrics imply that the stock’s significantly undervalued. For example, U.S. Steel’s price-to-sales and price-to-book ratios are trading far below their 5-year averages, and the stock’s price-to-earnings (P/E) ratio of 1.16x is meager, in my opinion.
| price-to-earnings | 1.16x |
| price-to-sales | 0.23x |
| price-to-book | 0.47x |
| Forecasted EPS (Dec 2023) | 2.6x |
| Price Target | $3.02 (rounded) |
Source: Seeking Alpha
However, despite the stock’s subdued price multiples, absolute valuation concerns persist.
To enhance my analysis, I utilized a PE expansion method to set a price target. The target was determined by multiplying the current PE by analysts’ December 2023 earnings-per-share estimate; I discovered a fair value of $3.02, which is nearly in line with our DCF model’s final result.
Dividends
I’m unimpressed by U.S. Steel’s dividend yield. However, based on its cash per share and dividend coverage ratios, I won’t be surprised if the company raises its payout significantly in the coming years. Having said that, there’s no guarantee.
| Dividend Yield | 1.01% |
| Dividend Coverage Ratio | 48.49x |
| Cash Per Share | 12.47x |
Source: Seeking Alpha
Factor Analysis
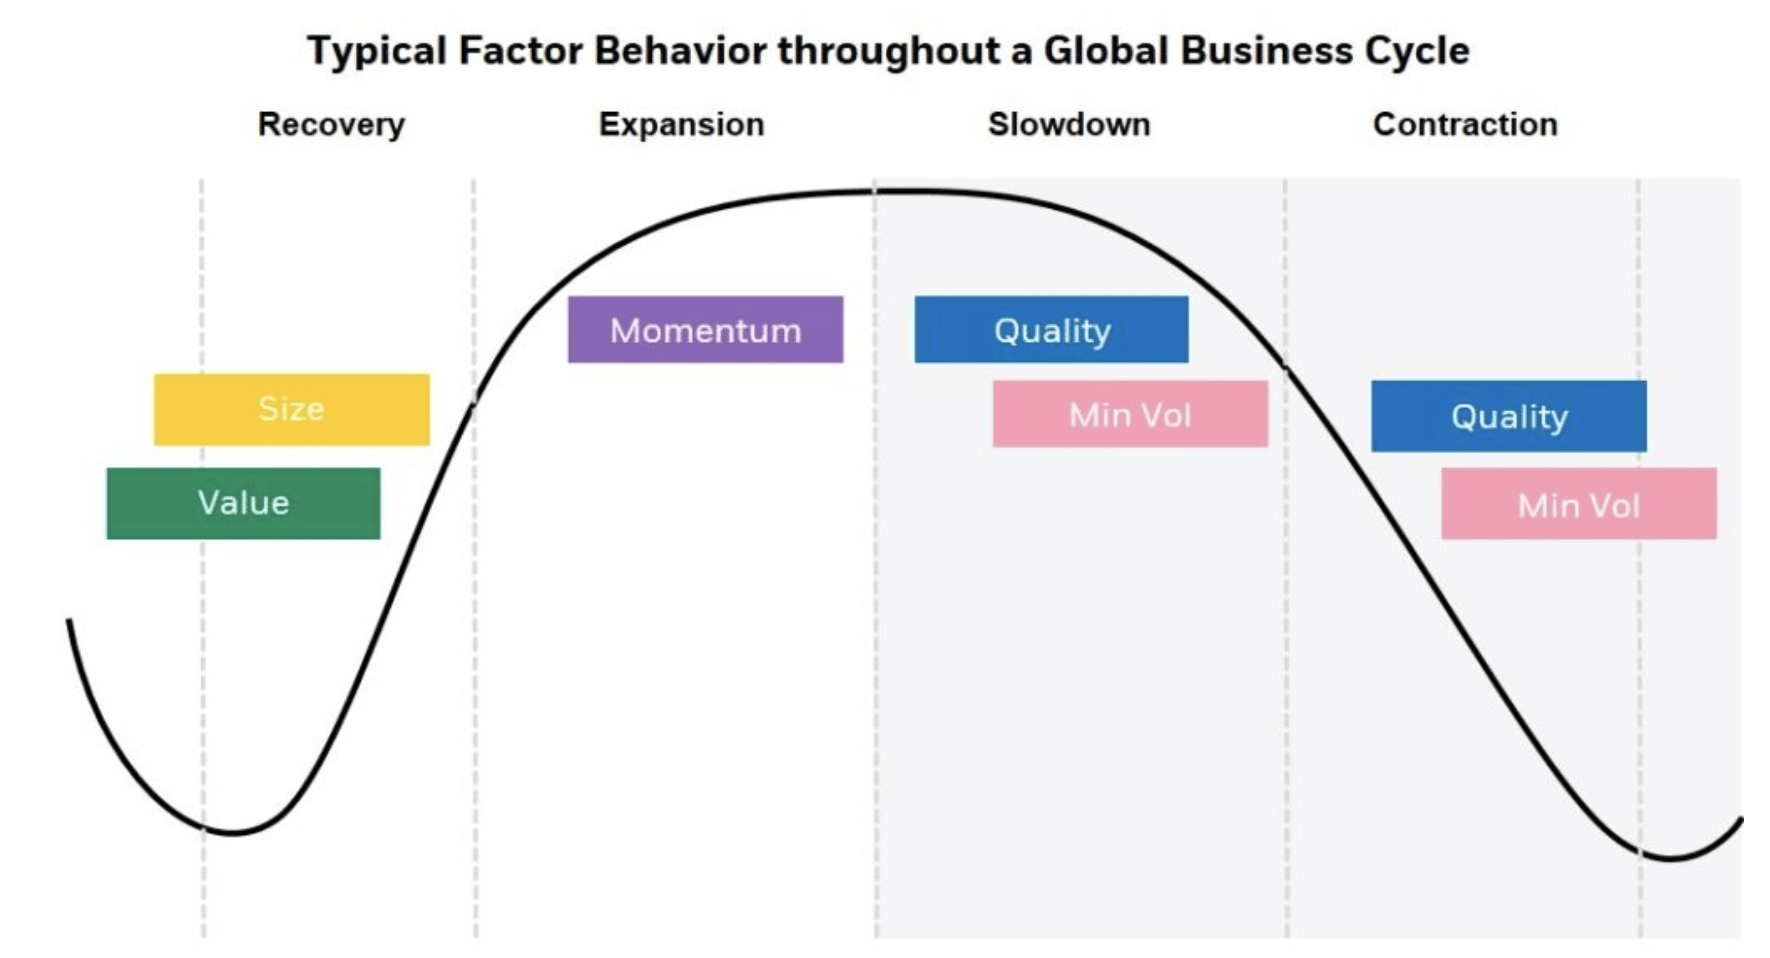
U.S. Steel’s factor grades communicate that the stock’s segmented as a value, growth, and profitability asset. The company’s profitability rating could be a big plus in today’s stock market climate as we’re likely in a risk-off market environment. To my knowledge, investors prefer investing in high-quality/robust stocks whenever economic uncertainties linger (see succeeding chart). Thus, I conclude that U.S. Steel’s factor grades could provide a valuable market-based tailwind.
Seeking Alpha BlackRock; Harvest
Concluding Thoughts of U.S. Steel Stock
U.S. Steel’s stock is in the balance and I’m urging investors to be careful of a potential value trap. In addition, there are various operational headwinds to be aware of.
However, on the plus side, U.S. Steel provides an array of strengths that could coalesce during a potential market recovery, subsequently causing the stock to be a “best-in-class” pick.
Based on our juxtaposition, we place a hold rating on U.S. Steel. We’ll reassess the stock’s fundamental features in due course.
Be the first to comment