

PhonlamaiPhoto/iStock via Getty Images
The market always gets what it wants and it is now in the process of validating the lower band (where demand rebounds due to a decline in oil price). Back on July 7, we wrote a report detailing why oil prices were going through such intense volatility. In it, we said:
The latest bout of oil price volatility has the sell-side and traders scratching their heads. Some are calling it capitulation by the bulls and some are calling it algo liquidation. Our theory is much simpler. The market knows that global oil demand comes under pressure when crude + refining margin reaches the $170 to $180/bbl range. As a result, the market is trying to test how low oil prices can go before seeing a rebound in oil demand.
The process over the past month and a half were not easy. During this period, there was one Energy Information Administration (“EIA”) report, in particular, that shocked the world. EIA reported on a 4-week moving average basis that the US implied gasoline demand fell below that of July 2020. That was a real head-scratcher and we wrote about how that data point is highly unlikely to be accurate.
But fast forwarding to today, we are starting to see the impacts lower oil prices have on consumer demand.
EIA, HFIR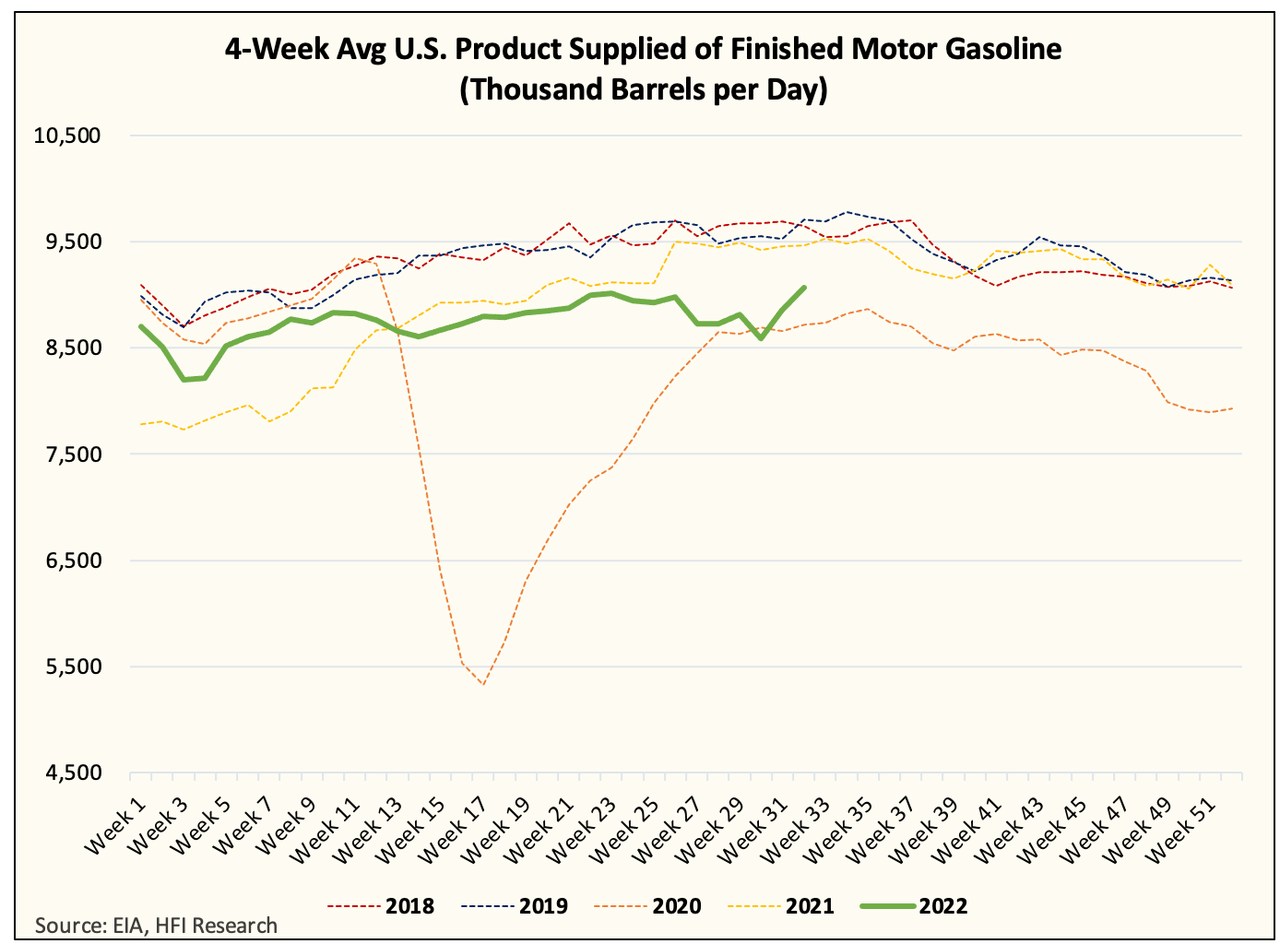
As you can see in the chart above, U.S. implied gasoline demand has recovered in a V-shaped fashion but remains below that of 2021. We wrote last week that the likely culprit for the “surprise” to the downside on gasoline demand is that EIA is overstating gasoline exports. This isn’t a surprise, since EIA gets the export/import data from Customs and does not track actual physical movement of tankers. If you don’t believe me, this week’s EIA crude export figure of ~5 million b/d was overstated by more than ~700k b/d, which explains why the adjustment figure jumped to nearly ~1.7 million b/d.
Now that gasoline demand is starting to recover, we can see signs that other demand variables are starting to recover as well.
EIA, HFIR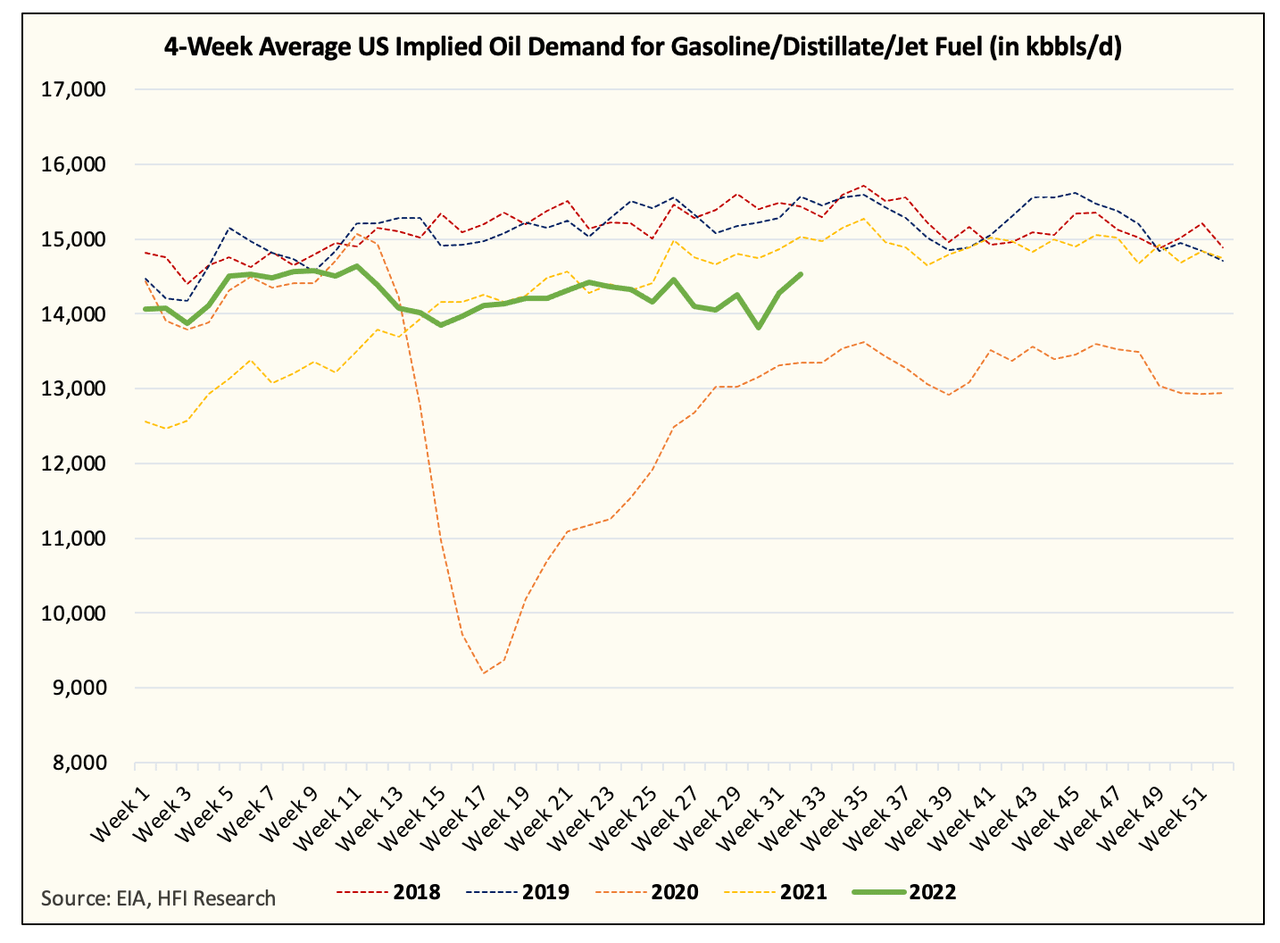
Here is the chart of gasoline, distillate, and jet fuel, and you can see that while we remain below 2021, the rebound is encouraging.
EIA, HFIR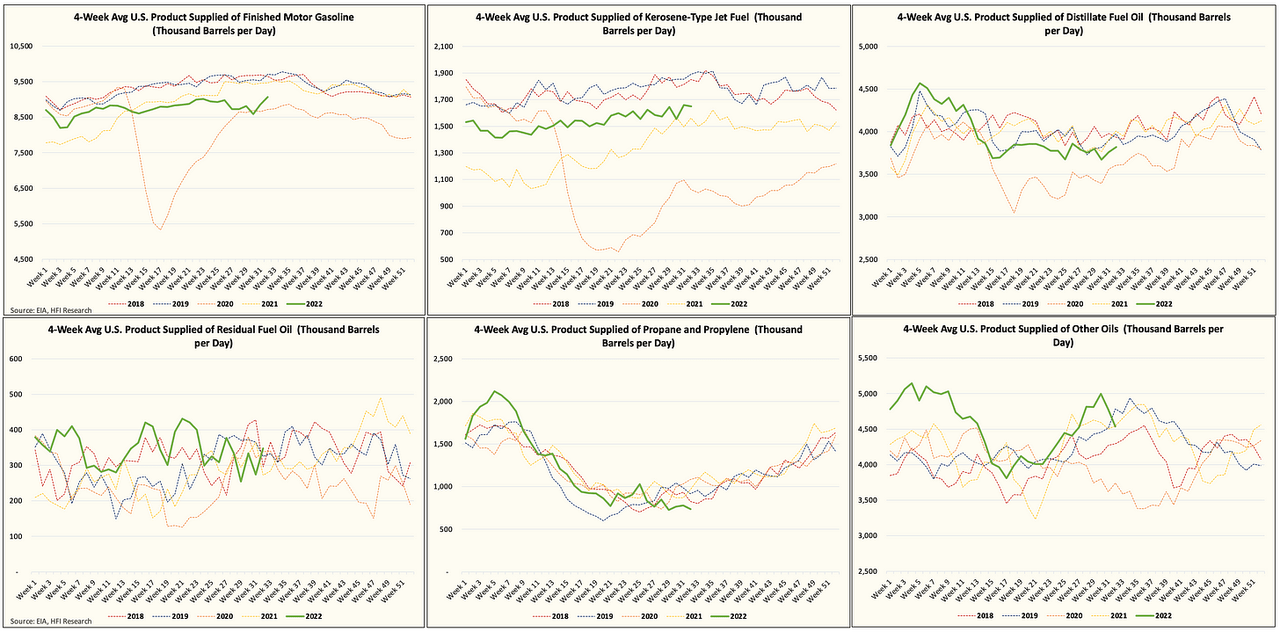
All of these charts indicate to me that the oil market has accomplished its goal of figuring out where demand starts to rebound (or finding the lower band). This level appears to be between $85 to $90 WTI and the 3-2-1 crack spread to be around $32/bbl. This puts the lower band at $117/bbl to $122/bbl or far lower than the $140 to $150 we previously assumed.
As a result, the price band appears to be $117 to $180 (crude + 3-2-1 crack).
Where is oil headed then?
In the near term, the oil market has to contend with Iranian uncertainty. If there is an agreement on the JCPOA and Iranian sanctions are lifted, this would imply an additional 1 to 1.4 million b/d of extra supply on the market. In addition, there are ~40 million bbls of floating storage that would be readily sold the moment the sanctions are lifted.
By our calculation, assuming demand remains stagnant going forward, Q4 oil market balance flips from a deficit of ~1.1 million b/d to a surplus of 0.2 million b/d.
This would be a bearish event for oil and would result in a $7 to $10 drop.
Now if we assume Iran doesn’t come back, then the recent rebound in demand is likely to push us somewhere into the lower/middle range of $117 to $180.
We expect refining margins to lead the charge on the way higher. We could see the 3-2-1 crack reclaim $40 to $45 with crude going back to $95 to $100. This would put us close to the middle of that price band.
What about energy stocks?
If we assume that Iran comes back, then we see crude dropping down to $80. Most energy stocks have an implicit price assumption of $65 to $70, so fundamentally and on a valuation basis, the oil price drop would hit sentiment, but it wouldn’t result in investors “overpaying.” Fundamentally speaking, energy companies will still generate high levels of free cash flow at $80, so this shouldn’t impact the current shareholder return policies.
Now if we assume Iran doesn’t come back, then once the market validates that oil demand is indeed bottoming at the $85 to $90/bbl range, we should start seeing a gradual uptick in the trading multiples. Since the valuations are tied to a much lower oil price scenario, we see investors becoming more comfortable with using a higher price range to underwrite these companies.
In addition, the recent earnings reports validate just how much free cash flows these companies are generating. With time and with the current debt pay downs taking place, more and more companies will be close to debt free by year-end resulting in even larger shareholder payouts. This will be a positive tailwind going into year-end.
Conclusion
All in all, we think the market has accomplished its goal of finding where demand starts to rebound. While it’s still a bit early to say for sure that demand is certainly rebounding, there are encouraging signs that suggest we are heading in that direction.
Be the first to comment