

DNY59
By Albert Durso, senior RMBS and CMBS strategist, Yield Book
The MBS market saw its performance steadily decline in the days leading into the month-end Jackson Hole Fed summit, as Vols ticked up and widening ensued. Mid-month tightening was overwhelmed by Fed Hawkishness as monthly performance continues to alternate.
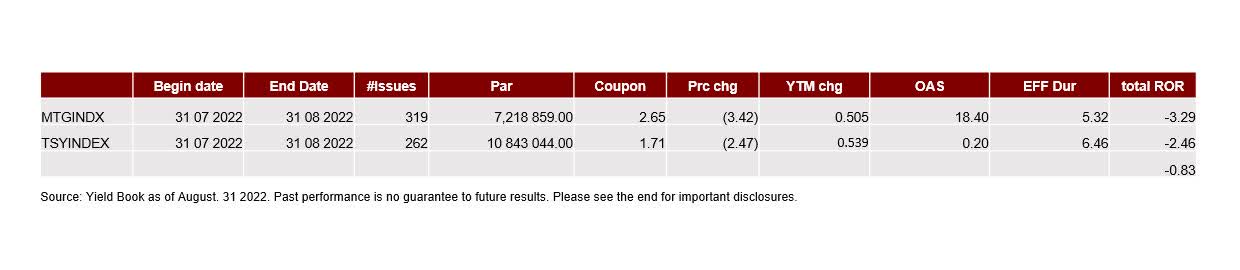
With the Fed on hold and fly fishing until September’s next meeting, Vols started the month lower before a late spike left the MBS index back -83bps versus the riskless Treasury index and lost -90bps spread advantage. The worst performers were lower 30yr 1.5%s through 3.5%s, losers as rates started to back up into month end, while upper coupons battled current production either to a standstill or somewhat positive as shorter durations held some appeal.
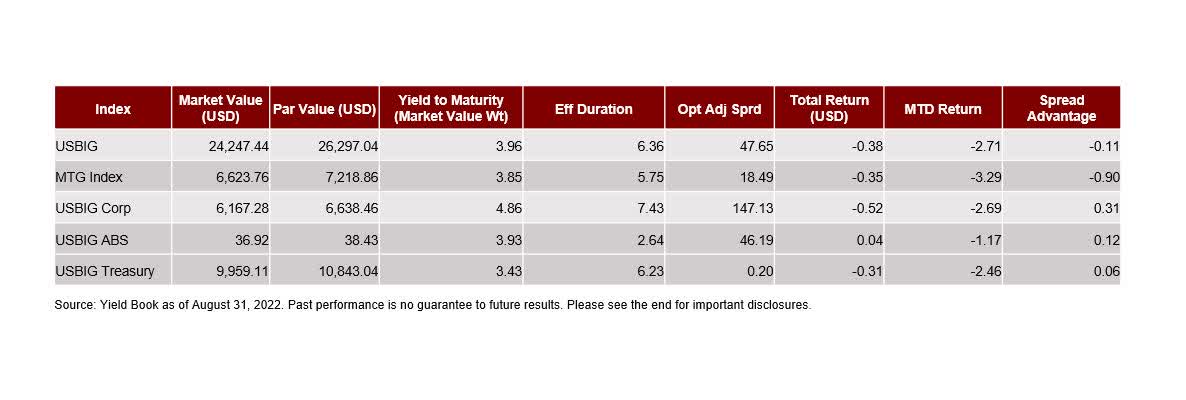
The macro backdrop continued with an inverted yield curve of -5bps net on the month (2s/10s curve -34.8bps), rising 10yr yields (+52bps to 3.09%), and elevated 3m10y vols (+12.5bps to +122.90).
The NYFRB MBS purchase operations schedule decreased from $12.8B for the month to $7.8B, roughly $390 million/per day. This might be the final Fed MBS ops buying schedule, as the capped run-off takes over and the market operates of its own volition.
Originator selling ticked down to $2.6B per day focused on 4%s, 4.5%s and 5%s. Money Managers again propped the belly (3.5%s and 4%s), lower coupons thriving only into rallies while UIC squared off to supply. Asia also went UIC (“up in coupon) on swap, selling lower 3%s and 3.5%s, for fuller 4%s and 4.5%s.
Dollar Rolls have a rare, subdued month, with few coupons sticking out during a 48hr scramble to cover existing shorts. Only G2 4%s had any life, popping to double digits drop (10/32nds) while most all other Class C settlements were tamed.
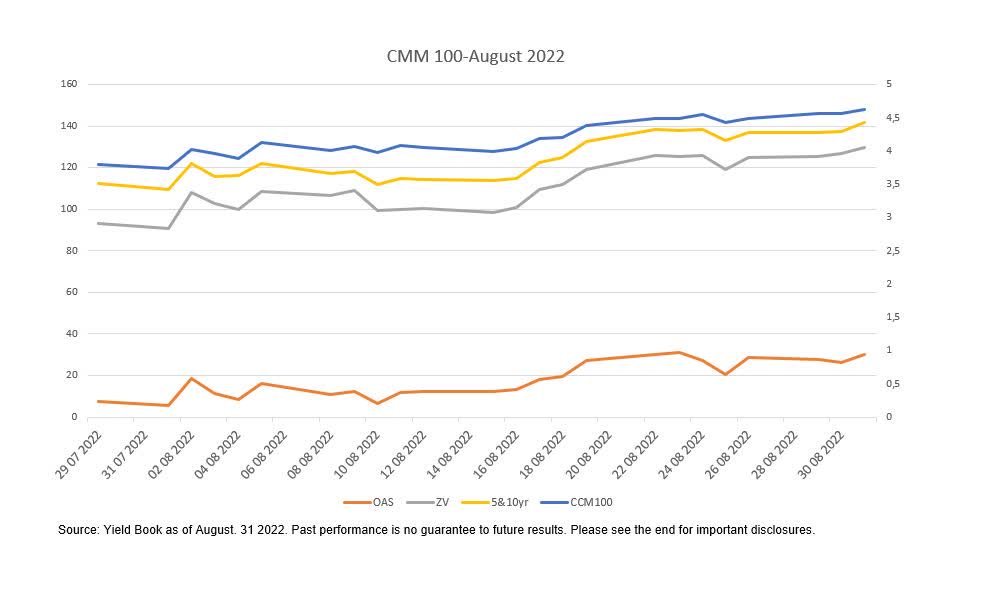
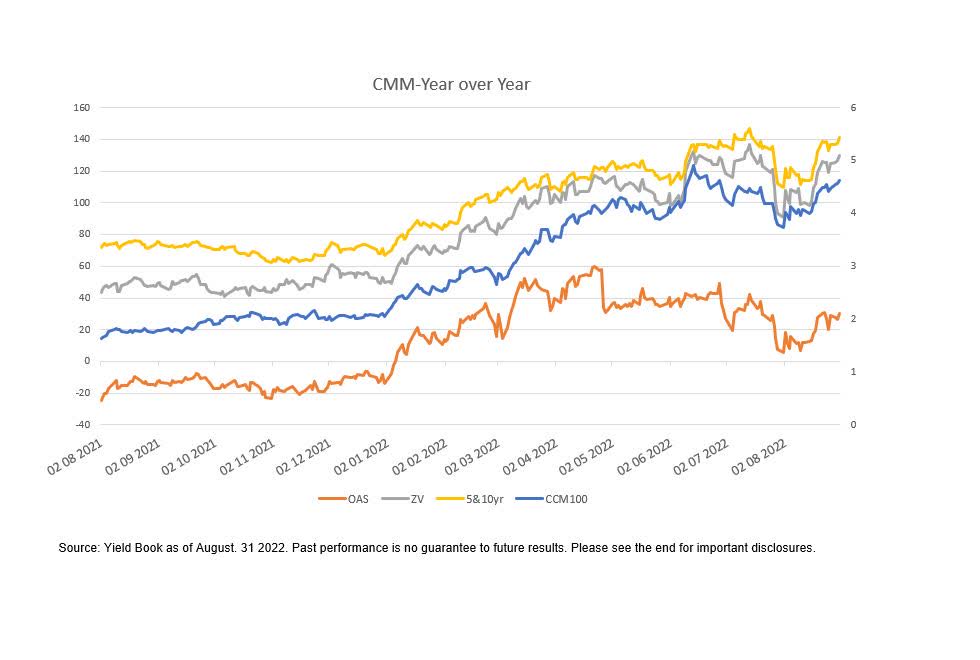
For August, the current coupon (par based) steadily climbed as 10yr rates pulled all else along; MTD 30yr CC rose 88.9 basis points to 4.62%, OAS spreads widened 24.6bps to 30.2, ZV spreads 38.9 bps to 129.8, and levels against the 5&10yr treasury blend were out 31.3bps to 141.5.
Year to date, the picture is even more pronounced; 30yr CC higher 257 bps, OAS levels about double (+43.8bps), ZV +80bps and vs the 5&10yr treasury blend +74.4bps.
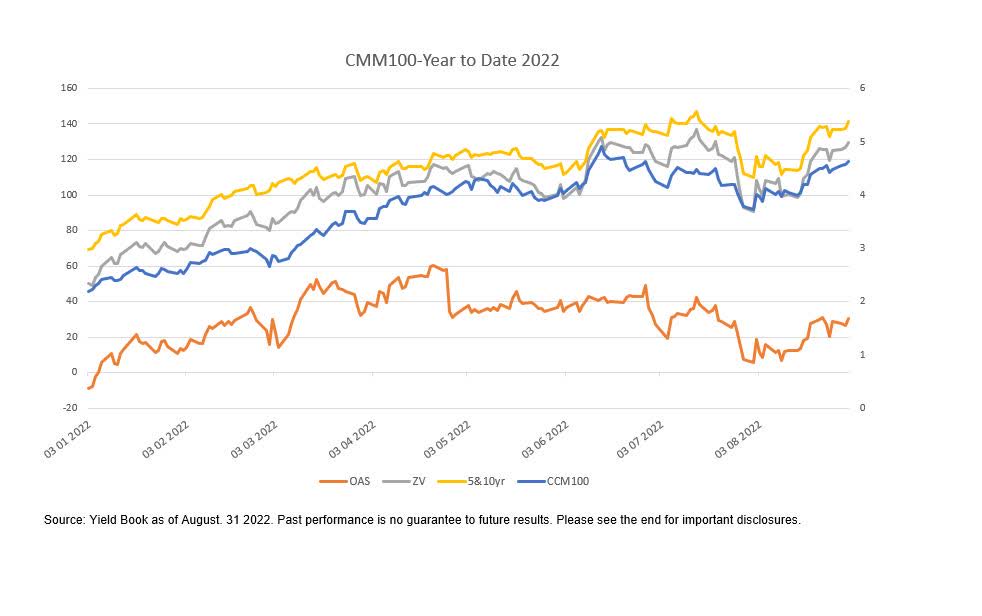
Year over year (July 21 to July 22), the picture follows the same pattern of widening as rates started the first climb to the next rates plateau rebounding off the Covid summer of 2020.
As we end the summer, we felt the need to scan the market and look at relative value across a wider swath of MBS sectors; Agency Pass Throughs, 15yrs/30yrs/20yrs, as well as structured CMOs and even Agency CMBS DUS. We focused on the cheaper end of the curve, 3-5yr effective duration.
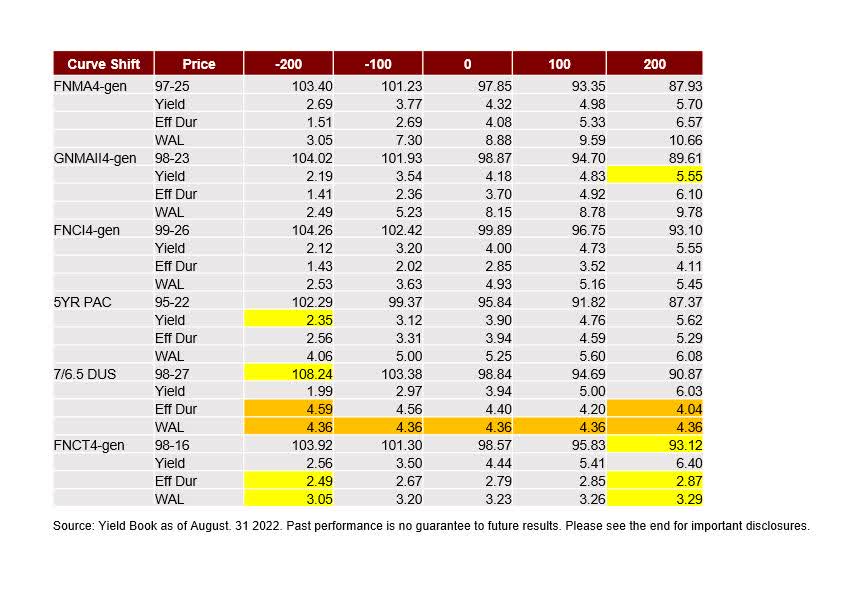
In both scenario (+/- 200bps), 20yr FNCT 4%s held up the best, with limited extension on a sell-off, and modest shortening into a rally. There were one or two exceptions, shown above, while even tighter window and lockout 7/6.5 DUS paper always shines with positive convexity due to its narrow open window and quasi bullet-like structure. The tradeoff is they trade 40bps inside of 20yr paper.
© 2022 London Stock Exchange Group plc and its applicable group undertakings (the “LSE Group”). The LSE Group includes (1) FTSE International Limited (“FTSE”), (2) Frank Russell Company (“Russell”), (3) FTSE Global Debt Capital Markets Inc. and FTSE Global Debt Capital Markets Limited (together, “FTSE Canada”), (4) FTSE Fixed Income Europe Limited (“FTSE FI Europe”), (5) FTSE Fixed Income LLC (“FTSE FI”), (6) The Yield Book Inc (“YB”) and (7) Beyond Ratings S.A.S. (“BR”). All rights reserved.
FTSE Russell® is a trading name of FTSE, Russell, FTSE Canada, FTSE FI, FTSE FI Europe, YB and BR. “FTSE®”, “Russell®”, “FTSE Russell®”, “FTSE4Good®”, “ICB®”, “The Yield Book®”, “Beyond Ratings®” and all other trademarks and service marks used herein (whether registered or unregistered) are trademarks and/or service marks owned or licensed by the applicable member of the LSE Group or their respective licensors and are owned, or used under licence, by FTSE, Russell, FTSE Canada, FTSE FI, FTSE FI Europe, YB or BR. FTSE International Limited is authorised and regulated by the Financial Conduct Authority as a benchmark administrator.
All information is provided for information purposes only. All information and data contained in this publication is obtained by the LSE Group, from sources believed by it to be accurate and reliable. Because of the possibility of human and mechanical error as well as other factors, however, such information and data is provided “as is” without warranty of any kind. No member of the LSE Group nor their respective directors, officers, employees, partners or licensors make any claim, prediction, warranty or representation whatsoever, expressly or impliedly, either as to the accuracy, timeliness, completeness, merchantability of any information or of results to be obtained from the use of FTSE Russell products, including but not limited to indexes, data and analytics, or the fitness or suitability of the FTSE Russell products for any particular purpose to which they might be put. Any representation of historical data accessible through FTSE Russell products is provided for information purposes only and is not a reliable indicator of future performance.
No responsibility or liability can be accepted by any member of the LSE Group nor their respective directors, officers, employees, partners or licensors for (a) any loss or damage in whole or in part caused by, resulting from, or relating to any error (negligent or otherwise) or other circumstance involved in procuring, collecting, compiling, interpreting, analysing, editing, transcribing, transmitting, communicating or delivering any such information or data or from use of this document or links to this document or (b) any direct, indirect, special, consequential or incidental damages whatsoever, even if any member of the LSE Group is advised in advance of the possibility of such damages, resulting from the use of, or inability to use, such information.
No member of the LSE Group nor their respective directors, officers, employees, partners or licensors provide investment advice and nothing in this document should be taken as constituting financial or investment advice. No member of the LSE Group nor their respective directors, officers, employees, partners or licensors make any representation regarding the advisability of investing in any asset or whether such investment creates any legal or compliance risks for the investor. A decision to invest in any such asset should not be made in reliance on any information herein. Indexes cannot be invested in directly. Inclusion of an asset in an index is not a recommendation to buy, sell or hold that asset nor confirmation that any particular investor may lawfully buy, sell or hold the asset or an index containing the asset. The general information contained in this publication should not be acted upon without obtaining specific legal, tax, and investment advice from a licensed professional.
Past performance is no guarantee of future results. Charts and graphs are provided for illustrative purposes only. Index returns shown may not represent the results of the actual trading of investable assets. Certain returns shown may reflect back-tested performance. All performance presented prior to the index inception date is back-tested performance. Back-tested performance is not actual performance, but is hypothetical. The back-test calculations are based on the same methodology that was in effect when the index was officially launched. However, back-tested data may reflect the application of the index methodology with the benefit of hindsight, and the historic calculations of an index may change from month to month based on revisions to the underlying economic data used in the calculation of the index.
This document may contain forward-looking assessments. These are based upon a number of assumptions concerning future conditions that ultimately may prove to be inaccurate. Such forward-looking assessments are subject to risks and uncertainties and may be affected by various factors that may cause actual results to differ materially. No member of the LSE Group nor their licensors assume any duty to and do not undertake to update forward-looking assessments.
No part of this information may be reproduced, stored in a retrieval system or transmitted in any form or by any means, electronic, mechanical, photocopying, recording or otherwise, without prior written permission of the applicable member of the LSE Group. Use and distribution of the LSE Group data requires a licence from FTSE, Russell, FTSE Canada, FTSE FI, FTSE FI Europe, YB, BR and/or their respective licensors.
Editor’s Note: The summary bullets for this article were chosen by Seeking Alpha editors.
Be the first to comment