

ipopba
A guest post by Ovi
All of the Crude plus Condensate (C + C) production data for the US state charts comes from the EIAʼs September Petroleum Supply monthly PSM which provides data up to July 2022.
US Crude plus Condensate (C + C) production data (EIAʼs September Petroleum Supply monthly PSM – data up to July 2022.)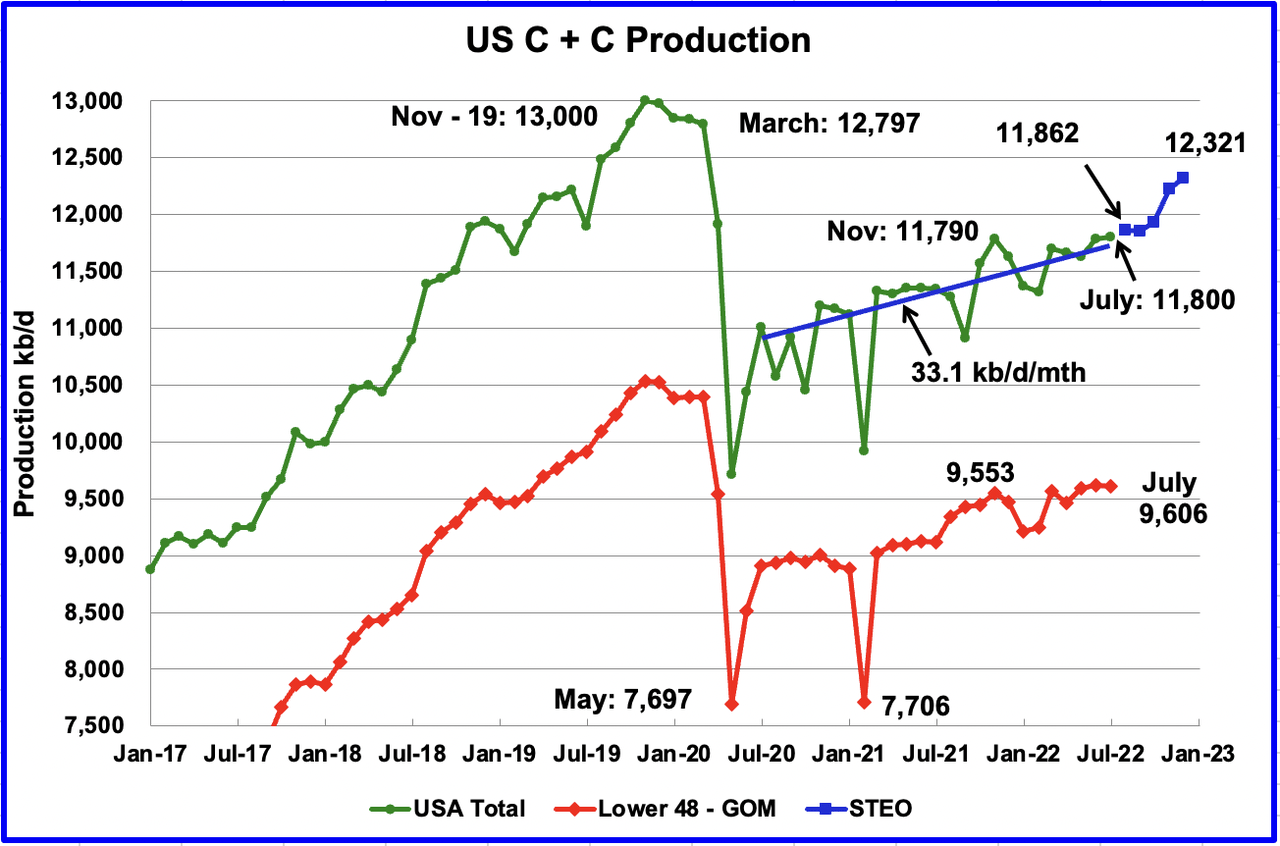
U.S. July production increased by a minimal 12 kb/d to 11,800 kb/d. For July, the states with increasing production were offset by states with decreasing production. July’s production was a new recent high. Production was 10 kb/d higher than November 2021 which was producing at a rate of 11,790 kb/d.
However, it should be noted that June’s oil production was revised down from 11,816 kb/d to 11,788 kb/d in the September report.
While overall US production increased, a clearer indication of the health of US onshore L48 oil production can be gleaned by looking more closely at those states. In the onshore L48, July production decreased by 11 kb/d to 9,606 kb/d from June’s 9,617 kb/d.
The blue graph, taken from the September 2022 STEO, is the production forecast for the US from August 2022 to December 2022. Output for December 2022 is expected to be 12,321 kb/d, 127 kb/d lower than projected in the August report.
From August 2022 to December 2022, production is expected to increase by 459 kb/d or at an average rate of 115 kb/d/mth. This rate is more than triple the rate of the blue line covering US C + C production from July 2020 to July 2022. The blue line, which just used July 2020 data and July 2022 data to estimate an average rate, has a production growth rate of 33.1 kb/d/mth. The much higher forecast production rate for the last half of 2022 could be related to an upcoming increase in GOM production. See GOM chart below.
Oil Production Ranked by State
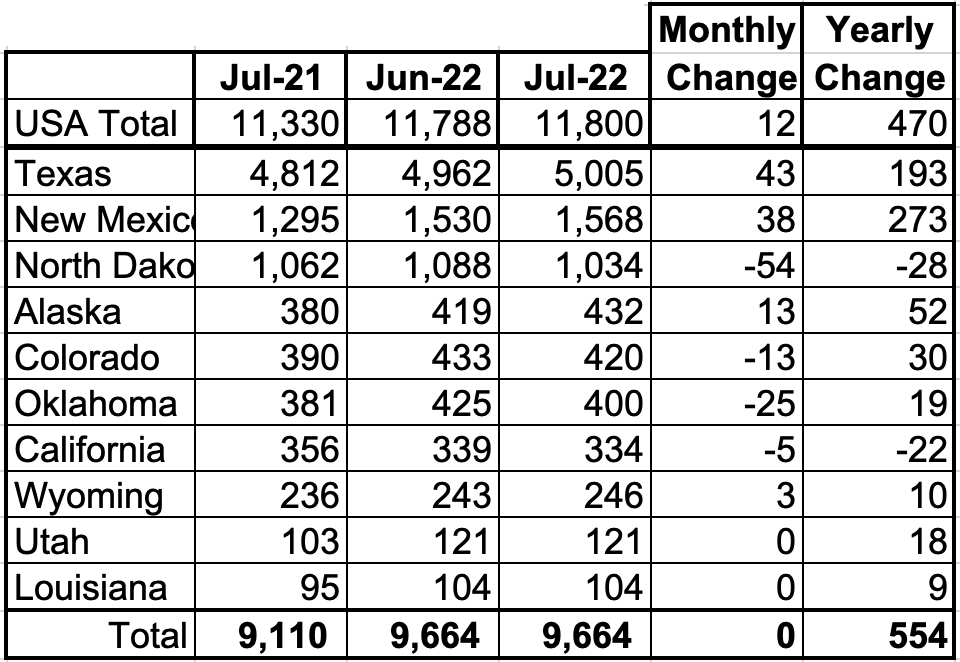
Listed above are the 10 states with the largest US production. These 10 accounted for 81.9% of all U.S. oil production out of a total production of 11,816 kb/d in July 2022. As can be seen, the states with increasing production were offset by decreasing production in the remaining states for no net monthly gain.
On a YoY basis, US production increased by 470 kb/d with the majority having come from New Mexico and Texas.
State Oil Production Charts
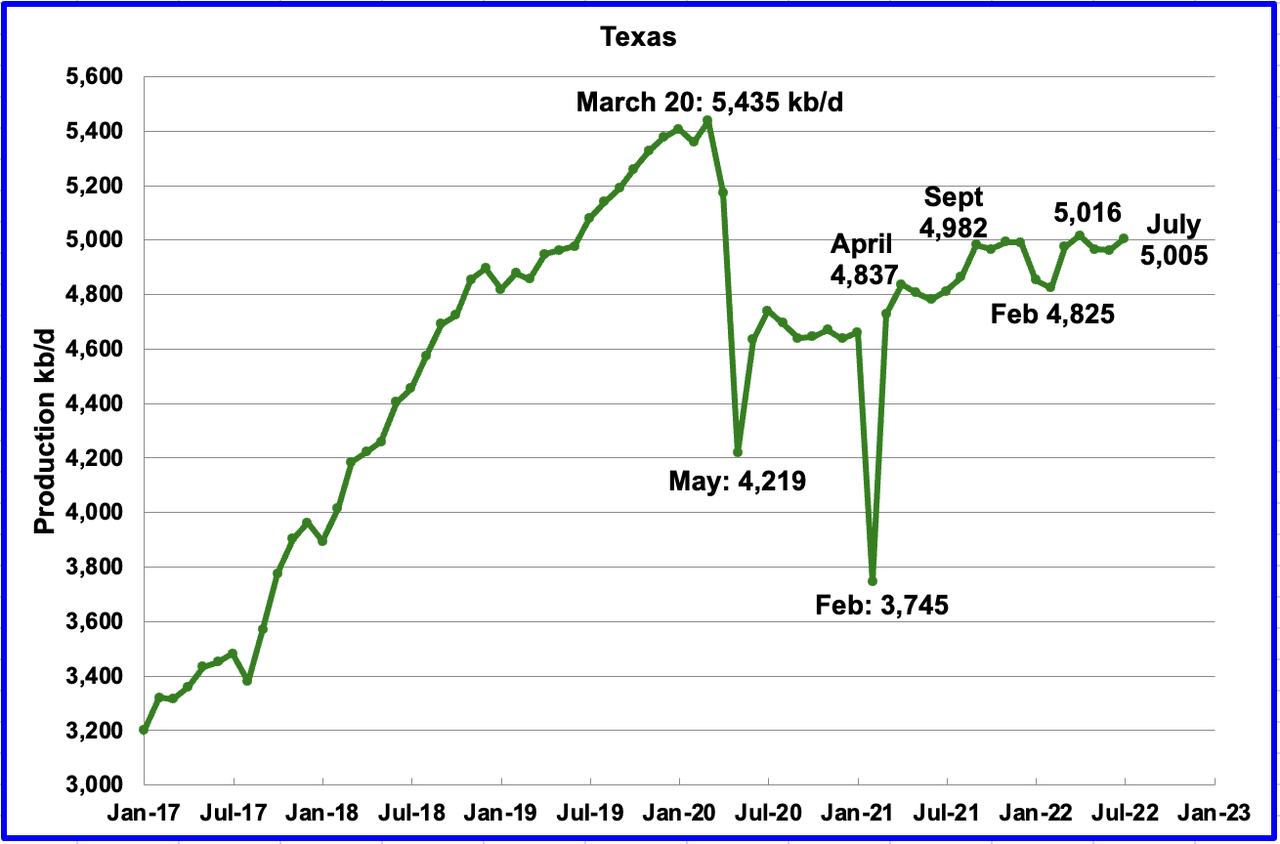
Texas production increased by 43 kb/d in July to 5,005 kb/d from 4,962 kb/d in June.
In September 2021 there were 205 Hz oil rigs operating in Texas. By the last week of July 2022, 309 Hz oil rigs were operational, an increase of 104 rigs and production increased from 4,982 kb/d in September 2021 to 5,005 kb/d in July, an increase of just 23 kb/d over a period of ten months.
Texas production has been essentially flat over the last 10 months. This could be due to the slower growth in the Texas Permian being offset by the decline in the Eagle Ford basin.
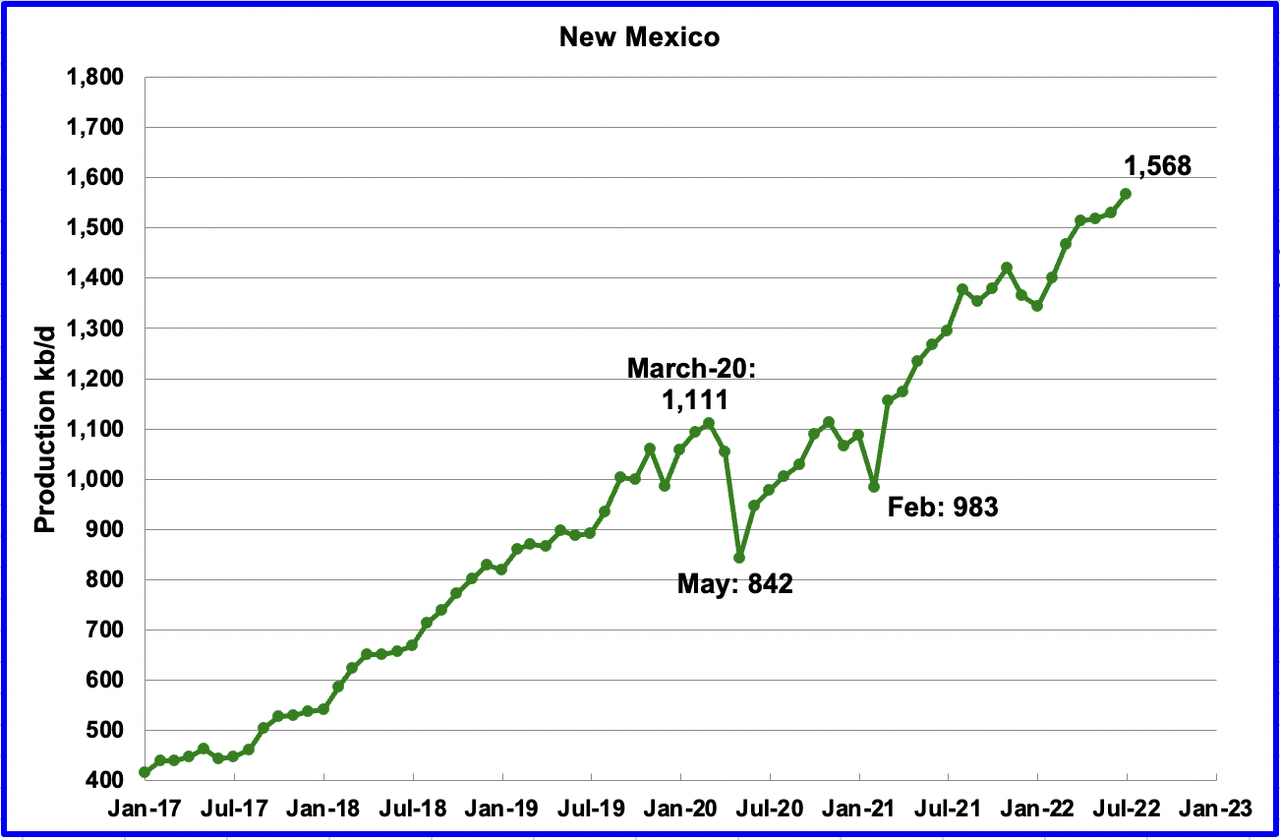
July’s New Mexico production increased by 38 kb/d to 1,568 kb/d to a new record high. From January 2022 to the end of May, close to 92 rigs were in operation in the New Mexico Permian. However, in July operational rigs peaked at 104. The recent production increase is due to more wells being drilled and more wells being completed than drilled.
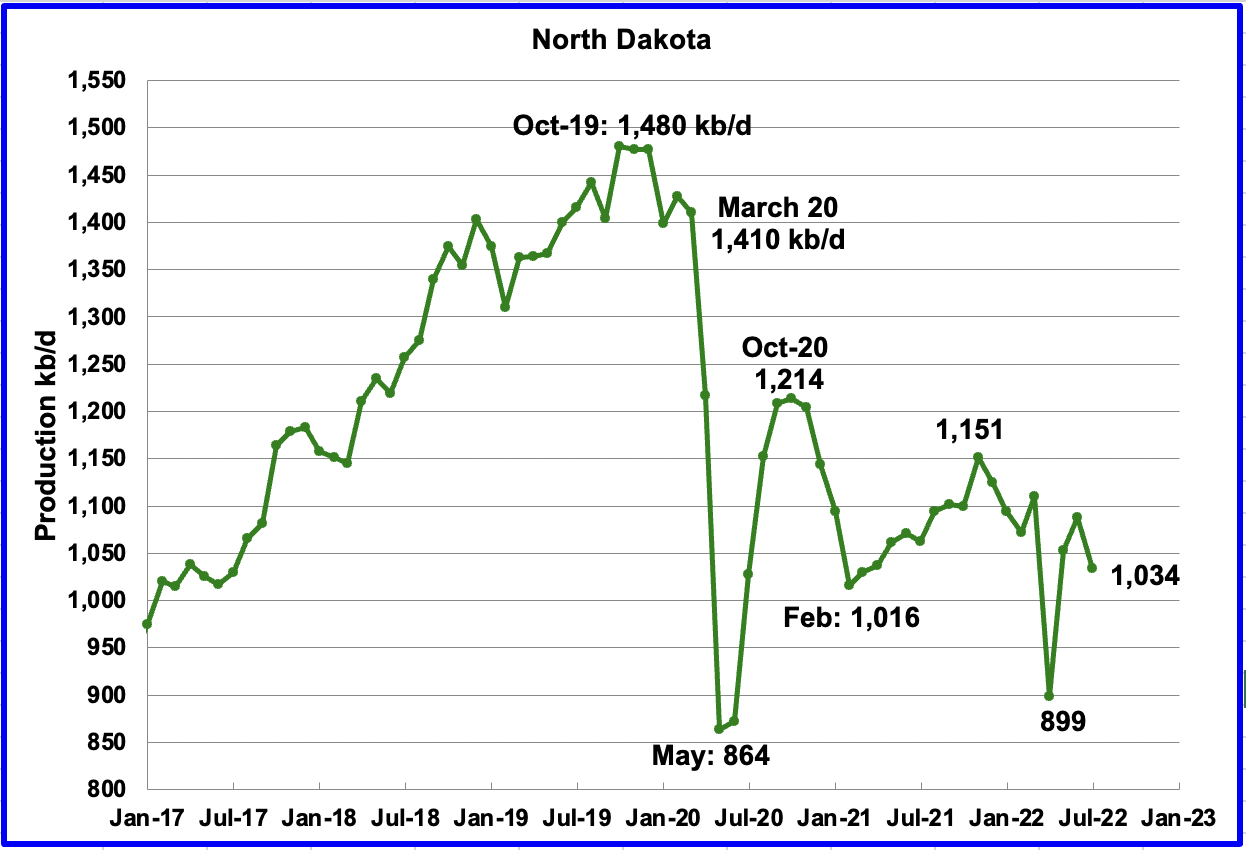
North Dakota’s July output dropped to 1,034 kb/d, a decrease of 54 kb/d from June.
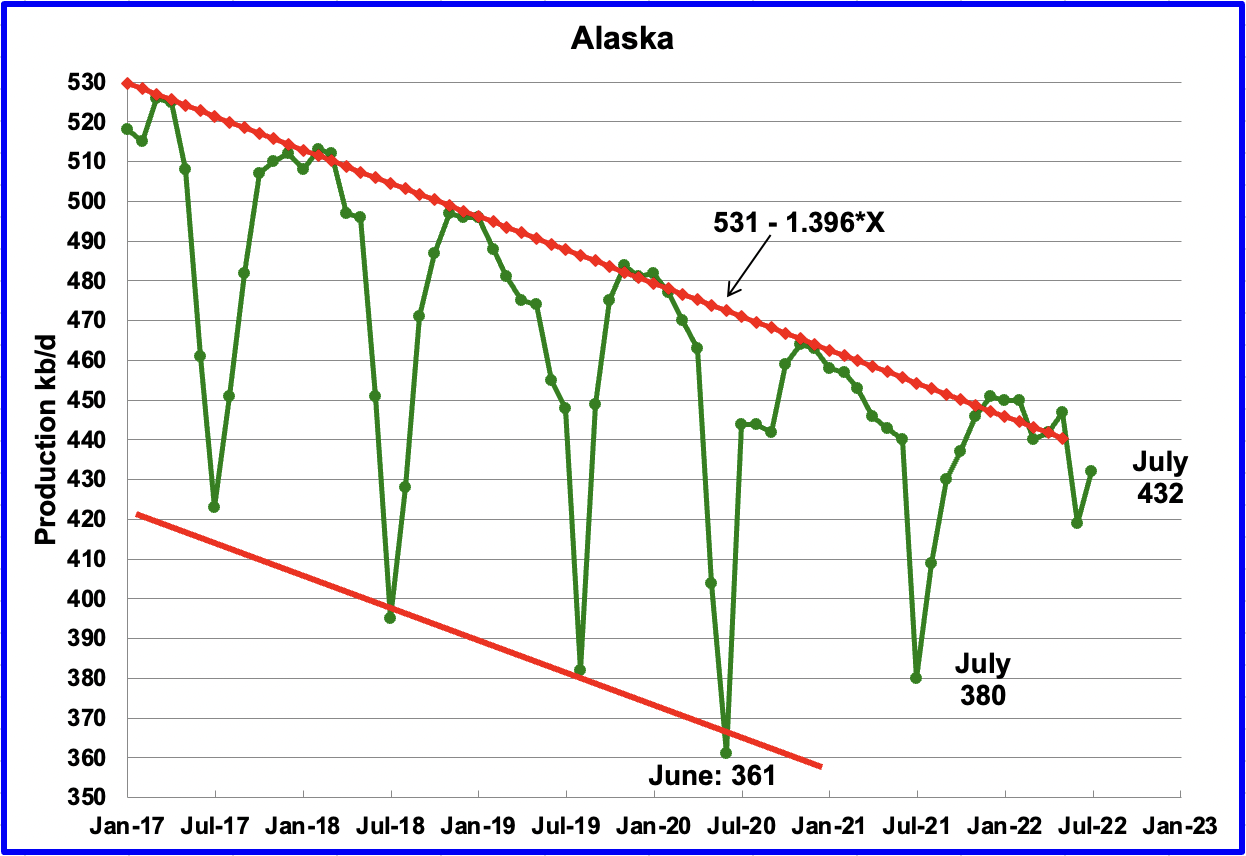
Alaskaʼs July output increased by 13 kb/d to 432 kb/d. July production typically rebounds due to the end of summer maintenance.
ConocoPhilips continues to pursue the Willow oil project in Alaska while NGOs oppose it. Alaskan officials hope the project will help offset declining oil production in the state.
“The largest proposed oil and gas project on U.S. federal lands moved one step closer to approval in early July. At 180,000 barrels per day, or 629 million barrels of oil over the course of its 30-year lifetime, the Willow Project would produce more oil than any other public-lands fossil fuel development. The Trump administration’s Interior Department approved the project in October 2020. But in August 2021, a federal judge rejected it following a lawsuit over the project’s impact on the climate, nearby communities and area wildlife. The Biden administration agreed to conduct another environmental review, which the Bureau of Land Management (BLM) released on July 8.”
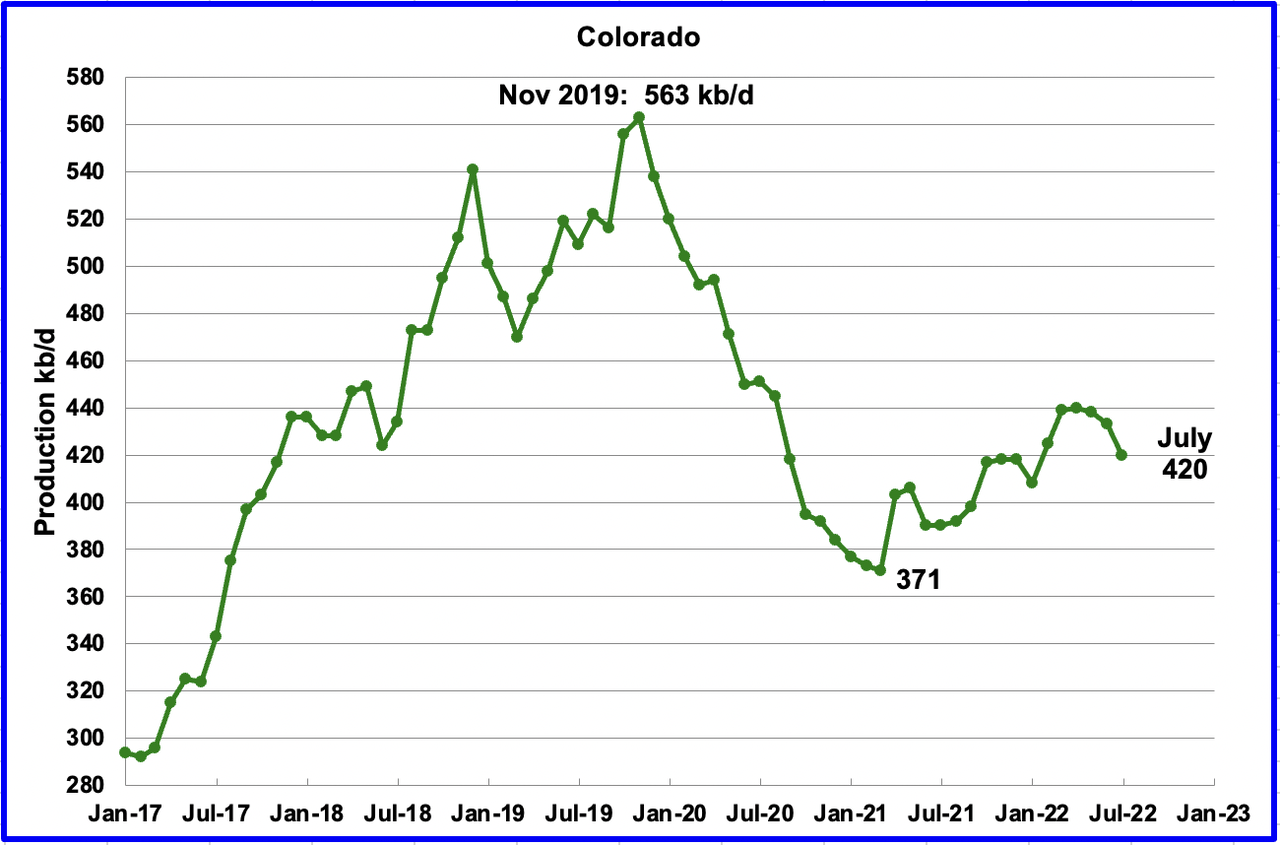
Coloradoʼs July production decreased by 13 kb/d to 420 kb/d. After having flat production in March and April, production began to decrease. A recent Colorado report forecasts little oil growth is likely in Colorado for 2022.
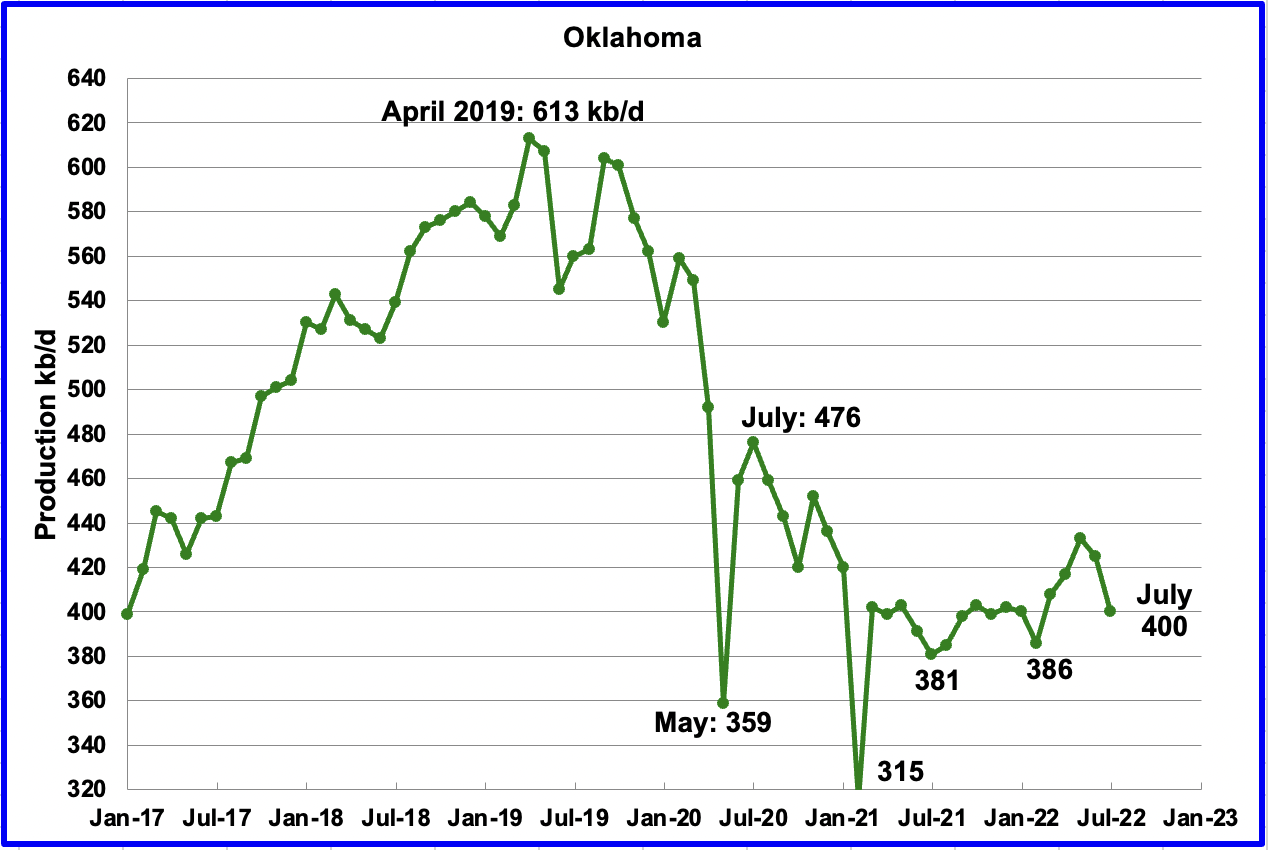
Oklahoma’s output in July decreased by 25 kb/d to 400 kb/d. From January to April, close to fifty rigs were operating in Oklahoma. In July the rig count increased to 57. Since March 2021, production has been hovering around 400 kb/d.
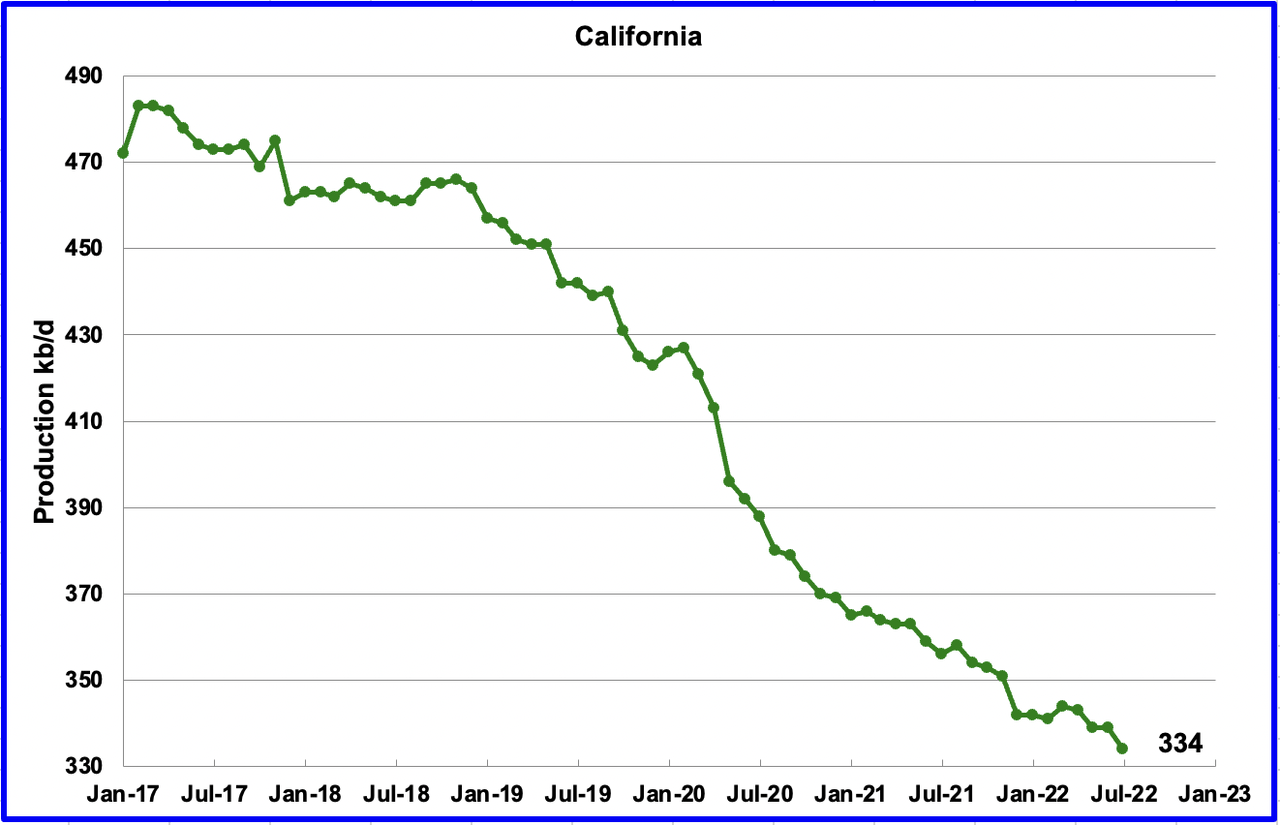
California’s slow output decline continued in July. Output decreased by 5 kb/d to 334 kb/d.
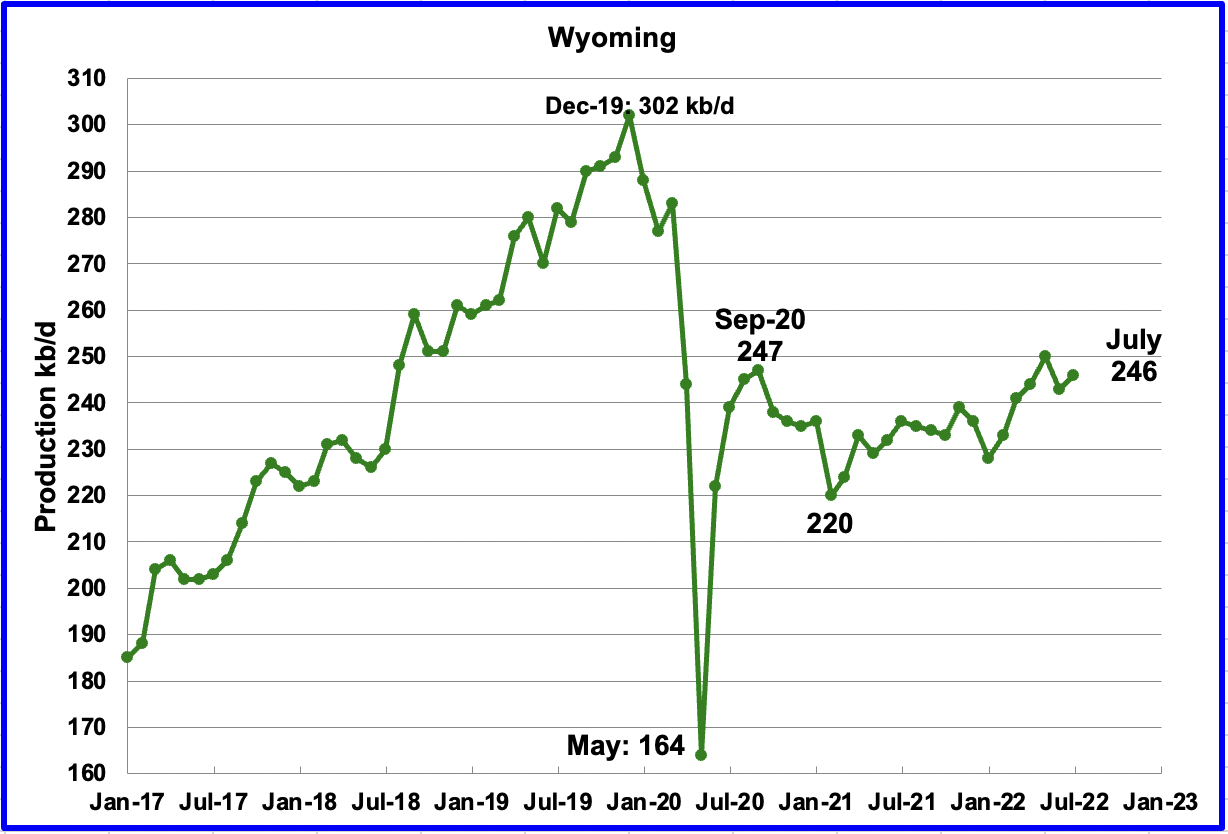
Wyoming’s oil production has been on a slow unsteady uptrend from the low of 220 kb/d in February 2021 due to increased drilling. July’s output increased to 246 kb/d.
In August, a new oil field was discovered. A geological company confirmed the Wyoming deep discovery has total Original Oil in Place of 993.5 million barrels.
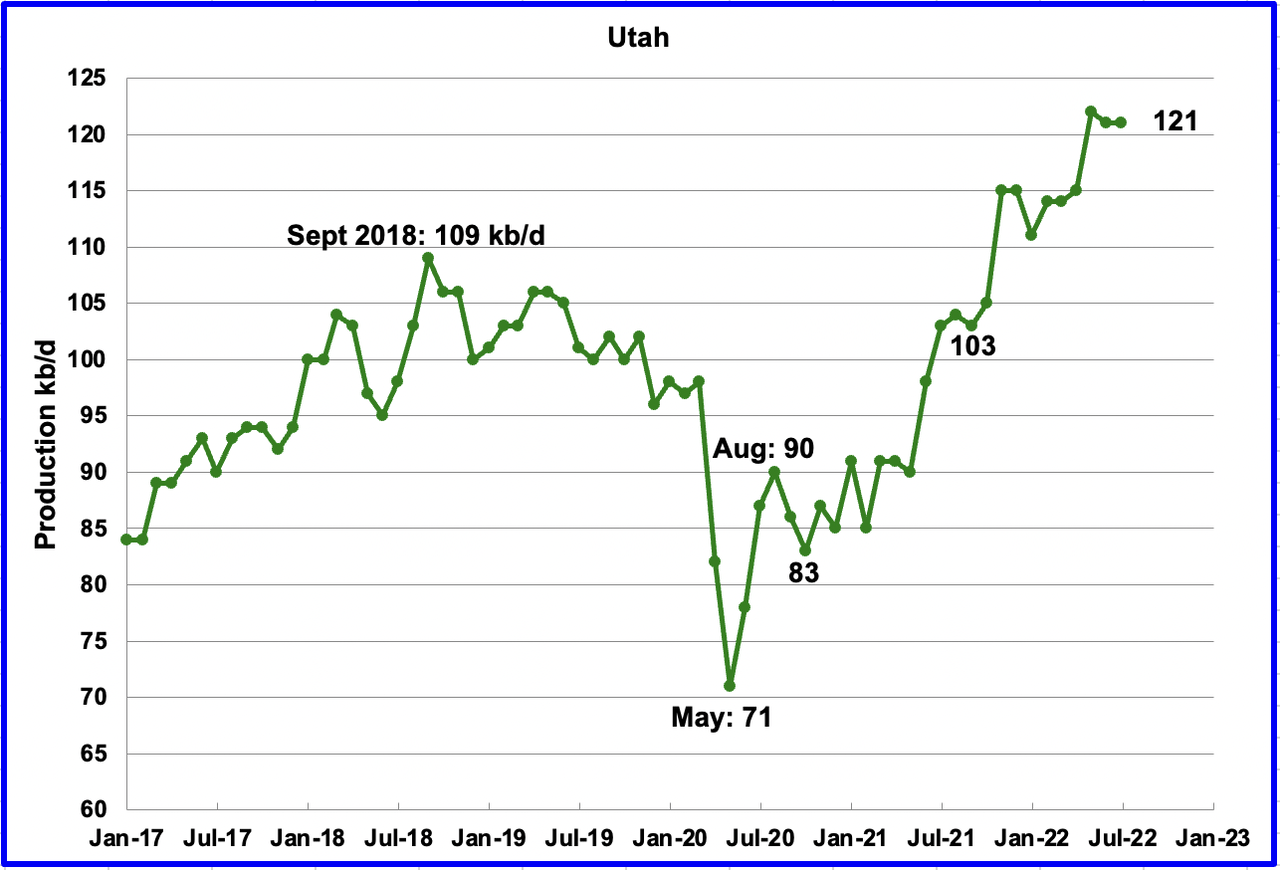
Utah’s production hit a new high in May of 122 kb/d but dropped in June and July. July’s production decreased by 1 kb/d to 121 kb/d. Utah had 9 rigs operating in early July and then dropped to 7 in the last two weeks.
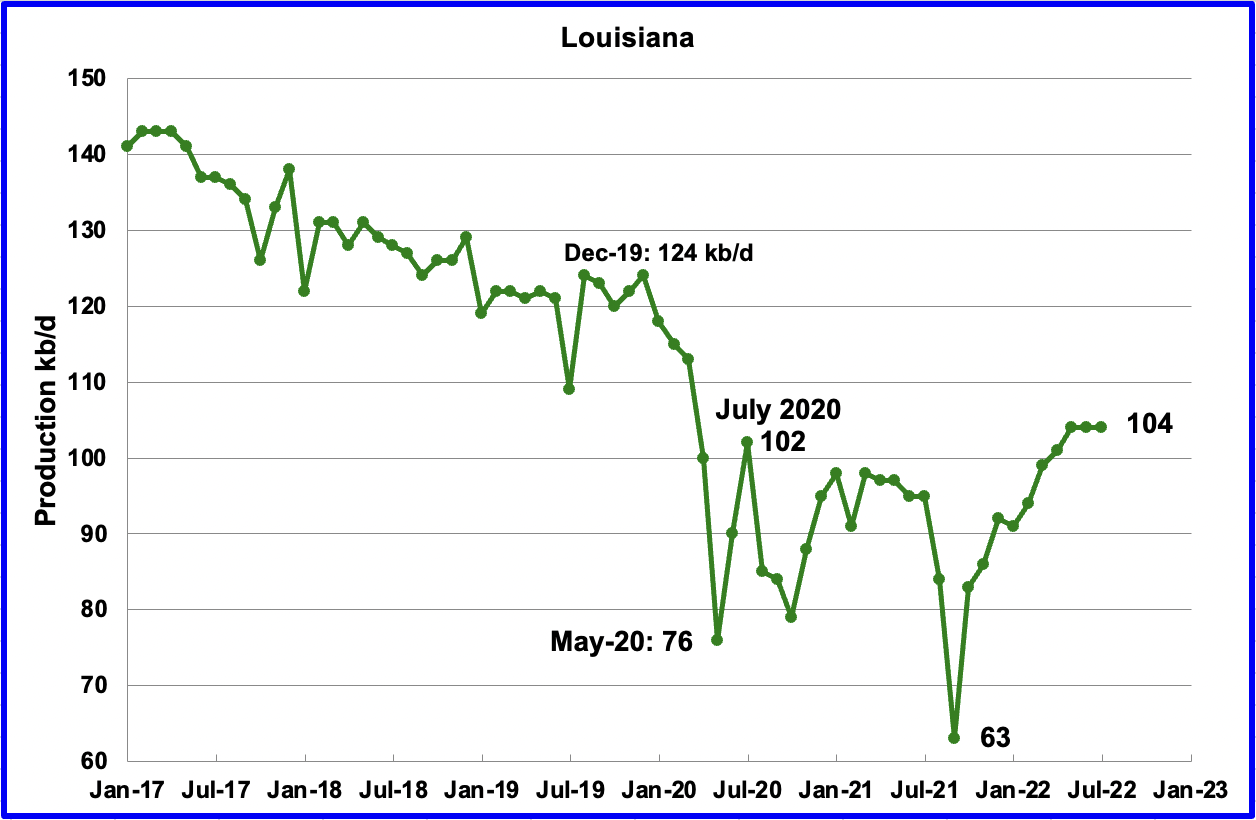
Louisiana’s output was unchanged in June and July at 104 kb/d. July’s output of 104 kb/d exceeded its previous high of 102 kb/d in July 2020.
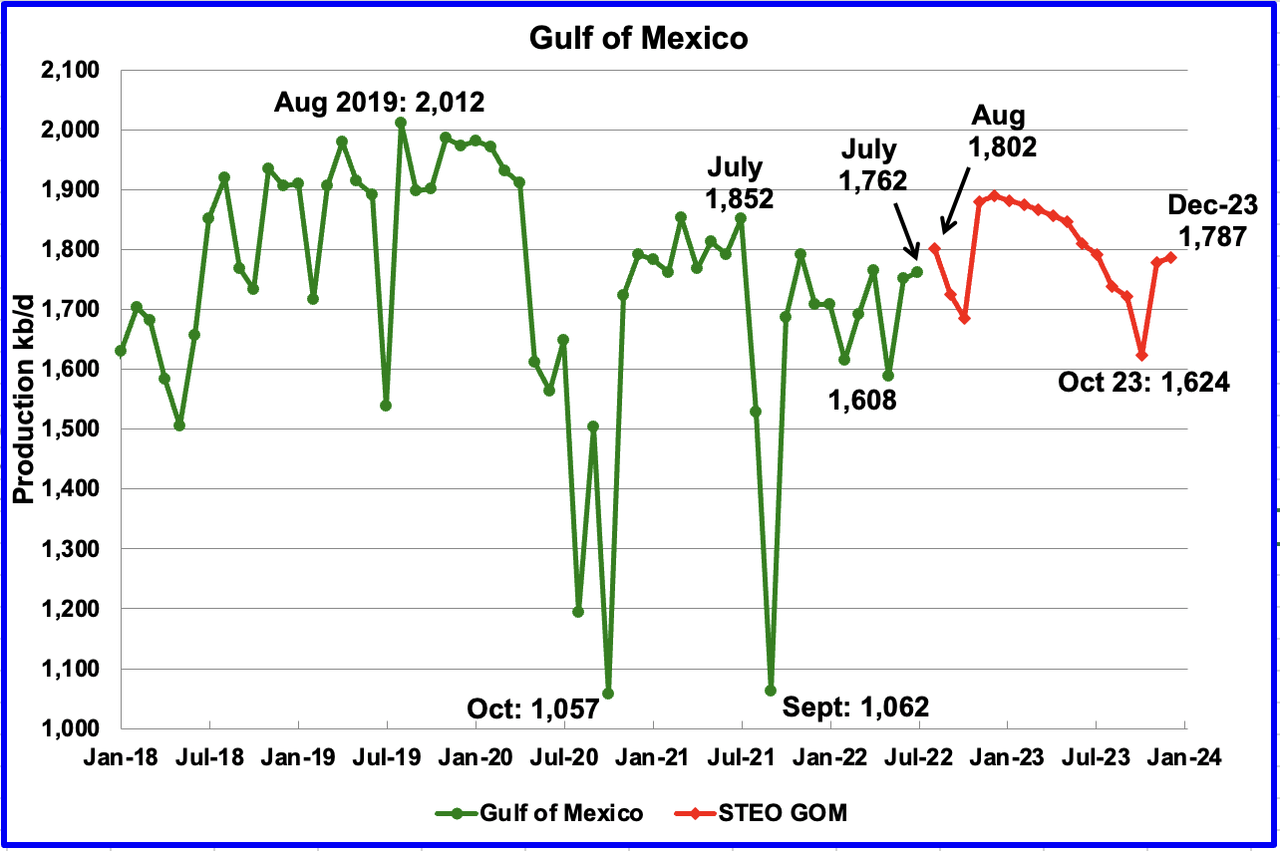
GOM production increased by 10 kb/d in July to 1,762 kb/d. If the GOM was a state, its production would normally rank second behind Texas.
The September 2022 STEO projection for the GOM output has been added to this chart and projects output will be 1,787 kb/d in December 2023, slightly lower than August 2022 at 1,802 kb/d. For August 2022, the STEO is projecting an increase of 40 kb/d to 1,802 kb/d. However, over the next 18 months, the sharp increase shown in November will be slowly eroded by the 24/7 decline rates in other GOM fields.
A Different Perspective on US Oil Production
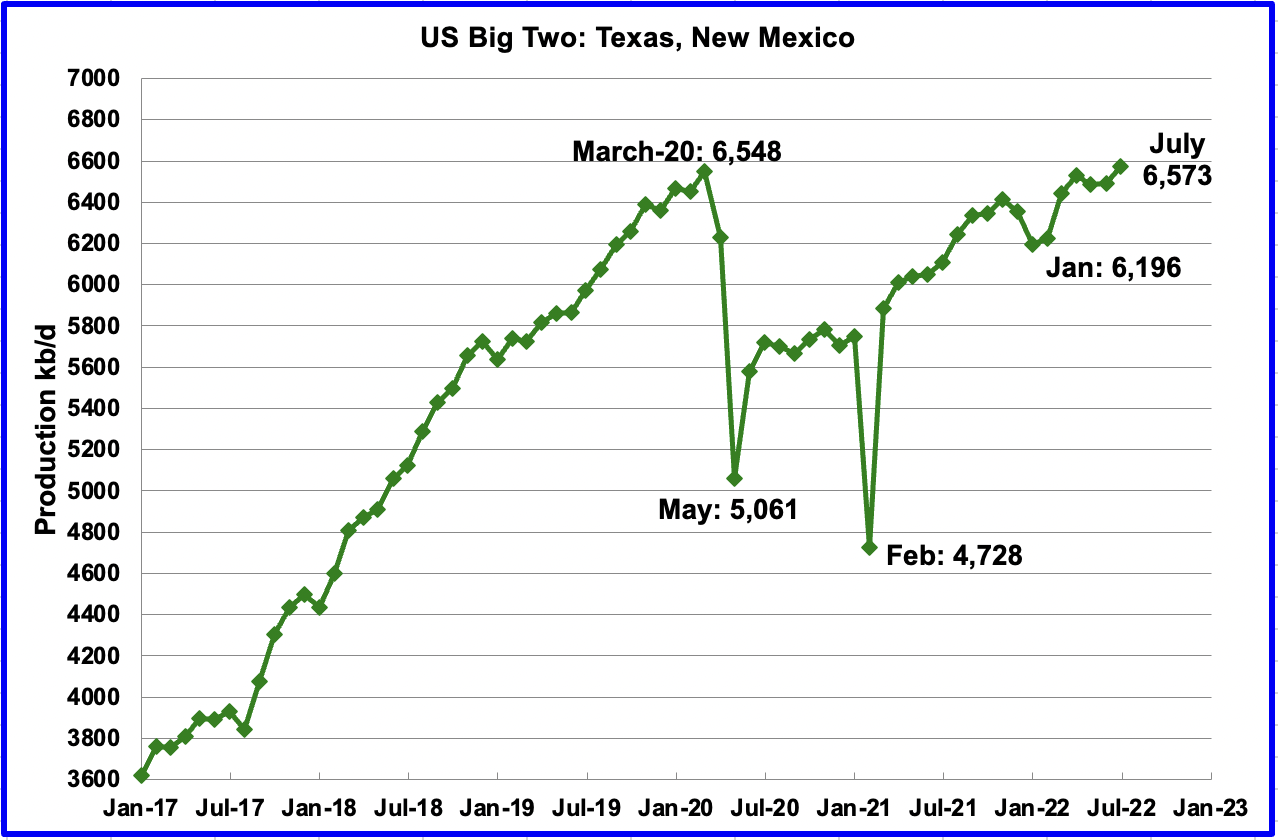
The Big Two states, combined oil output for Texas and New Mexico.
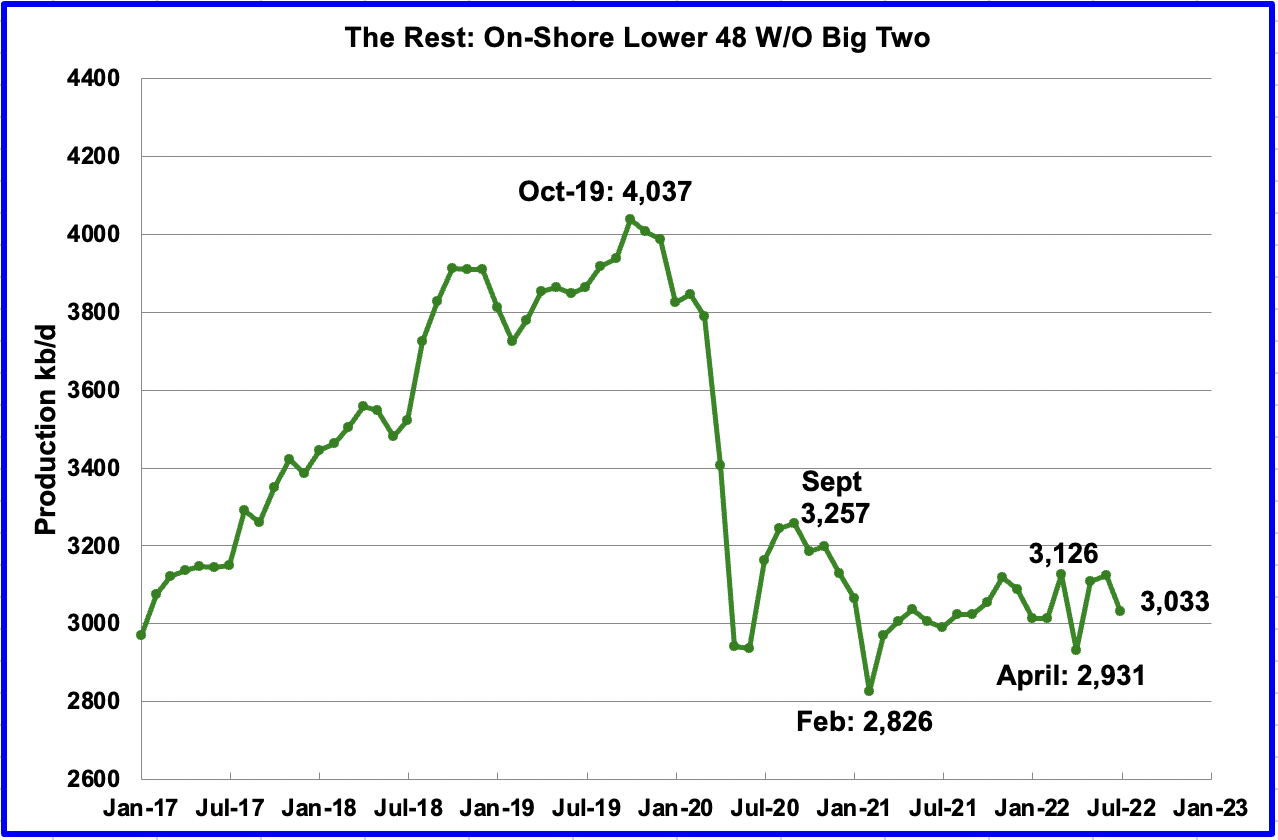
Oil production for The Rest
To get a different perspective on US oil production, the above two charts have segregated US state production into two groups, “The Big Two” and the “onshore L48 W/O Big Two” or The Rest.
July’s production in the Big Two states increased by a combined 81 kb/d to a new high of 6,573 kb/d with Texas increasing by 43 kb/d and New Mexico adding 38 kb/d.
Over the past year, production in The Rest appears to be holding steady at close to 3,100 kb/d. In June The Rest dropped by 92 kb/d to 3,033 kb/d.
The main thing to notice in the Rest Chart is that current production is 1,000 kb/d below the high of October 2019. The question we need answered Is “Is this a permeant loss that will never be recovered?
Rigs and Fracs
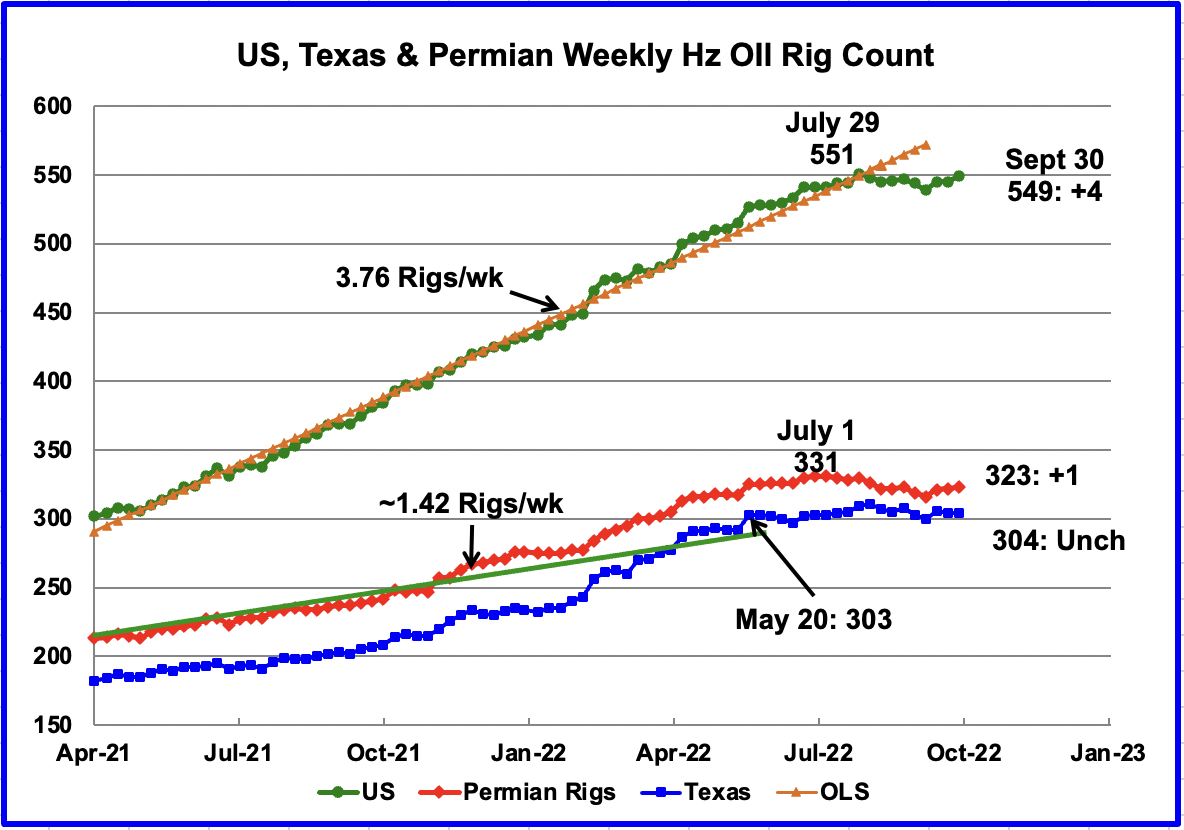
Since the beginning of April 2021 through to the week ending July 29, 2022, the US has been adding horizontal oil rigs at a rate of close to 3.82 rigs/wk, orange OLS line, and peaked at 551 rigs in the week ending July 29. However, since then the number of operational rigs has been more or less steady at the 550 level. In the week ending September 30, the number of rigs increased by 4 to 549, bringing them back close to the 550 level.
In the Permian and Texas, the general trend for the number of operational rigs since July has been flat to slightly down. Is this related to the drop in the price of WTI?
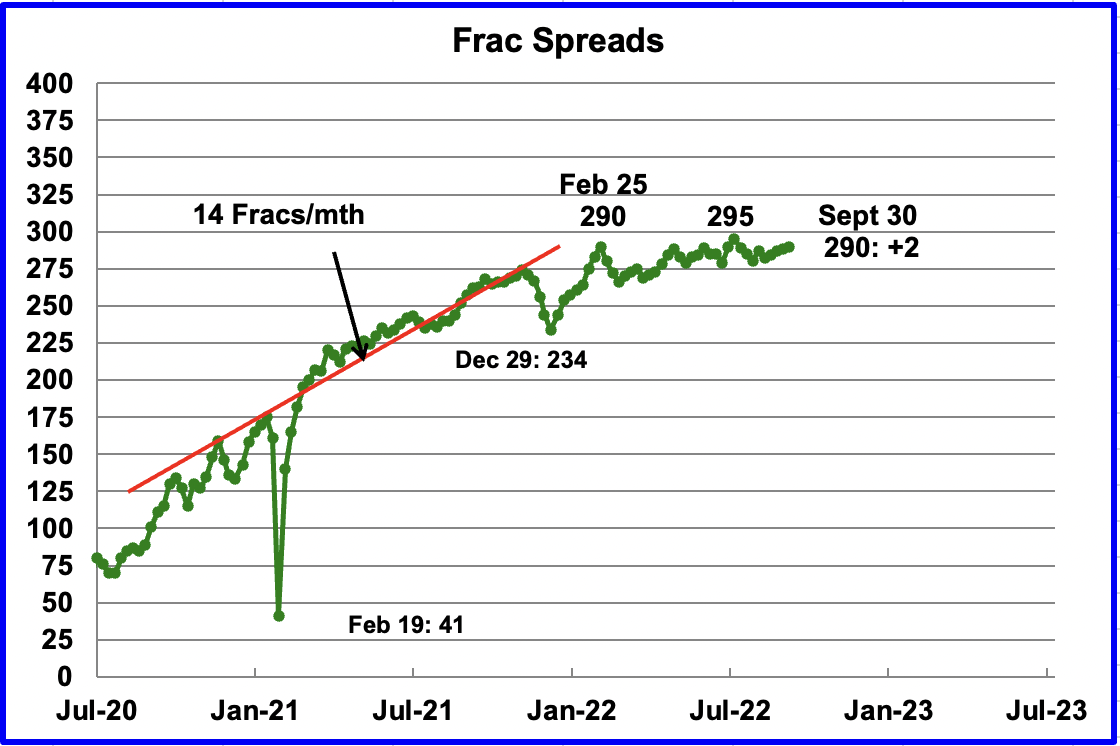
For frac spreads, the general trend since late February can best be described as essentially flat around the 290 level.
Note that these 290 frac spreads include both gas and oil spreads.
September Light Tight Oil Update
The EIA’s LTO database provides information on LTO production from seven tight oil basins and a few smaller ones. The September 2022 report updates tight oil production to August 2022.
The last LTO report was published in May because of operational issues and the EIA took the opportunity to update the information used to produce the LTO. First look at the new September report indicates the updated report is much better and may be more reflective of what is happening in the field.
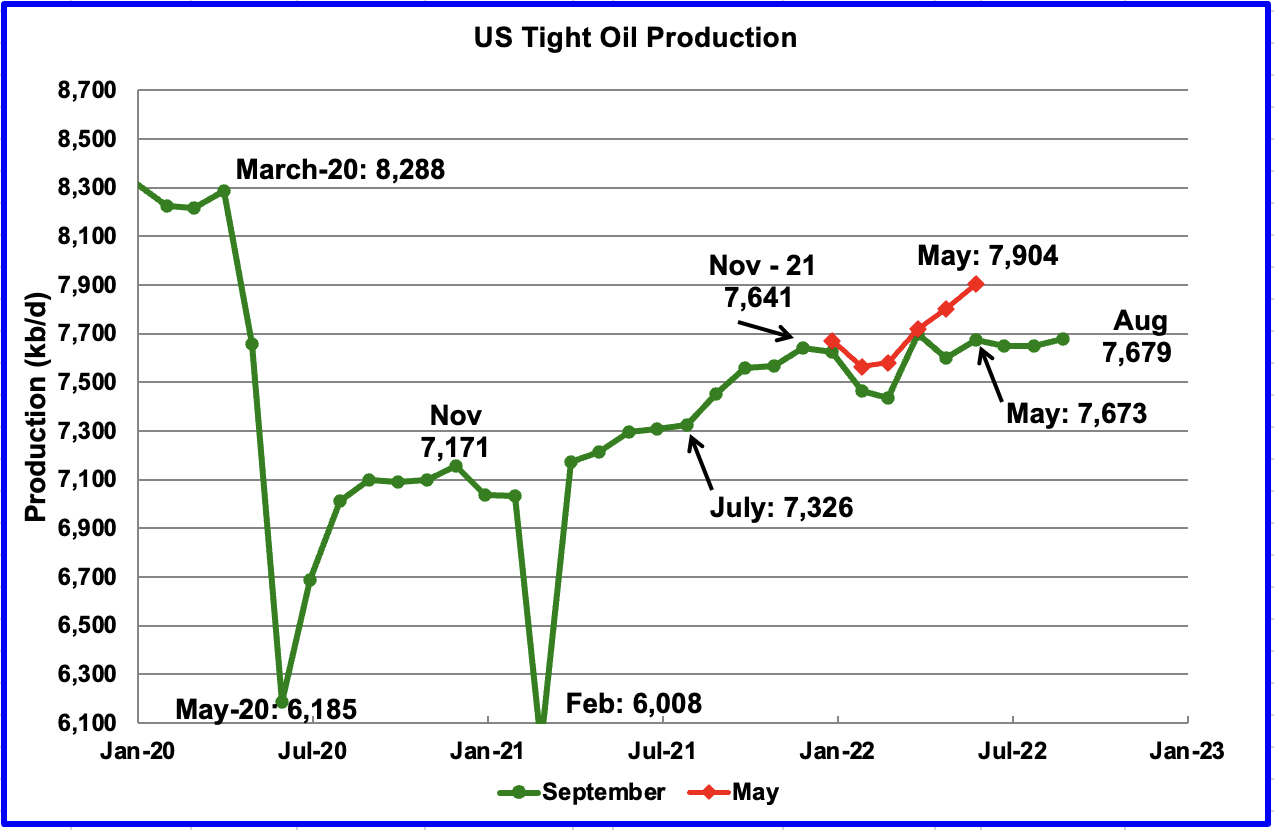
August’s LTO output increased by 28 kb/d to 7,679 kb/d.
The EIA’s September LTO report made significant downward revisions to the production forecast in the May report. The biggest revisions in output occurred for April and May. May output has been reduced by 231 kb/d from 7,804 kb/d to 7,673 kb/d.
More significantly though is that the overall output has shown very little growth from November 2021, 38 kb/d, and no growth since March. This is consistent with the trend shown in the first chart where little growth has occurred since November 2021. The lack of growth is a combination of increasing production in the Permian and decreasing production in the Bakken and Eagle Ford. See below.
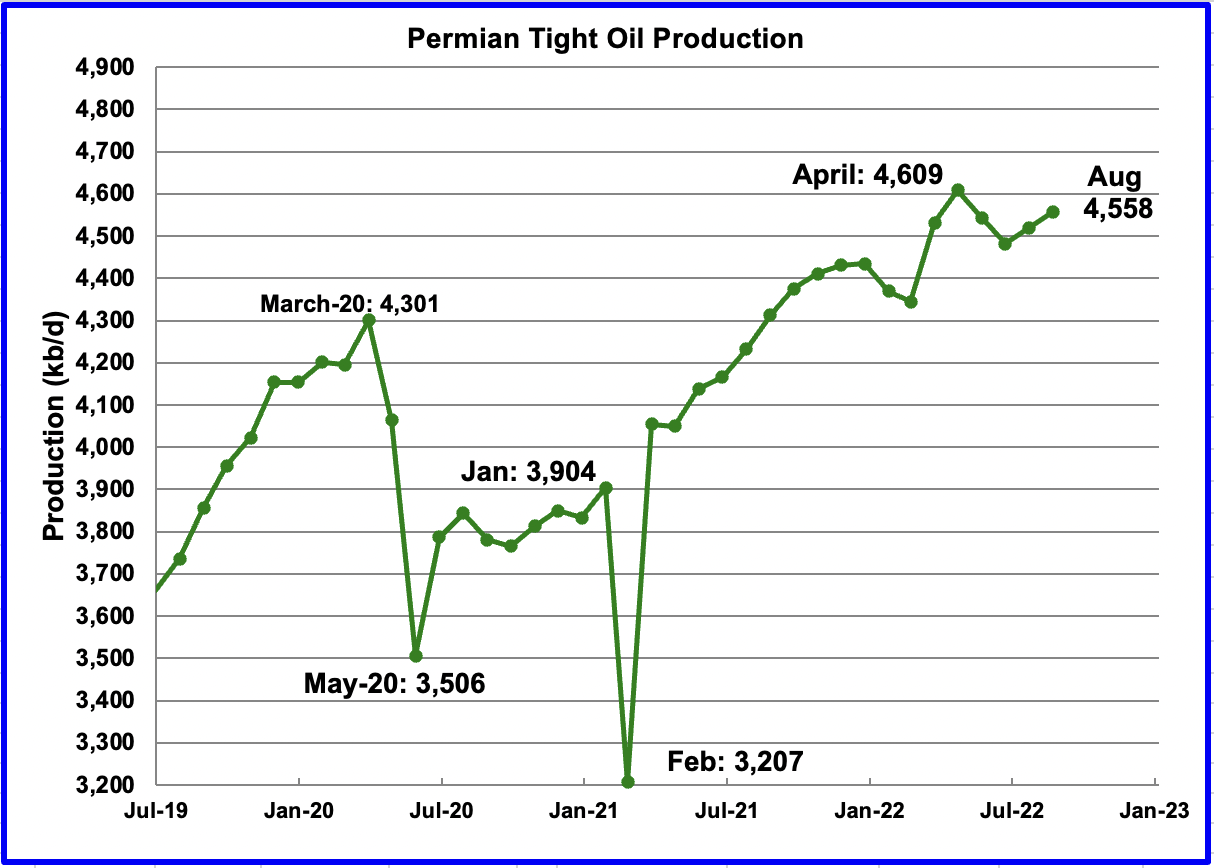
August’s output increased by 38 kb/d to 4,558 kb/d and is 257 kb/d higher than the high of 4,301 kb/d recorded in March 2020. It is not clear why production dropped in May and June.
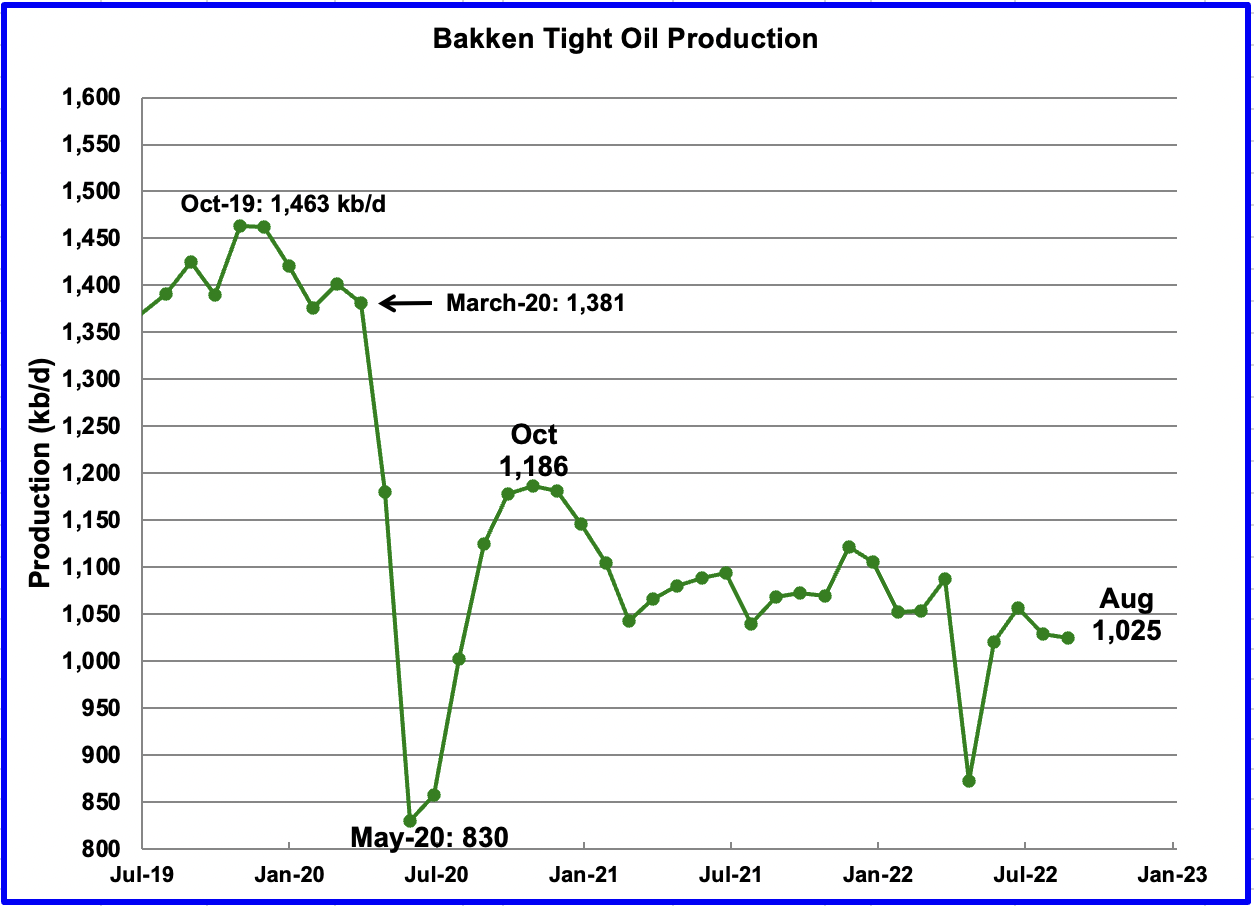
The Bakken’s August LTO output decreased by 4 kb/d to 1,028 kb/d. The output since October 2020 shows the same overall declining trend as in the North Dakota chart above.
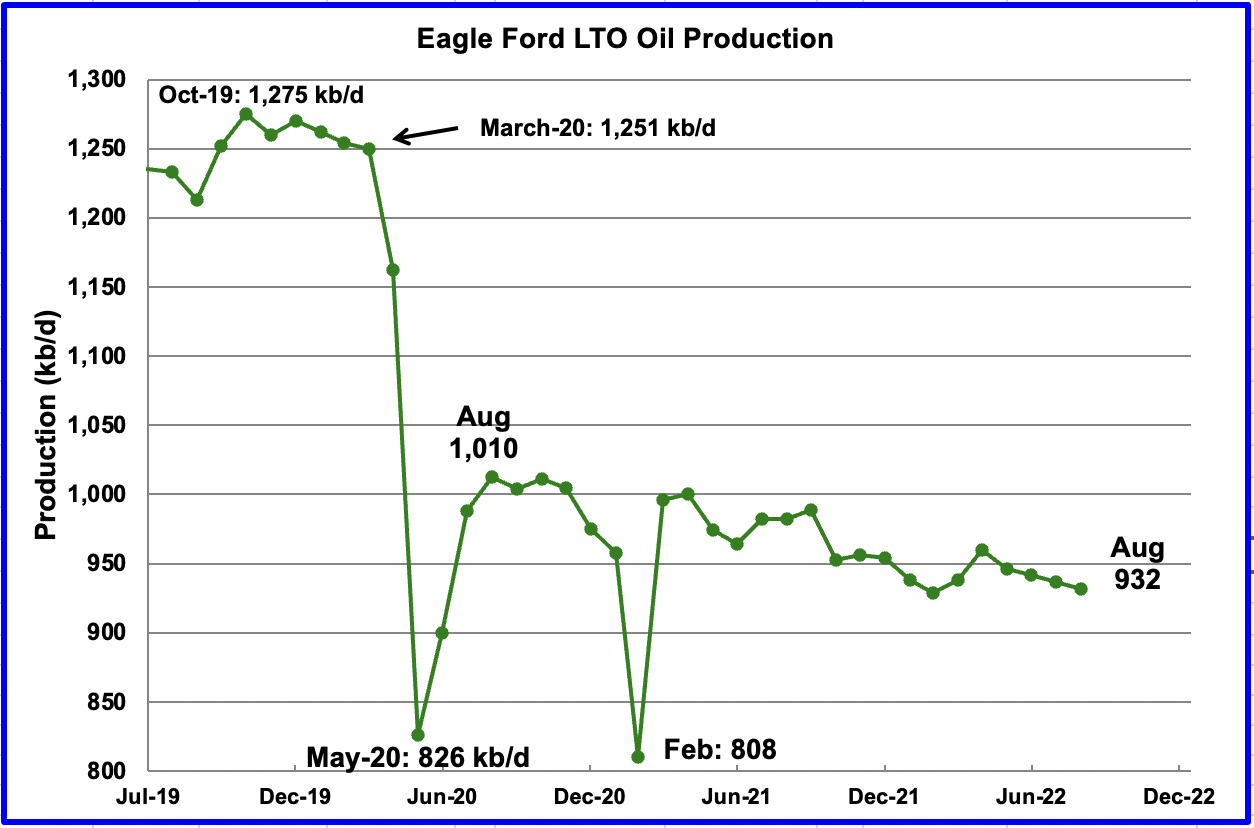
Production in the Eagle Ford basin decreased by 5 kb/d to 932 kb/d in August. Eagle Ford appears to have entered a slow decline phase.
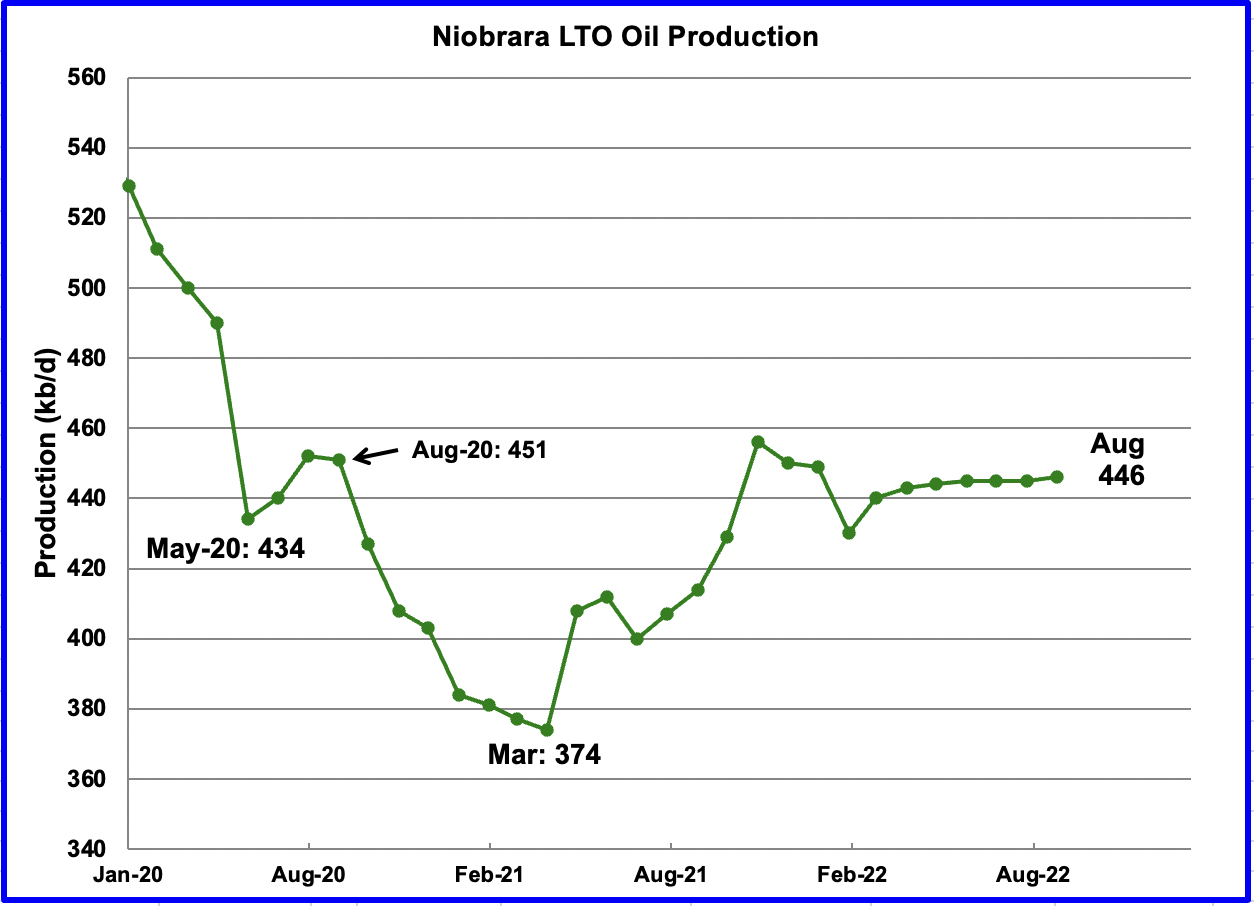
After increasing production from March 2021 to October 2021, output in the Niobrara began to drop in November 2021. Production since April has shown little growth. August’s output increased by 1 kb/d to 446 kb/d.
Production Decline in the Bakken and Eagle Ford
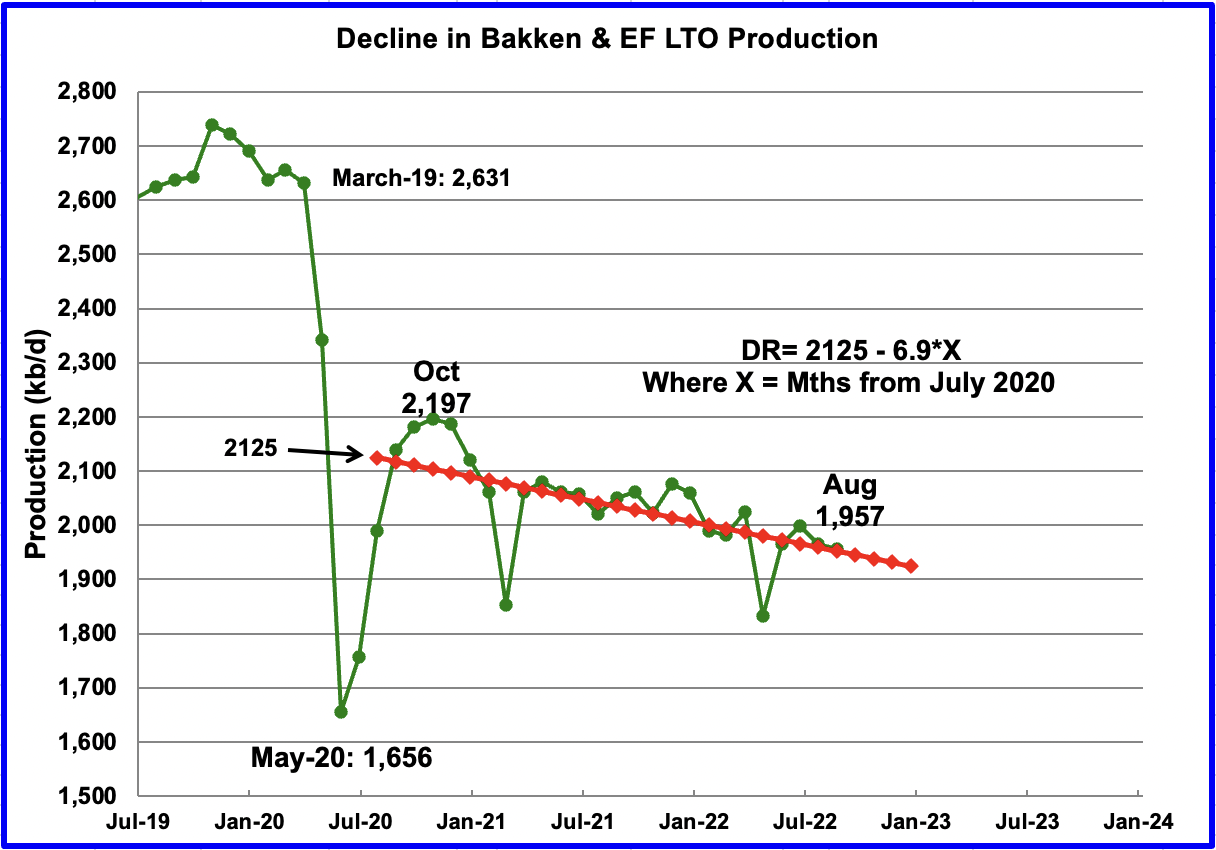
As noted above, monthly production in the Bakken and Eagle Ford basins since October 2020 has been in a slow decline. The decline being addressed here is not the rapid decline associated with LTO wells. Rather it is the decline associated with the lower productivity of new wells, see next chart, along with reduced investment in rigs and frac spreads.
The above chart is the combined output from the Bakken and Eagle Ford basins since they are so similar. Using data from July 2020 to August 2022, the OLS line gives a combined decline rate of 6.9 kb/d/mth.
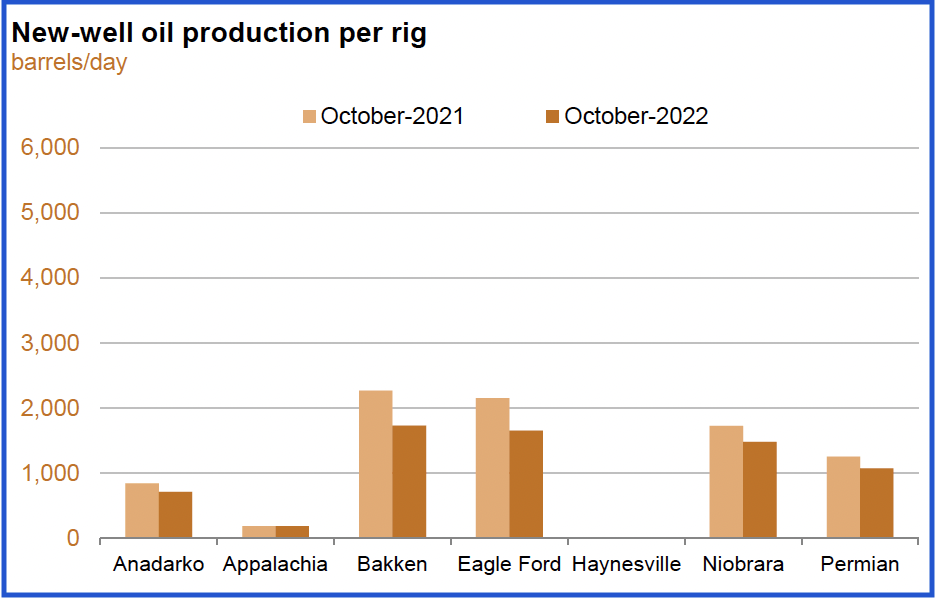
The September DPR report shows YoY decline in new-well oil production per well in the Bakken and Eagle Ford basins.
Onshore L48 Conventional Production
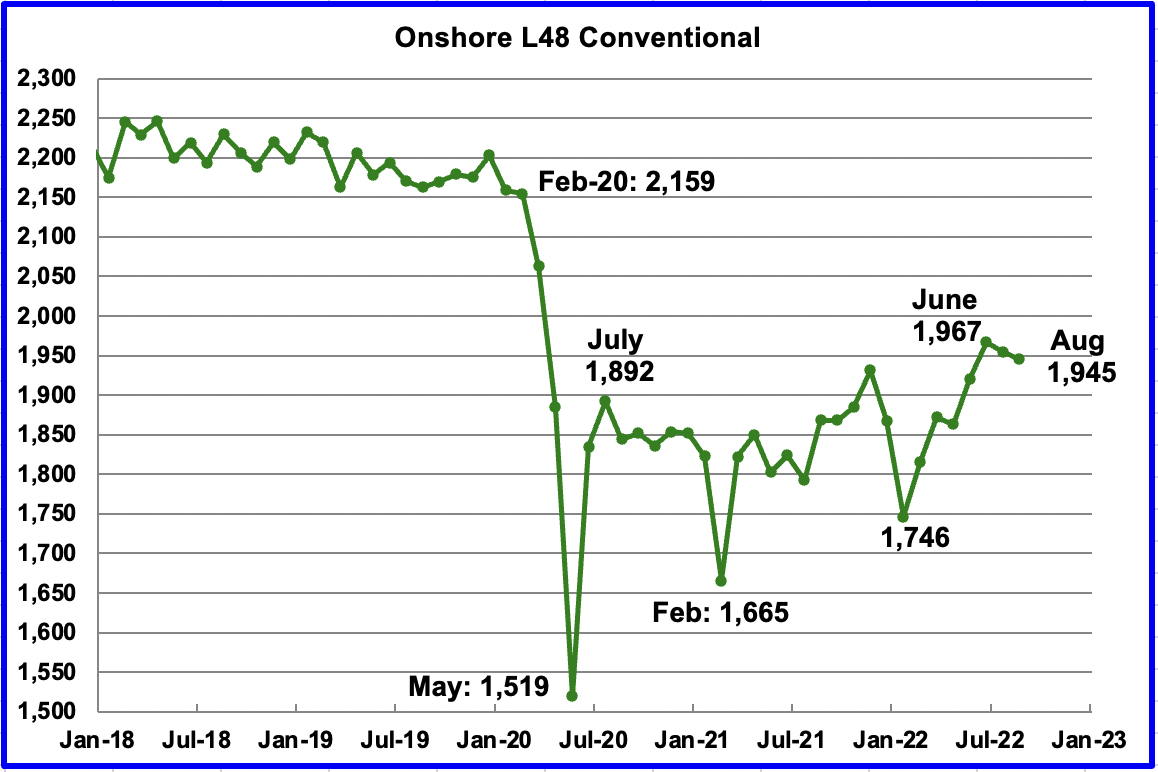
Conventional oil output in the Onshore L48 dropped by 10 kb/d in August to 1,945 kb/d after reaching a new recent high of 1,967 kb/d in June. This estimate is based on a combination of the expected August LTO output and the September 2022 STEO report that has an August 2022 forecast for the US Onshore L48 output. Data from May to July in the STEO has been replaced by the actual EIA production data from the current September report.
A note of caution is in order. This chart is derived by subtracting two large numbers which are subject to revision, particularly the last two months, June and July.
Looking at the Flip Side
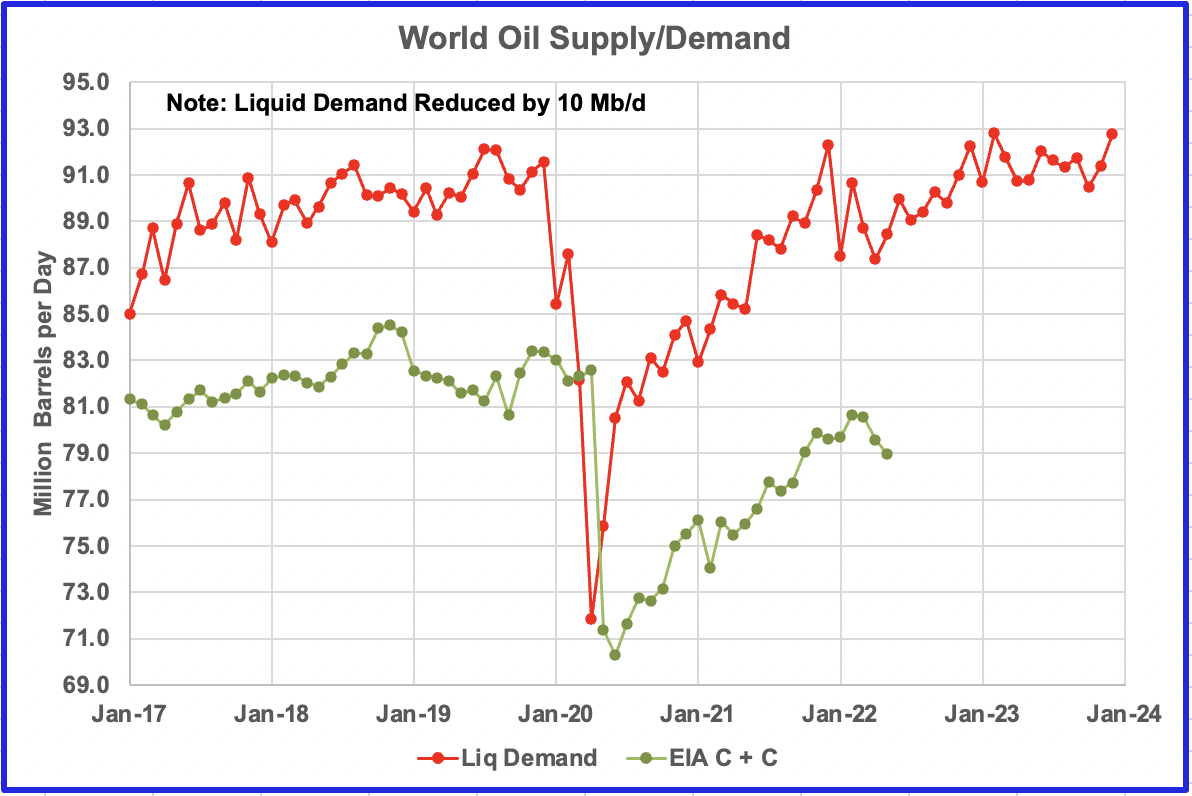
In recent times, many pundits have been addressing the issue of Peak Demand vs Peak Supply with the Peak Demand voices being heard more often. However little evidence is presented to justify the claim that peak demand is in the rear-view mirror. While this site focuses on the supply side, we need not restrict ourselves.
The above chart presents the EIA’s STEO data for All Liquids demand. Initially the All-Liquids supply data was added to the chart but it was difficult to discern much from it as the lines kept crossing. As a second thought, the EIA C + C data was added. This provided a clearer chart that better showed the trend between supply and demand. To bring the two graphs closer together, 10 Mb/d was arbitrarily removed from the EIA All Liquids demand data.
The average demand for All Liquids (reduced version) from January 2017 to December 2019 was 89.75 Mb/d. The average demand for C + C was 82.13 Mb/d. The difference being 7.62 Mb/d.
On the other side of the pandemic, the oil market has not yet achieved a stable equilibrium due to the impacts of the Ukrainian war. However just looking at the first five months of 2022, average demand for All Liquids is 88.88 Mb/d. Note that demand continues to build from the low of March to year end. From the low of March to year end, demand increases by 5 Mb/d. The average supply of C + C over the first 5 months is 79.89 Mb/d, for a difference of 8.99 Mb/d. The increase in the difference between demand and supply is partially being offset by the SPR release of 1.0 Mb/d.
There are a few things to notice in the above chart. Peak demand occurred in July 2019 while peak production occurred in November 2018. Peak demand will exceed the November 2019 peak again in December 2022 and February 2023, based on the STEO demand forecast. To assess whether the world is approaching a second lower production peak, demand needs to exceed the November 2019 peak for a sustained period in the first half of 2023 so that the supply side can be stressed.
If the supply side is not stressed in 2023 to the point that prices rise, that could be an indication the peak demand pundits may be correct and that Ron will be vindicated in saying Peak Oil is in the rear-view mirror.
Editor’s Note: The summary bullets for this article were chosen by Seeking Alpha editors.
Be the first to comment