

bluebay2014
Introduction
Global low-cost broker Interactive Brokers (NASDAQ:NASDAQ:IBKR) is well-placed to embark on its journey to 80 million user accounts, which would mean winning the business of 1% of the global population. The company is firing on all three key drivers of growth; the number of accounts, trading frequency, and per-trade commissions. I think a combination of these factors will lead to a PE multiple re-rating for the stock. My conservative estimates imply an 18.7% upside. There is a harmonious agreement between these fundamentals and relatively bullish technical price and volume action as well.
Business Brief
Interactive Brokers Awards (Interactive Brokers 2Q FY22 Presentation)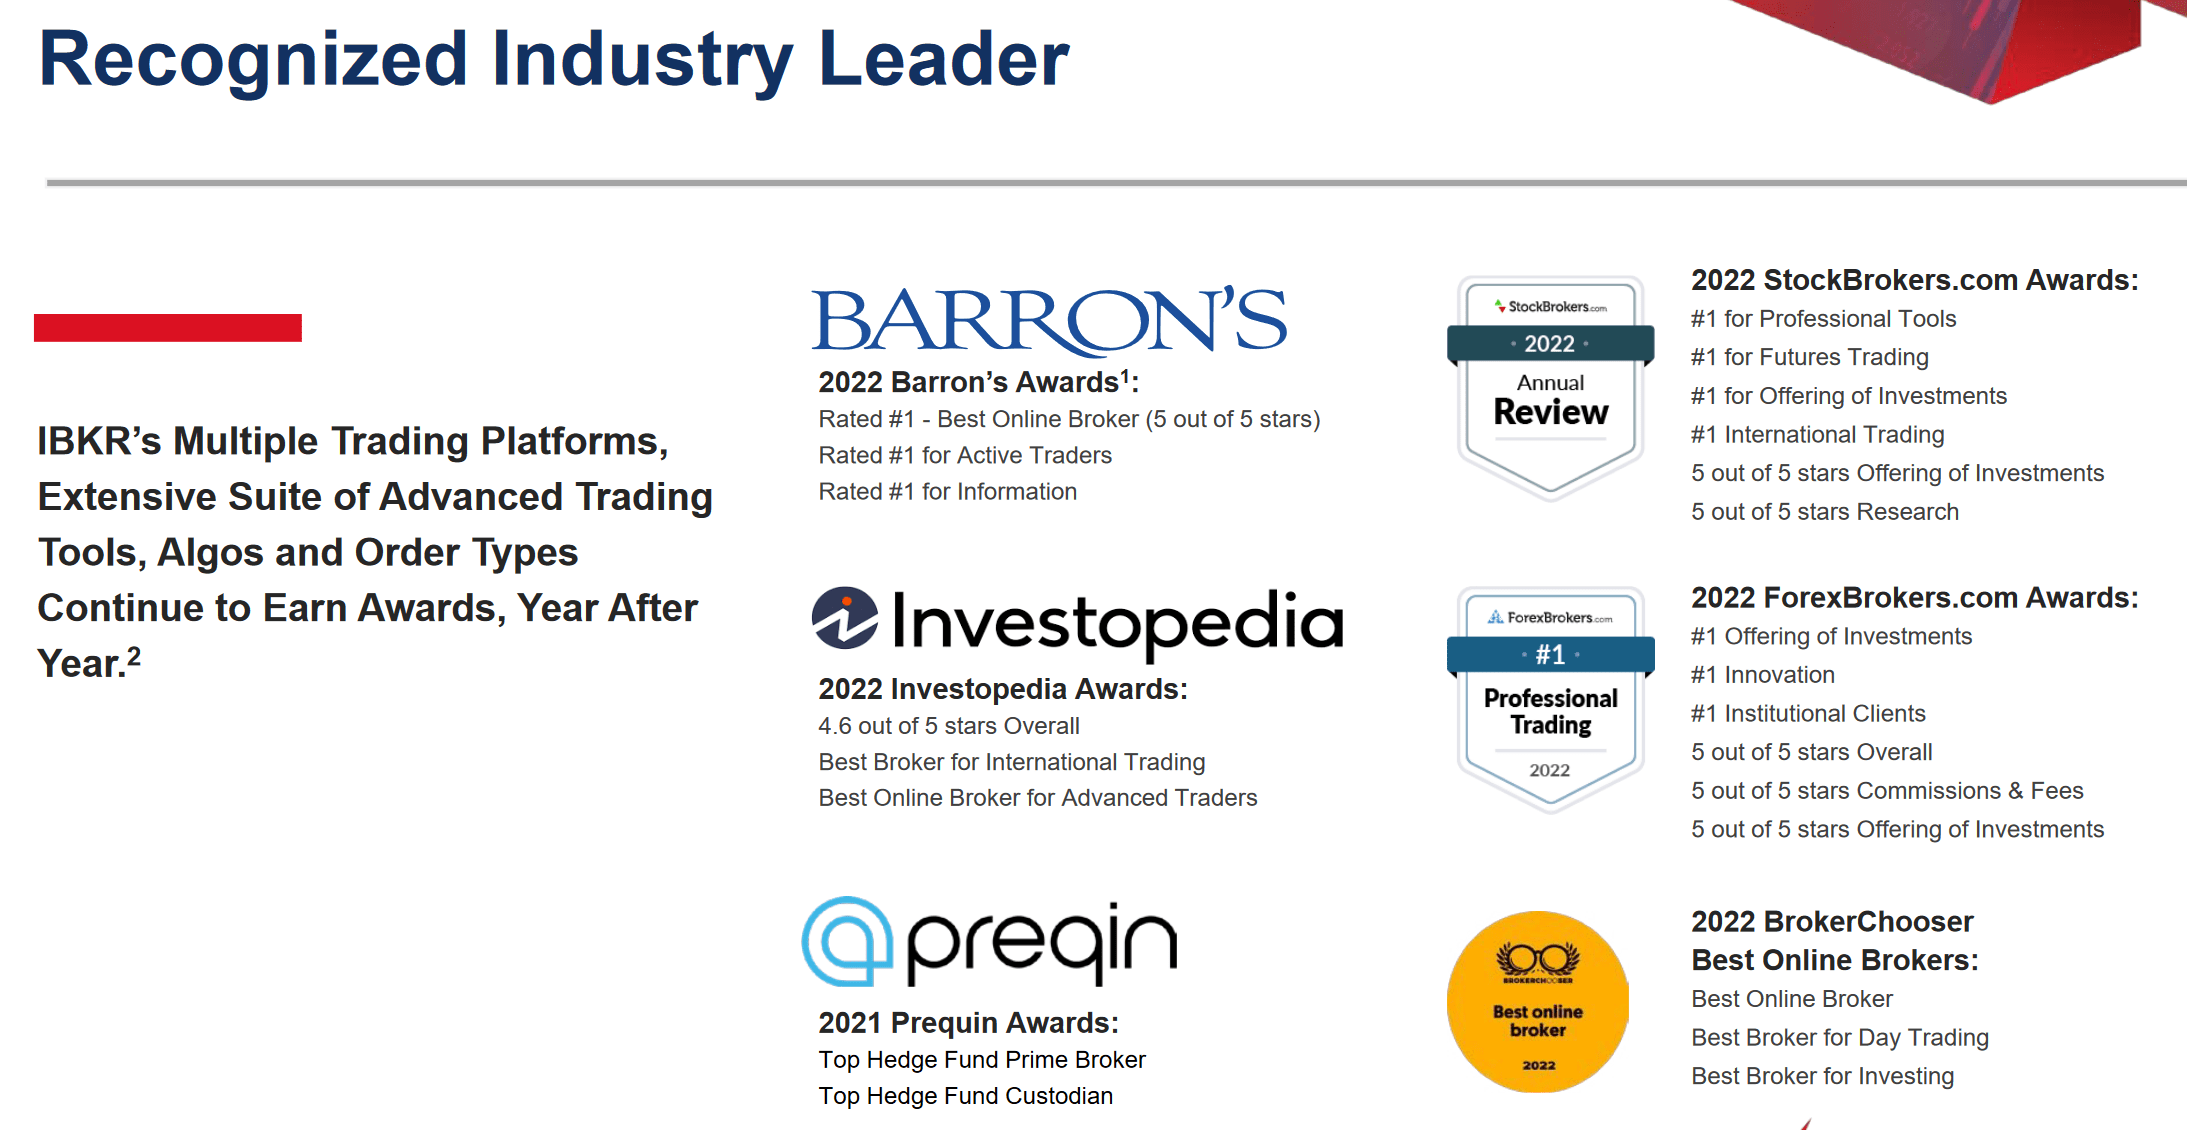
Interactive Brokers is a global broker that offers a wide range of financial market instruments for trading and investing at the lowest rates in the industry. Its breadth, depth, and low-cost nature of offerings are enabled by its superior automation technology leadership position relative to peers. The company services all kinds of clients from individuals, proprietary trading groups, hedge funds, financial advisors, and introducing brokers. In 2022, many independent parties consistently rated Interactive Brokers as the top broker across a diverse set of parameters.
I am also a customer of them; I use Interactive Brokers because no other broker offers low-cost and reliable execution coupled with the global market access I require for my investing and trading activities. From my experience, Interactive Brokers is one of the few ways for a retail investor or trader can use the full suite of tools specifically designed for the professionals in the markets.
The founder and chairman of the company, Thomas Pechy Peterffy has an ambitious goal to have long-term account growth of 30% annually to reach 80 million users, which corresponds to about 1% penetration of the global population. With almost 2 million client accounts as of August 2022’s end, the company’s growth going forward would be focused on the addition and subsequent mining of retail accounts in particular.
Why I am bullish on Interactive Brokers
There are three key levers that drive Interactive Brokers’ operating revenues growth:
- Number of accounts
- Trade frequency
- Commission per trade
My bullish view on Interactive Brokers is based on three expectations that incidentally relate to each of these three levers:
- Strong retail account growth will unlock long-term account mining potential
- Inflation and volatility will help increase trading frequency
- Increasing futures and options mix will improve per-trade commissions
Let’s explore each of these three hypotheses further now:
Strong retail account growth will unlock long-term account mining potential
Interactive Brokers’ new account growth over the last two years has been very strong, with the latest September 2022 print showing 31% YoY growth:
Total Accounts YoY Growth (Interactive Brokers, Own Analysis)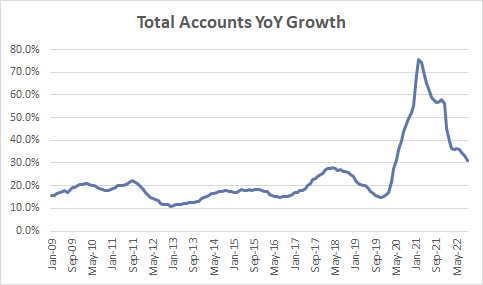
The overall accounts growth mix has been increasing towards individual accounts. From Q3 FY19 till Q2 FY22, the retail accounts mix has improved from 49% to 66%:
Accounts Mix (Interactive Brokers, Own Analysis)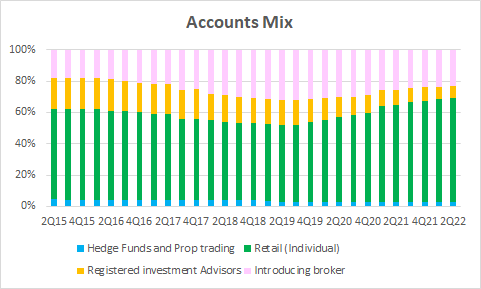
On average, retail accounts only contribute 17.7% of the commissions that hedge fund and prop trading accounts generate. Yet, the under-penetration story for retail accounts makes them worthy of focus in the company’s growth strategy. In Peterffy’s own words in a September 2022 company conference presentation held by Barclays:
I think that in the long run, our return from that investment [into retail trading accounts growth] is going to be even higher than it is from catering to the sophisticated part of the investor group.
Importantly, the numbers align with this hypothesis so far. Retail accounts are growing at more than 40% YoY:
Retail Accounts Growth (Interactive Brokers, Own Analysis)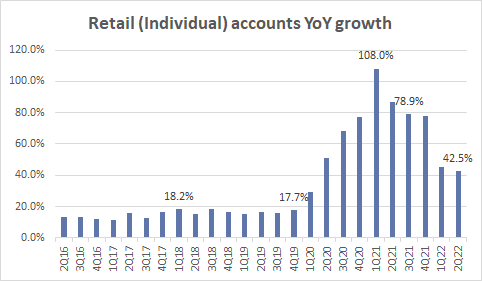
Hedge fund and prop trading accounts are also registering healthy growth rates of more than 35% YoY:
Hedge Fund and Prop Trading Account Growth (Interactive Brokers, Own Analysis)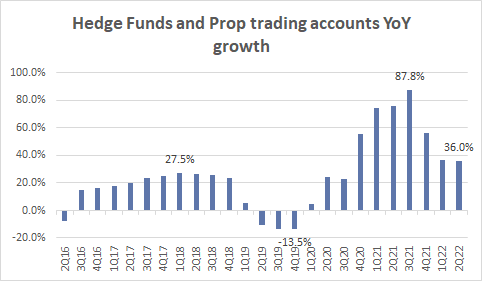
Yet, the commission mix of individual accounts has been increasing gradually from 50% in 4Q FY19 to 55% in 2Q FY22:
Commission Mix (Interactive Brokers, Own Analysis)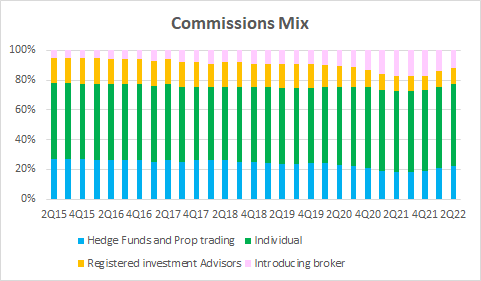
This suggests that the focus on retail accounts has still been highly accretive to overall commission revenue growth due to higher volumes, validating the company’s strategy. Going forward, following the expansion efforts in retail accounts, I expect initiatives such as improving retail investor education to provide ample account mining potential to further boost commission revenues.
Inflation and volatility will help increase trading frequency
Interactive Brokers’ clients trading frequency is positively correlated with the volatility in the markets. Notice how spikes in the VIX correspond to increased trades per account:
Trades Frequency vs VIX (Interactive Brokers, Yahoo Finance, Own Analysis)
Interactive Brokers’ Director of Investor Relations, Nancy Enslein Stuebe, also confirmed that commissions revenue depends on the average volatility in the markets in a Q4 FY19 earnings call:
…average volatility [has] a big effect on how much our clients trade…
History shows us that periods of high inflation correspond with higher volatility:
1970s inflation and volatility (TradingView, Own Analysis)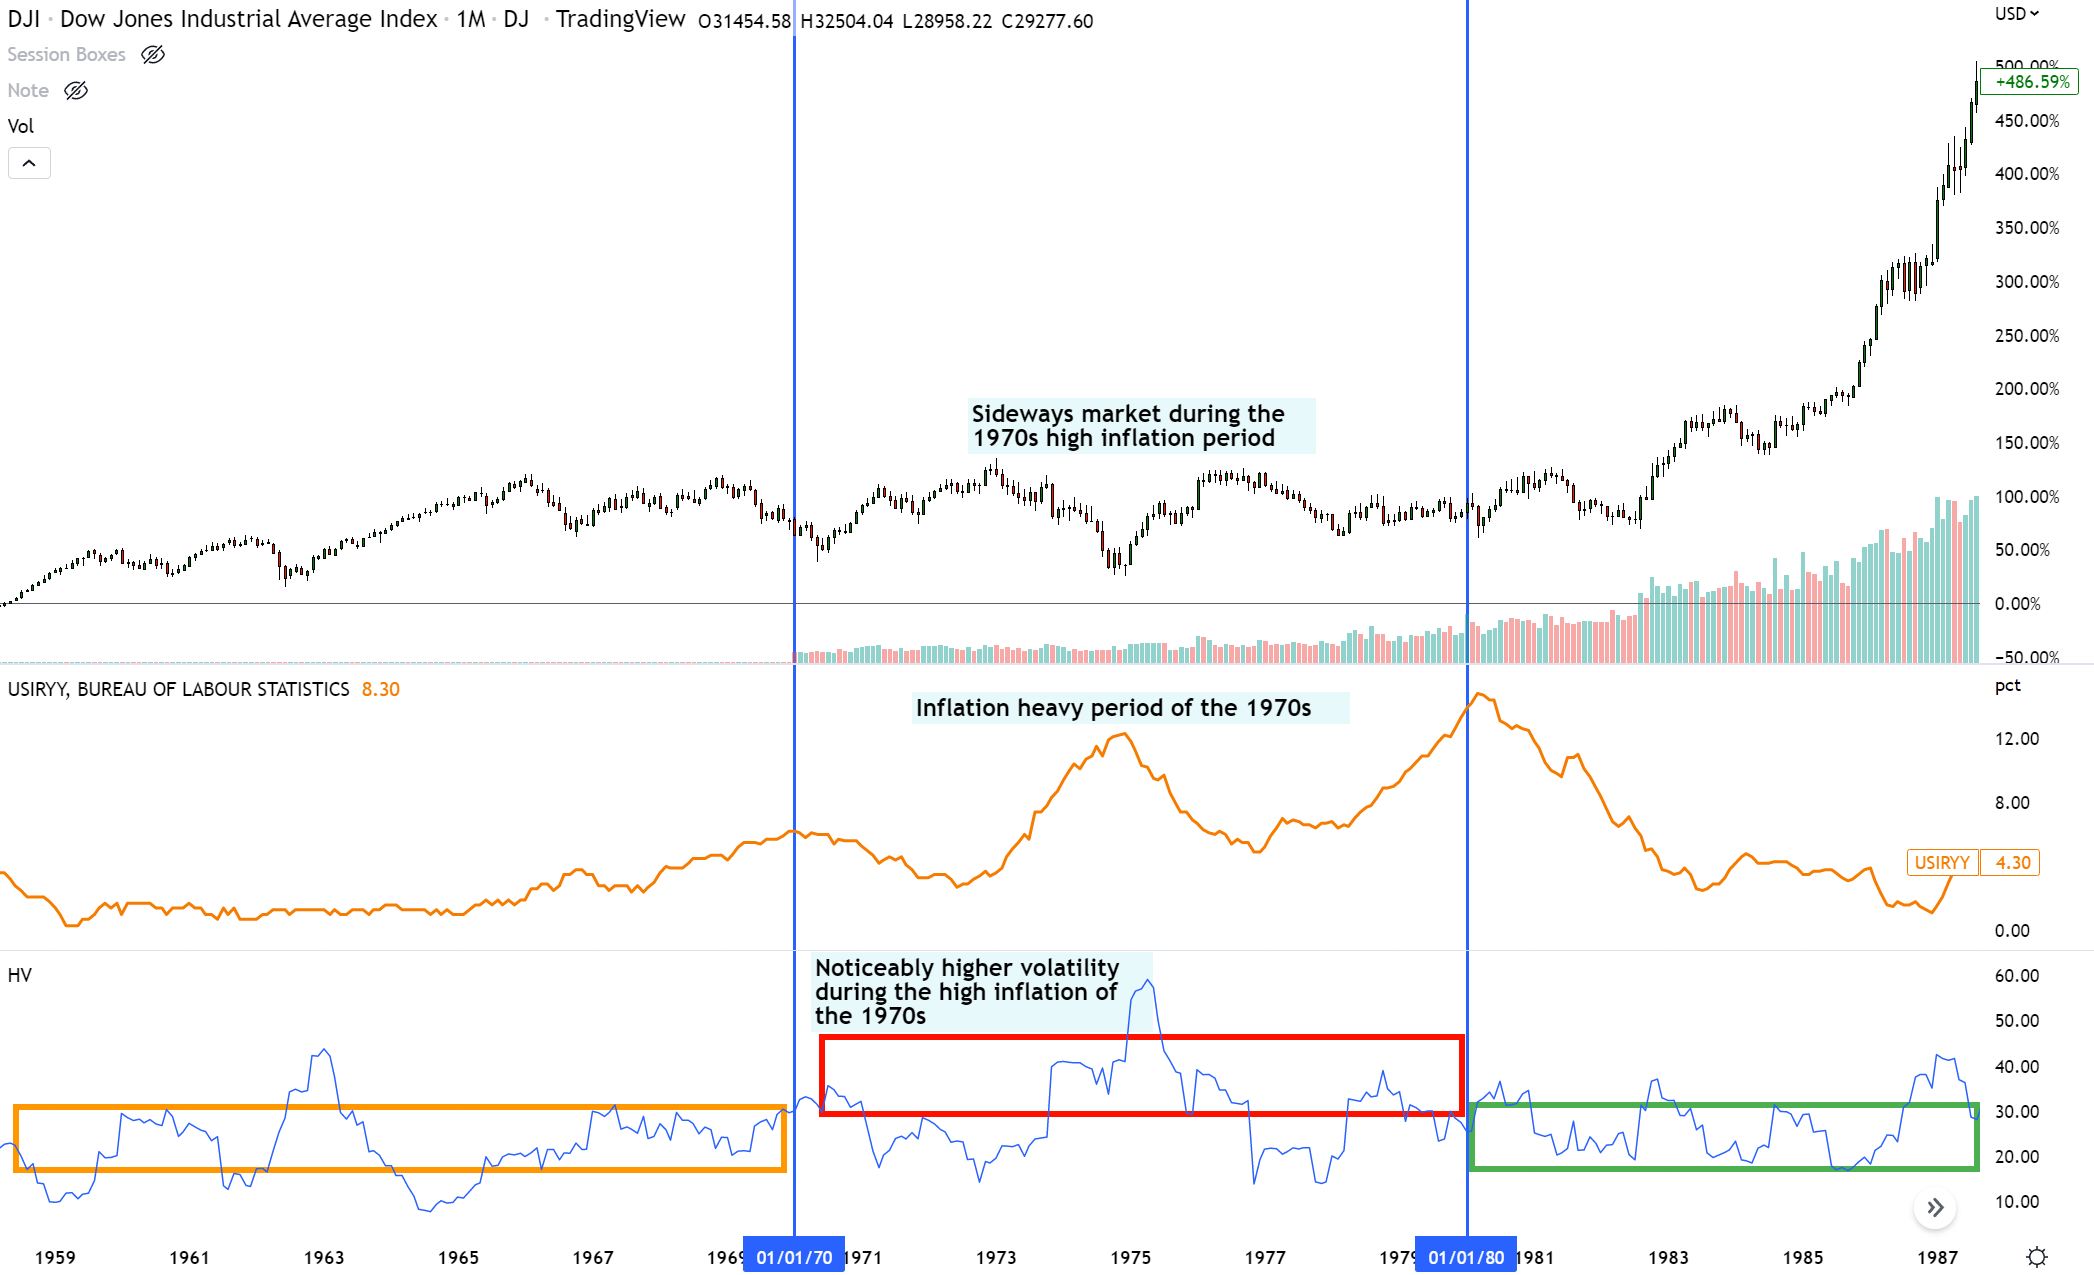
In the image above, the orange time series in the middle depicts the high inflation in the US during the 1970s. The chart in the bottom pane shows historical volatility. Clearly, historical volatility was noticeably higher during the high inflation period of the 1970s, when the Dow Jones Index (DJI) went sideways.
Today, with annual inflation in the US at 8.3%:
US inflation (Trading Economics, US Bureau of Statistics)
And annual inflation in the Euro area at 10%:
Euro Area Inflation (Trading Economics, Eurostat)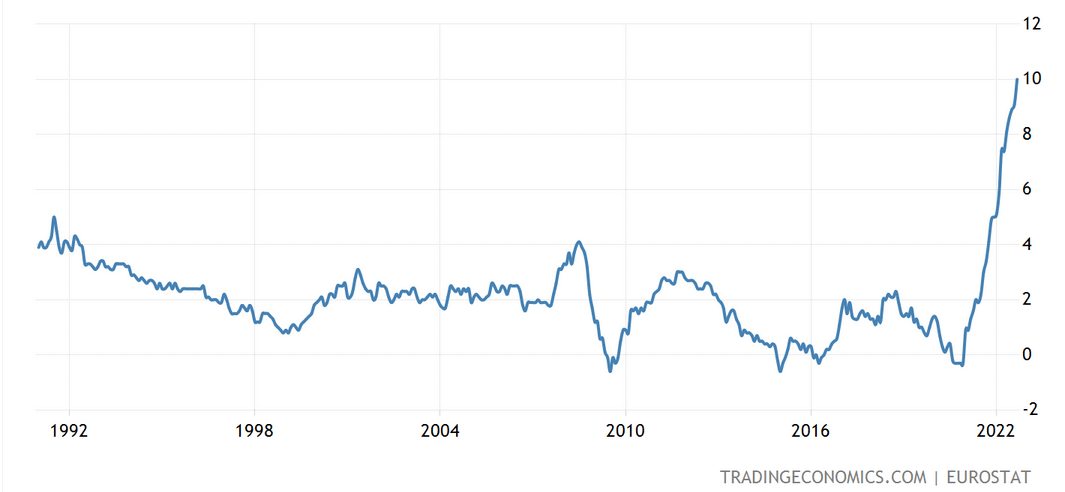
The VIX (VIX) stands at elevated levels; the last 4 quarters’ average VIX is up 43% from 15.91 before 2020 to 22.78 now:
VIX (TradingView, Own Analysis)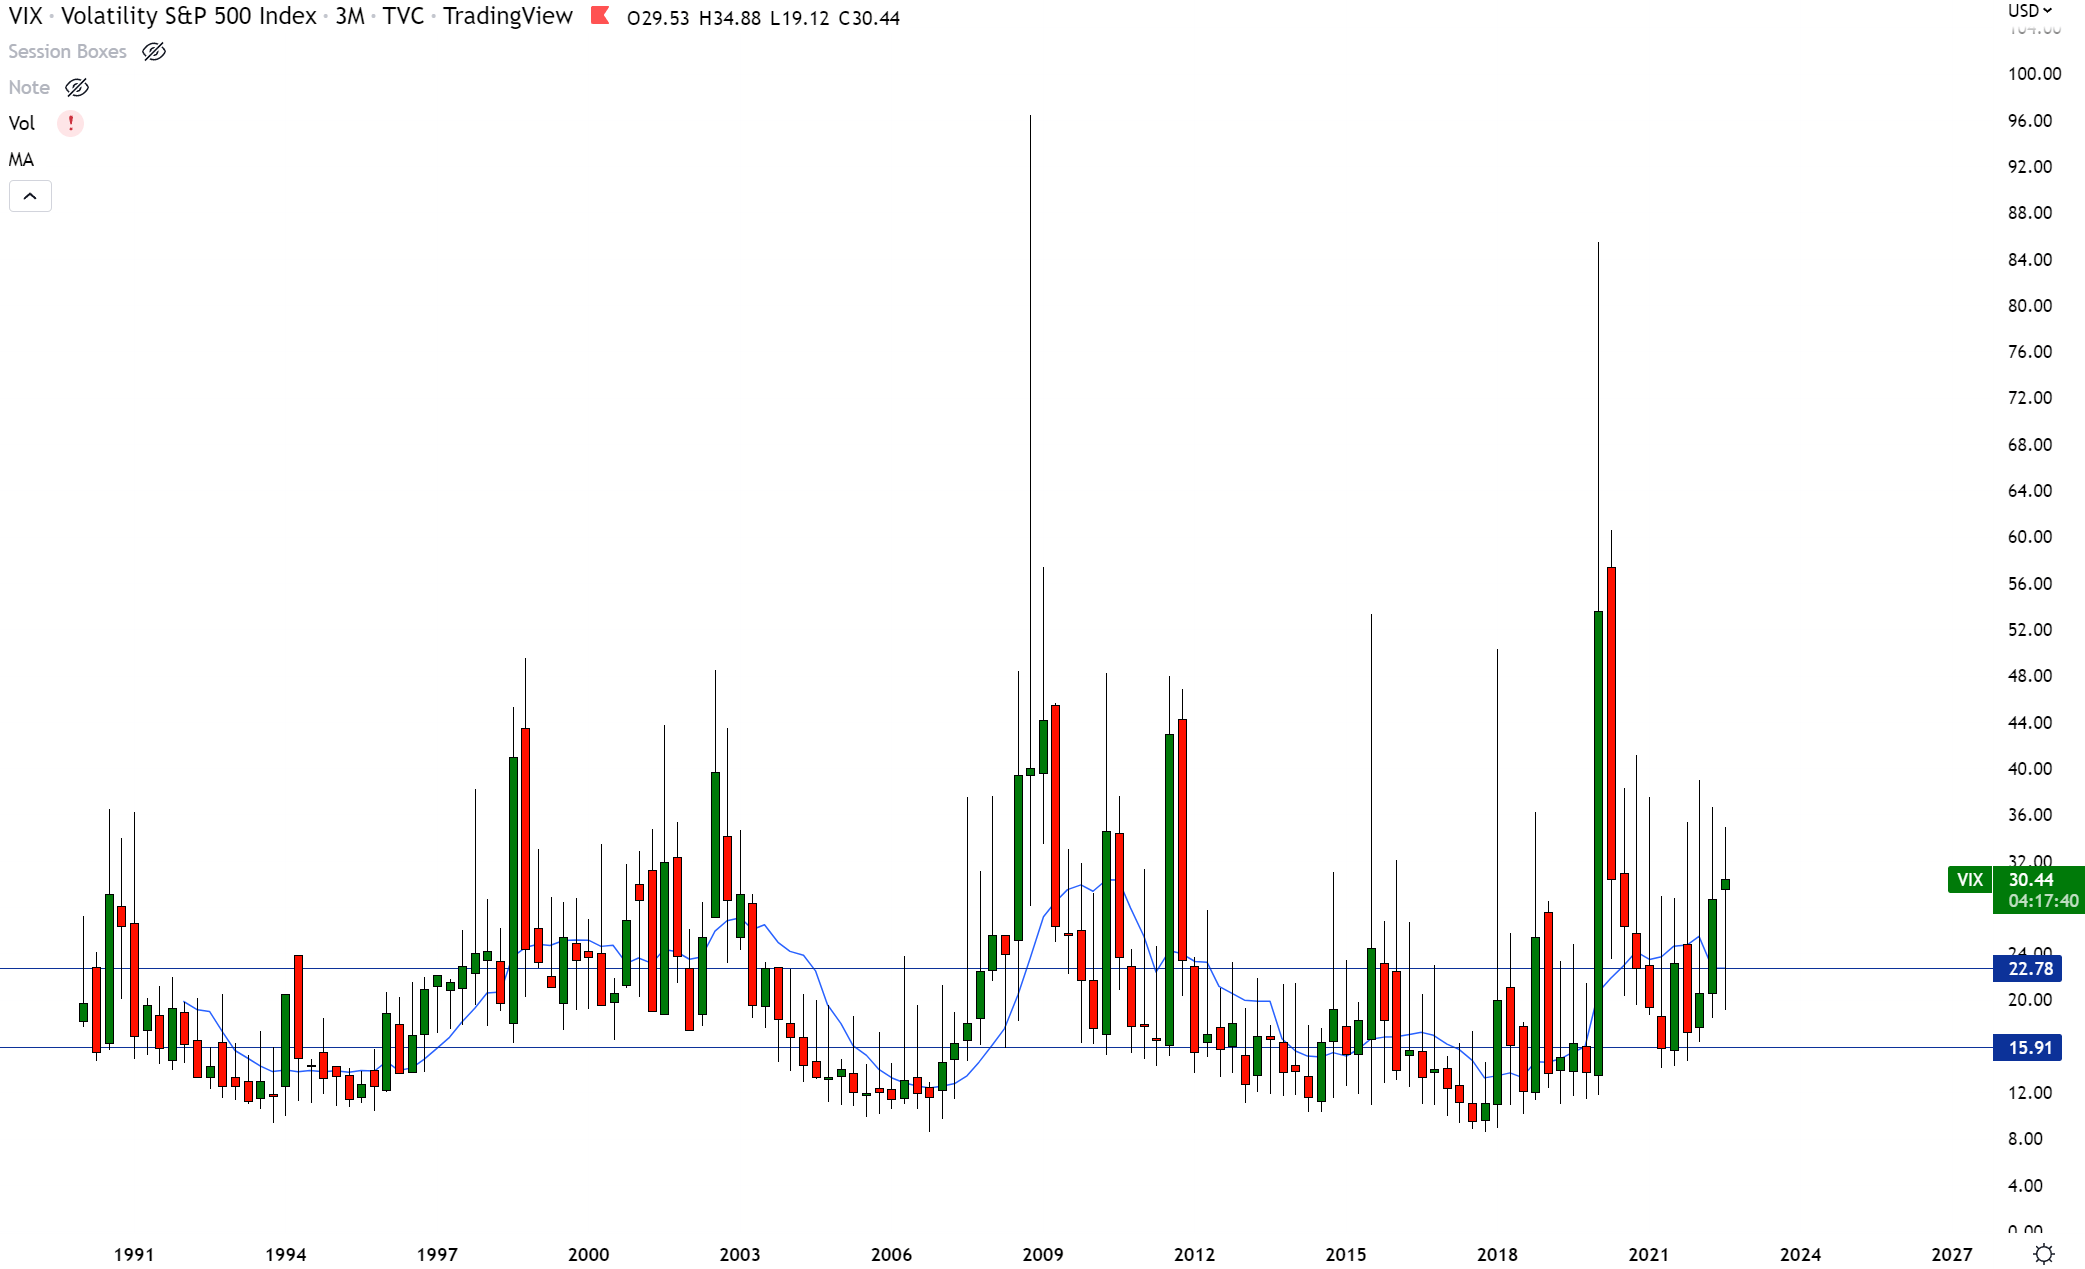
Thus, I anticipate the current inflation-themed environment to continue leading to more volatile markets and more active trade activity, benefiting Interactive Brokers’ commission revenue prospects.
Increasing futures and options mix will improve per-trade commissions
Interactive Brokers makes 120% and 88% more commissions in an options contract and futures contract trade respectively than in a stock share trade. Here is the latest data based on the company’s September 2022 metrics:
Commissions per Trade by Instrument Type (Interactive Brokers, Own Analysis)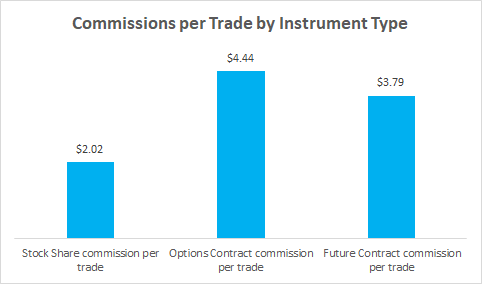
The proportion of futures and options trades has been increasing since February 2021. The latest September 2022 print saw a modest increase in this figure to almost 47% from the prior month’s 42%:
Futures and Options Trade Mix (Interactive Brokers, Own Analysis)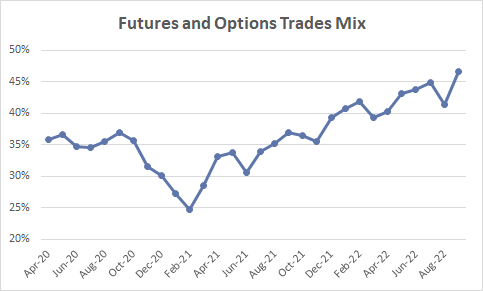
In a June 2022 company conference held by Piper Sandler, Peterffy attributed this increase in derivative trades’ mix to improved investor education, especially from the efforts of competitors such as Robinhood:
Robinhood’s role in derivatives popularization (Interactive Brokers June 2022 Company Conference Transcript, Capital IQ)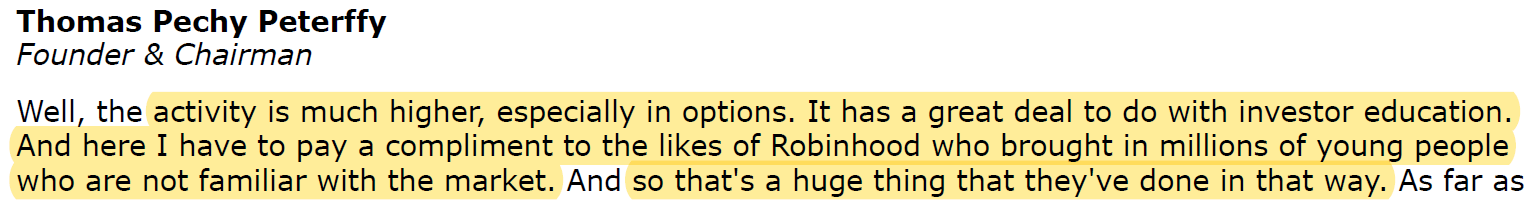
By growing faster than the industry in derivative product categories, Interactive Brokers has successfully capitalized on opportunities to increase its market share. As the company’s Director of Investor Relations Stuebe notes in the company’s Q2 FY22 earnings call:
Gain in derivatives market share (Interactive Brokers Q2 FY22 Earnings Transcript)
Overall, these effects have helped bolster a very strong growth in average commission per trade:
Average Commission per Trade YoY Growth (Interactive Brokers, Own Analysis)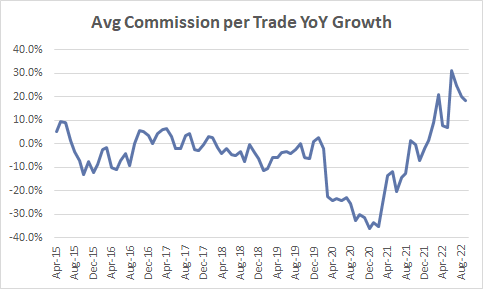
I think the derivative products growth trend will continue to sustain, boosting Interactive Brokers’ per trade commissions mix further. Management thinks similarly; in a September 2022 company conference presentation, Peterffy noted that:
…it looks to me like that [options and futures trade volumes] is going to continue to increase because it’s very, very exciting.
Valuation
Interactive Brokers is currently trading at a PE of 25.1x. This is slightly above its 4-year average PE of 23.6x:
Interactive Brokers PE (Capital IQ)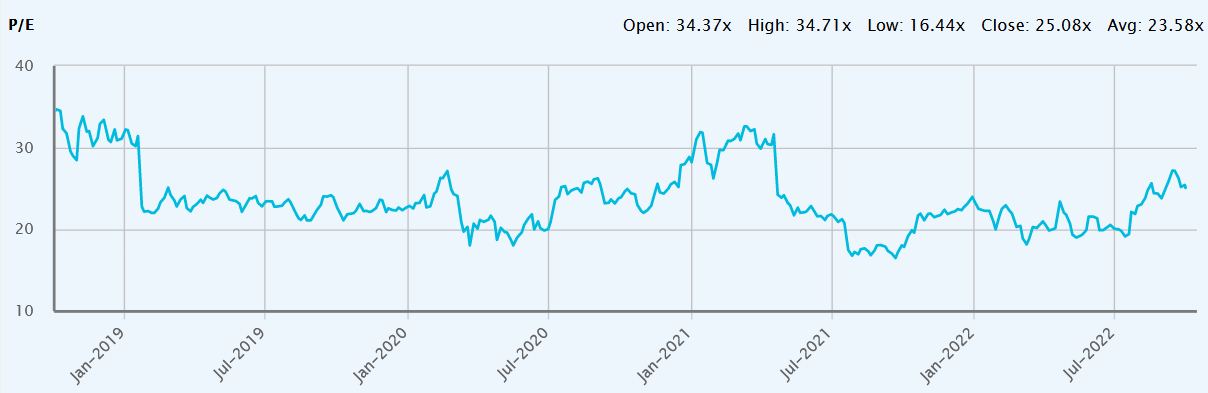
Given the bullish drivers and momentum on all three key aspects of revenues; the number of accounts, trade frequency, and per-trade commissions, I believe the stock is due to re-rate higher on the back of continued strong execution.
The FY22 consensus EPS estimate is $3.69. Assuming a 25% discount on this for conservatism and assuming a conservative 10% re-rating to a PE multiple of 27.6x, the implied fair value share price comes out to be $76.38. This corresponds to an 18.7% upside from the current share price of $64.36.
Technical Analysis
IBKR Technical Analysis (Trading View, Own Analysis)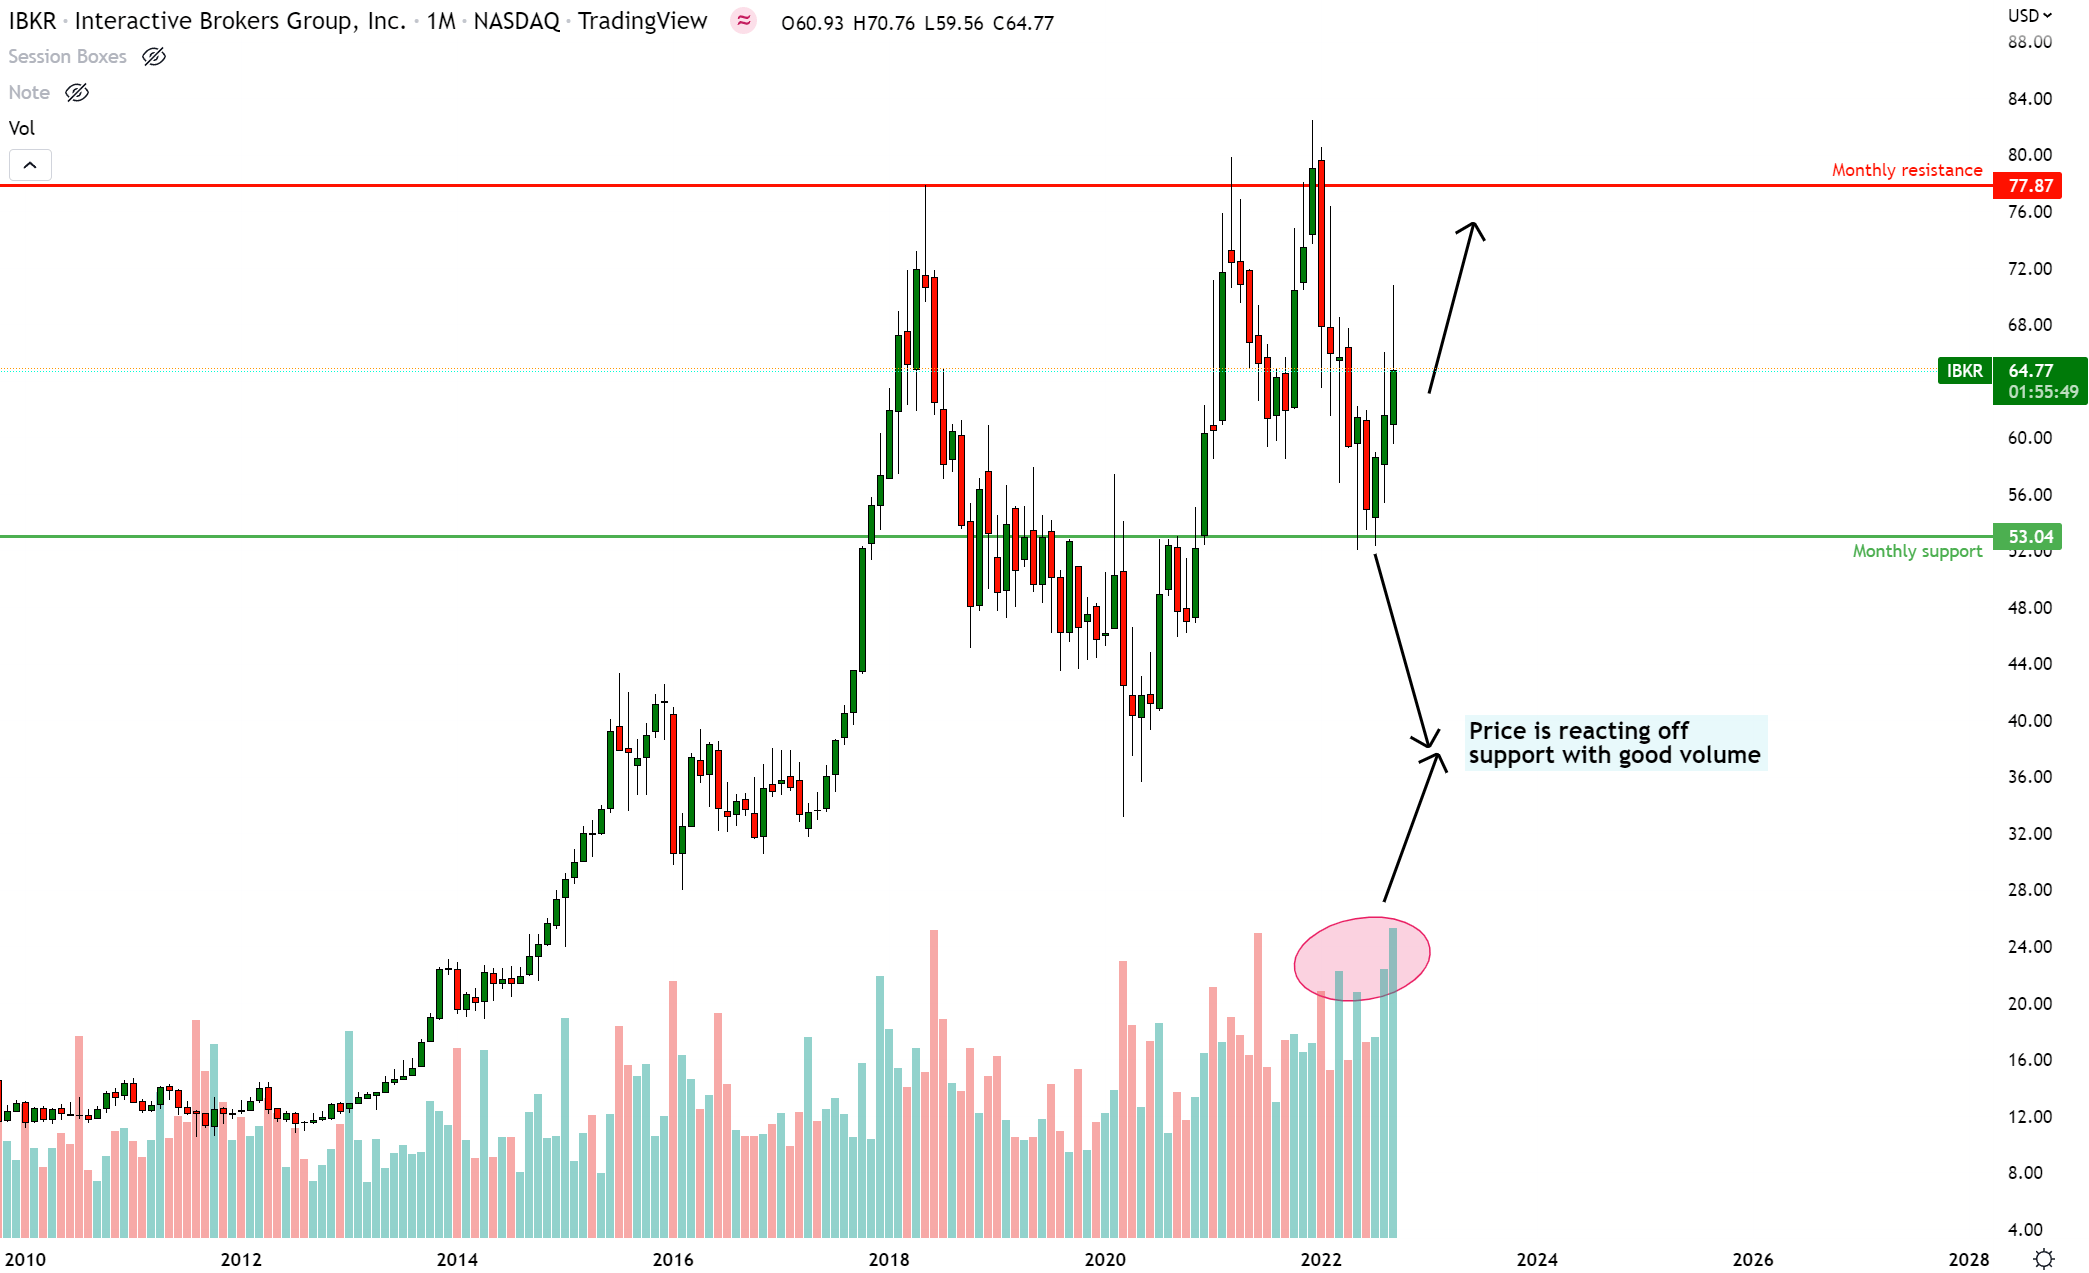
Interactive Brokers is reacting off monthly support at $53.04 with an increased volume print, thus validating the reliability of the support zone. It is headed towards monthly resistance at $77.87.
Since I am ‘Hunting Alpha’, I care more about relative outperformance over my opportunity cost (S&P 500) than absolute outperformance. Hence, I place a bit more importance on the relative chart of IBKR/S&P 500.
IBKR vs S&P500 Technical Analysis (TradingView, Own Analysis)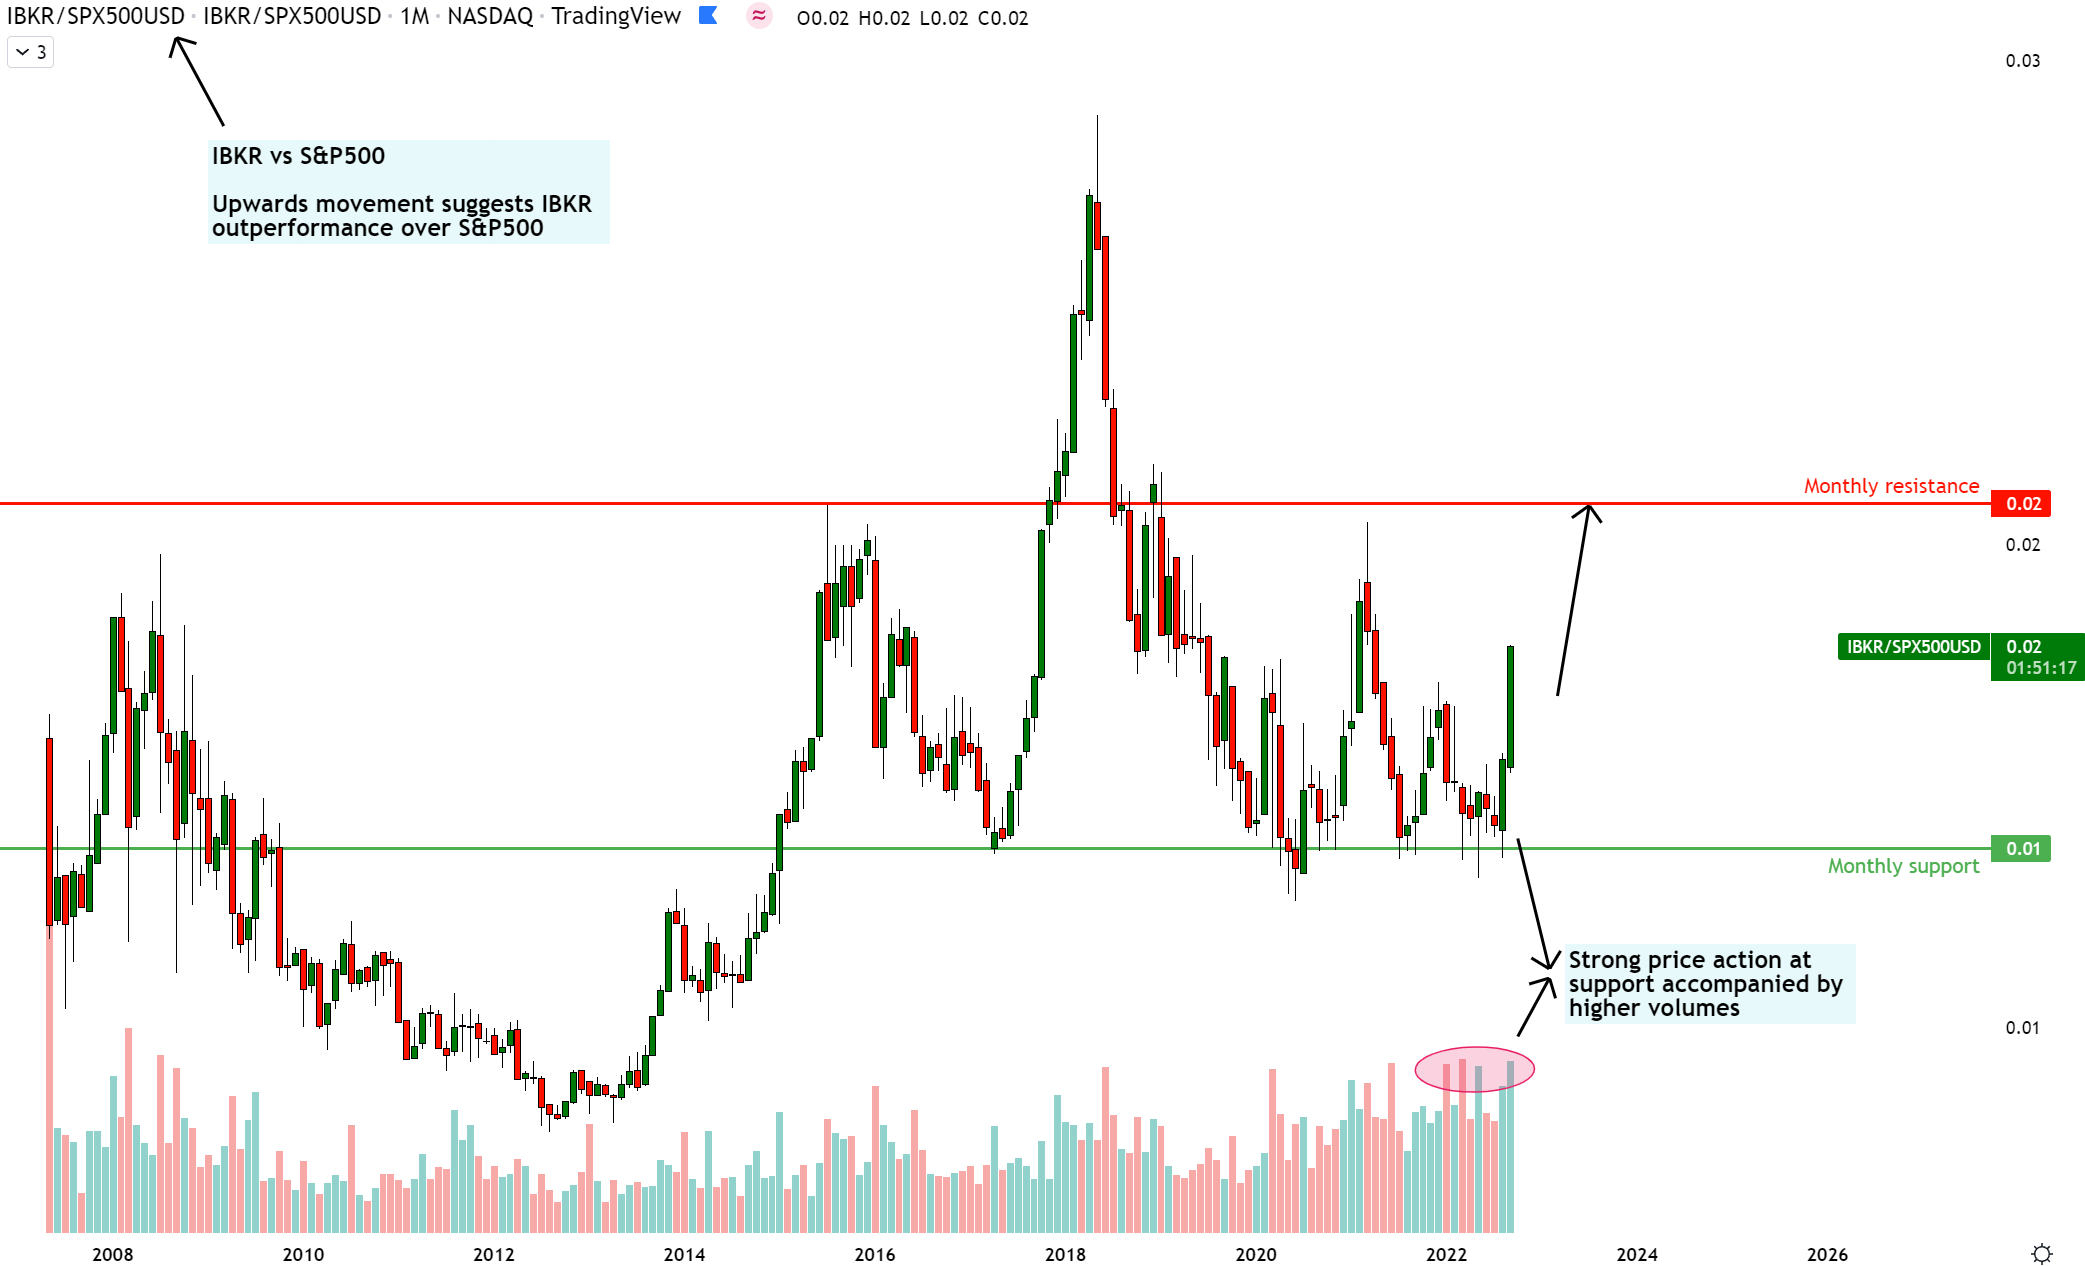
On the monthly IBKR vs. S&P 500 chart, an upward movement indicates Interactive Brokers’ outperformance vs. the S&P 500. Conversely, a downward movement indicates Interactive Brokers’ underperformance vs. the S&P 500.
Currently, the monthly relative chart shows a strong reaction to support, accompanied by higher volumes, thus increasing confidence in the support area. The relative spread is headed north toward the next monthly resistance zone. I plan to secure my alpha and exit positions in Interactive Brokers once it reaches the monthly resistance. However, I may re-assess later based on the fundamentals and price action.
Over the next few months and quarters, I think the charts show upside in Interactive Brokers both in absolute terms and relative to the benchmark index as well.
Key Risks and Monitorables
I will be keeping a close eye on retail accounts’ mining potential. Watching whether the overall commission mix of retail accounts continues to increase with account numbers will reveal this metric’s health in the interim.
I am also monitoring the VIX concurrently with Interactive Brokers’ average trades per account. A breakdown in the linkage of these two metrics will signal a failure of one of the three legs upon which my thesis stands.
Finally, I am on alert and watching for signs of a plateau in derivatives growth. The fact that derivative products’ activity has not slowed down despite the overall S&P500 being down almost 25% is a welcome surprise. Yet, I remain open-minded to the possibility of futures and options activity slowing down eventually, thus curbing the upticks in structural growth in per trade commissions.
The good news about this stock is that the company releases activity metrics every month on its investor relations page:
Interactive Brokers – Monthly Metrics (Interactive Brokers Investor Relations Page)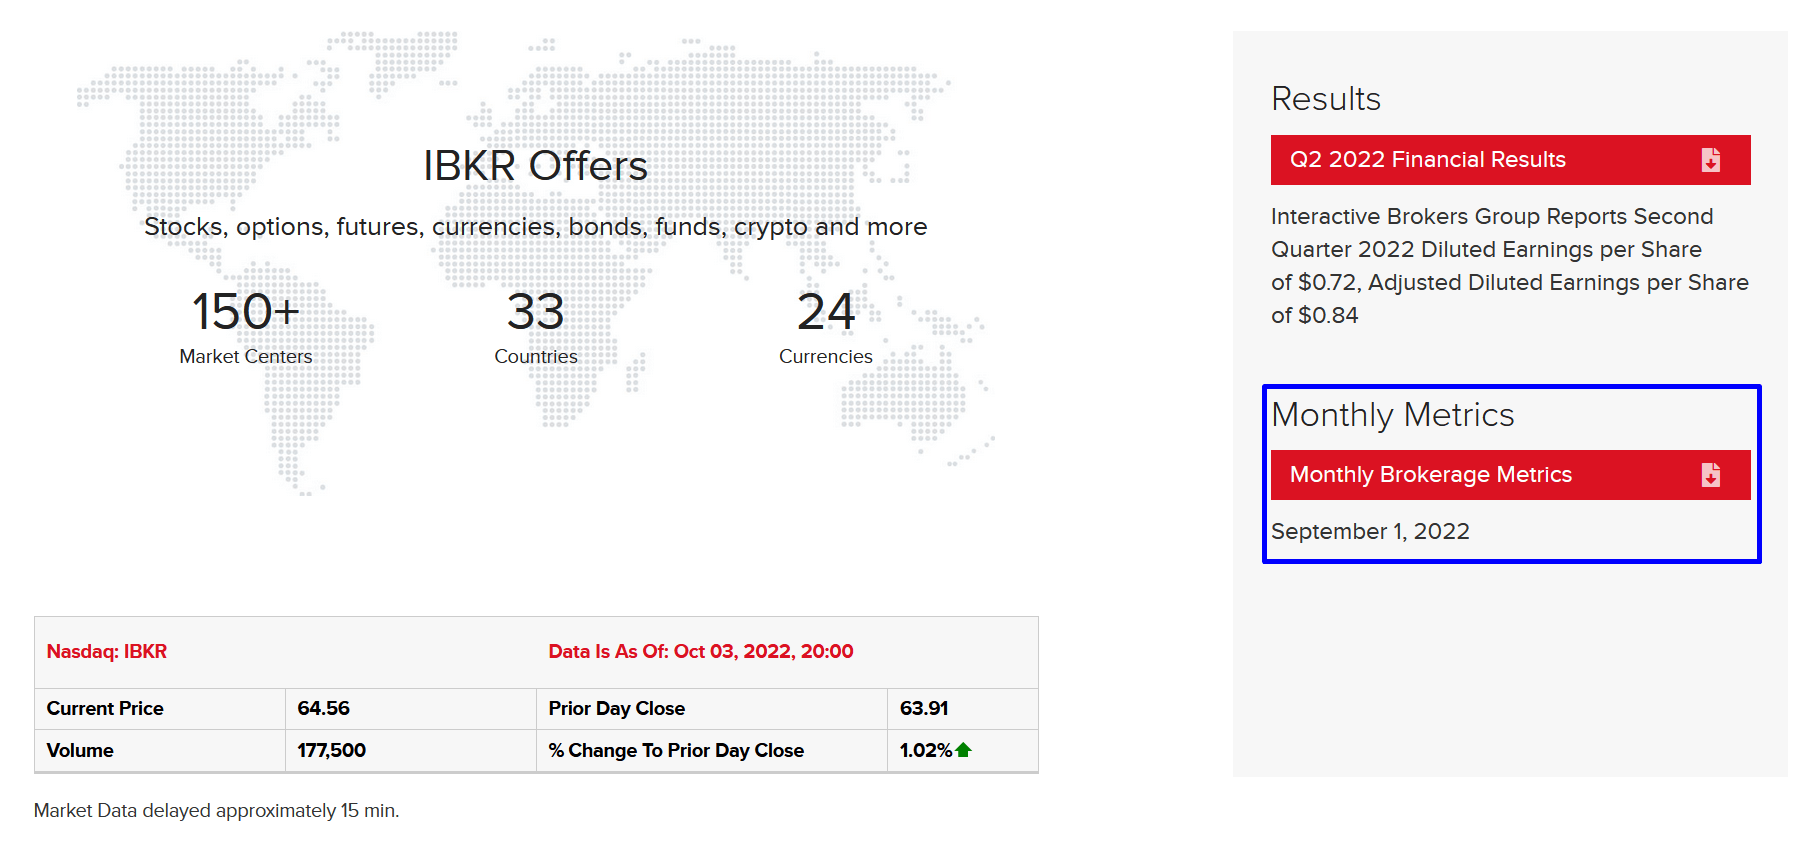
I think it is useful for investors to keep track of this high-frequency data to periodically assess whether the thesis is playing out.
Playing the Opportunity
I think Interactive Brokers is firing on multiple cylinders of growth; number of accounts, trades per account and per-trade commissions. I believe the stock is a good pick to beat the market. In terms of positioning, as the move has already begun, one option is to phase in the buys over a couple of weeks just in case the stock gives a small pullback. However, this may mean you miss the opportunity as well. I will certainly be writing about key updates and re-evaluations of my thesis for you as developments unfold. Stay tuned!
Be the first to comment