

Talaj/iStock via Getty Images
Since the USD plays such a strong role in global economics, we thought it’s appropriate to see how the USD performance is vs. other currencies and investments.
For the U.S. consumer, a strong USD means U.S. goods are more expensive in foreign markets. For U.S. companies that buy or sell products/services globally, a strong USD means they are less competitive. A strong dollar is a significant headwind that erodes the profits of U.S. multinationals.
Since we trade and invest in ETFs, it is especially interesting to see how the USD has been trading in 2022 compared to Gold (GLD), the S&P 500 (SPY), and the Nasdaq 100 (QQQ). Gold is the top performer, followed by the Australian dollar (AUD) and the U.S. dollar (DXY). We can also see on the following chart the recent recovery rally in both the SPY and QQQ. Amazingly, the QQQ has recovered half of its 2022 loss in just the last few weeks.
DXY – US Dollar Currency Index – Daily Comparison Chart
Technical Traders – TradingView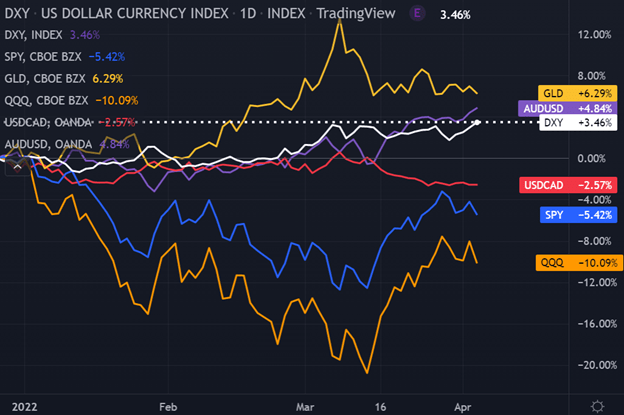
US Dollar Vs Major Currencies Performance Mixed
The following chart from Finviz shows us that the USD has strengthened vs. the Japanese yen, Eurodollar, British pound, and Switzerland franc but also that the USD has weakened vs. the Australian dollar, New Zealand dollar, and the Canadian dollar.
The AUD, NZD, and CAD reflect the impact of rising energy and commodity prices. The JPY reflects Japan’s negative interest rate as well as its dovish economic policy. While the EUR, GBP, and CHF are suffering from capital outflows due to the impact of Europe’s Russia Ukraine war.
US Dollar Year To Date Relative Performance Vs Majors
Finviz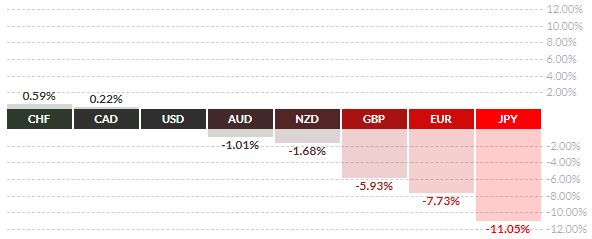
US Dollar Appreciated +11.19%
Since May 25, 2021, the USD has been steadily appreciating as a stand-alone market. We can also see that the USD has been in a bullish upward-sloping channel. The USD has offered many buying opportunities at both its bottom trend line as well as its Fibonacci support levels. It continues to make higher highs and higher lows.
The USD remains attractive as it is the primary reserve currency for government central banks. The Fed, with its recent rate hike, has signaled that it is planning on additional increases. The USD is considered a safe-haven investment and benefits from rising energy prices as the U.S. is a major producer of global oil and natural gas.
DXY – US Dollar Currency Index – Daily Chart
Technical Traders – TradingView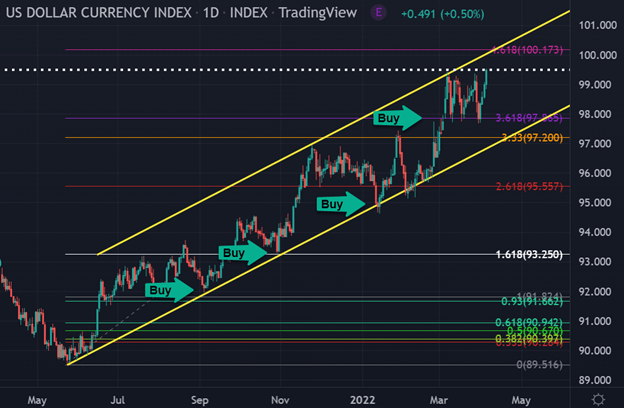
Australian Dollar Gained +45.15%
The Australian dollar enjoyed a strong rally in 2020 as it gained more than +45%. After hitting resistance at its 1.618 Fibonacci extension, the AUD corrected about 38% of its up-swing. This correction ended when buying resumed at the AUD previous high or the 1.000 support level. Since Jan 2022, the AUD has already appreciated about 9%. This is similar in both percentage and time frame to the S&P 500 (SPY) and the Nasdaq 100 (QQQ) equity markets.
AUD USD – Australian Dollar Vs Us Dollar – Daily Chart
Technical Traders – TradingView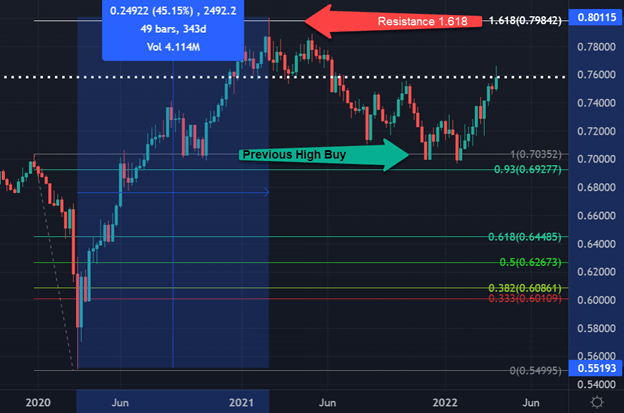
Knowledge, Wisdom, And Application Are Needed
It is important to understand that we are not saying the market has topped and is headed lower. This article is to shed light on some interesting analyses of which you should be aware. As technical traders, we follow price only, and when a new trend has been confirmed, we will change our positions accordingly.
Editor’s Note: The summary bullets for this article were chosen by Seeking Alpha editors.
Be the first to comment