

Yozayo/iStock via Getty Images
|
AVERAGE ANNUAL TOTAL RETURNS AS OF JUNE 30, 2022 |
||||||||||
|
Q2 2022 YTD |
1 YEAR |
5 YEARS |
10 YEARS |
15 YEARS |
SINCE INCEPTION |
|||||
|
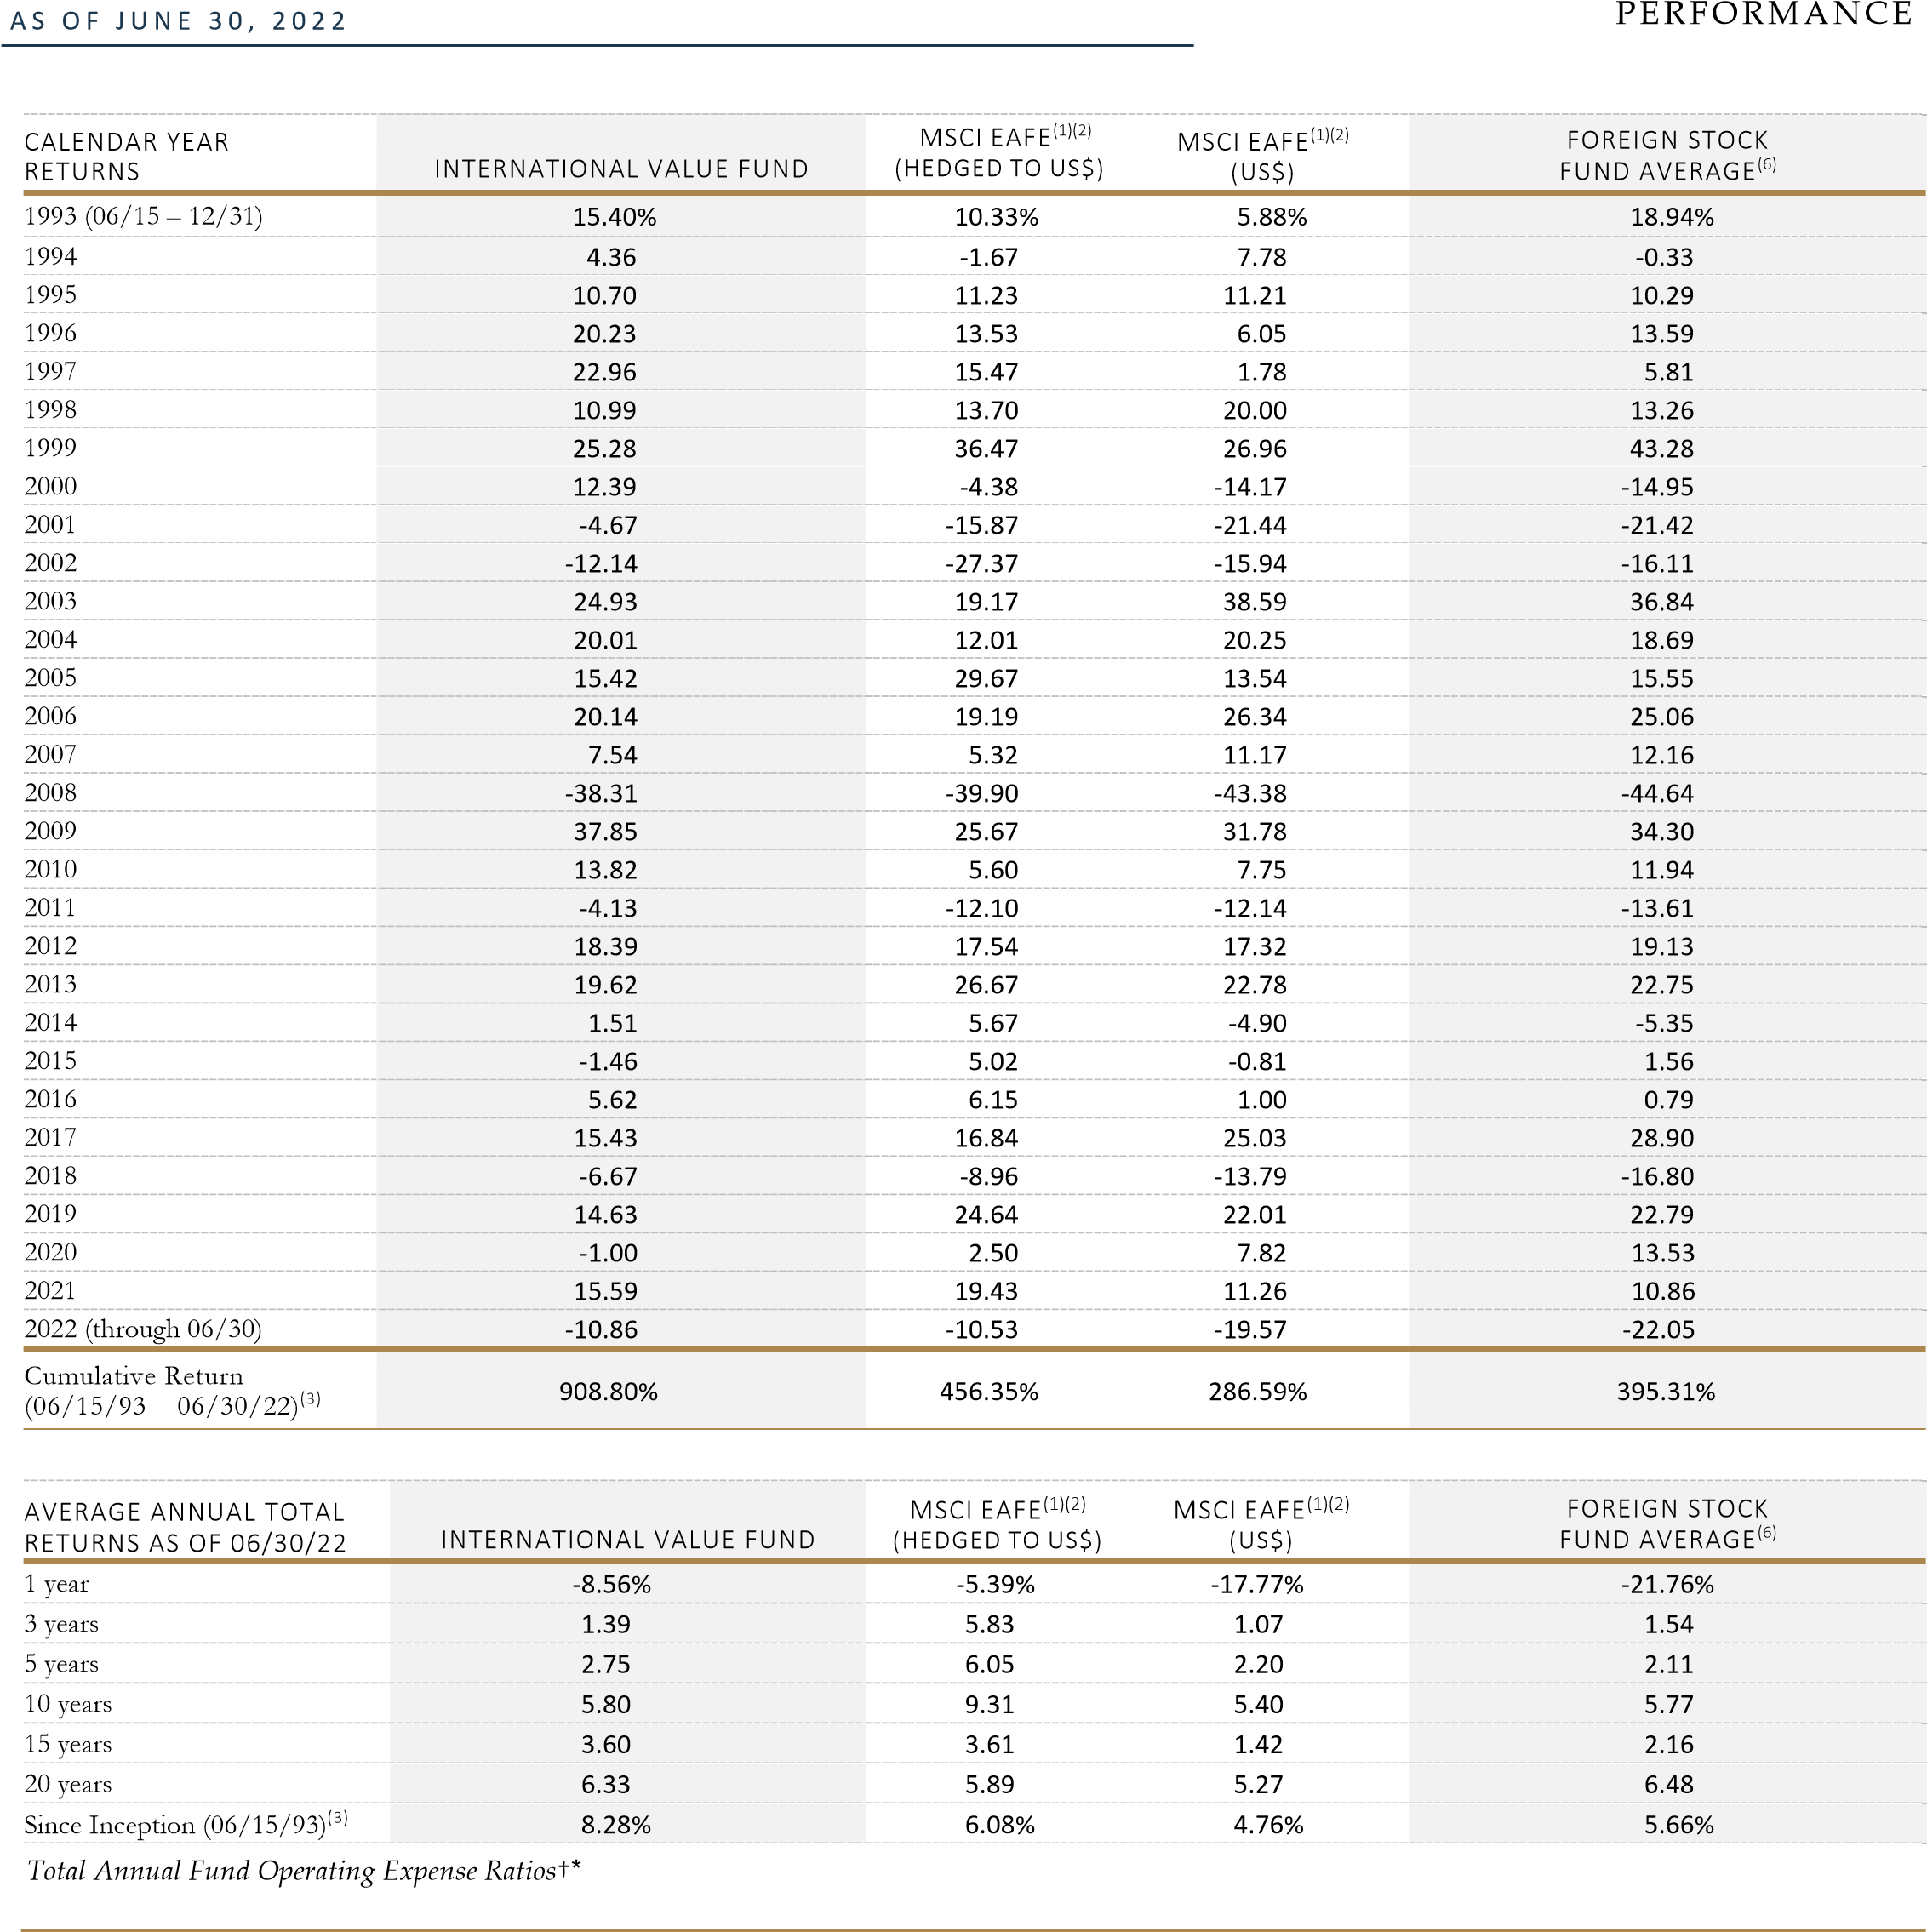
INTERNATIONAL VALUE FUND (inception 06/15/93) |
‐7.85% ‐10.86% |
‐8.56% |
2.75% |
5.80% |
3.60% |
8.28% |
||||
|
MSCI EAFE Index (Hedged to US$) |
‐7.28 ‐10.53 |
‐5.39 |
6.05 |
9.31 |
3.61 |
6.08 |
||||
|
MSCI EAFE Index (in US$) |
‐14.51 ‐19.57 |
‐17.77 |
2.20 |
5.40 |
1.42 |
4.76 |
||||
|
INTERNATIONAL VALUE FUND II – CURRENCY UNHEDGED* (inception 10/26/09) |
‐9.57% ‐13.34% |
‐12.77% |
1.29% |
4.18% |
‐ |
4.41% |
||||
|
MSCI EAFE Index (in US$) |
‐14.51 ‐19.57 |
‐17.77% |
2.20 |
5.40 |
‐ |
4.07 |
||||
|
VALUE FUND (inception 12/08/93) |
‐8.01% ‐10.13% |
‐8.18% |
3.81% |
6.39% |
4.58% |
7.55% |
||||
|
MSCI World Index (Hedged to US$) |
‐14.12 ‐18.00 |
‐10.72 |
8.94 |
11.04 |
6.00 |
7.70 |
||||
|
S&P 500 Index (12/08/93-12/31/06)/MSCI World Index (Hedged to US$) (01/01/07-present) |
‐14.12 ‐18.00 |
‐10.72 |
8.94 |
11.04 |
6.00 |
8.41 |
||||
|
WORLDWIDE HIGH DIVIDEND YIELD VALUE FUND (inception 09/05/07) |
‐9.39% |
‐10.45% |
2.55% |
4.65% |
‐ |
3.46% |
||||
|
MSCI World Index (in US$) |
‐16.19 ‐20.51 |
‐14.34 |
7.67 |
9.51 |
‐ |
5.44 |
||||
|
MSCI World High Dividend Yield Index (in US$) |
‐8.72 ‐8.51 |
‐4.10 |
5.45 |
7.42 |
‐ |
3.98 |
||||
|
INTERNATIONAL VALUE FUND |
INTERNATIONAL VALUE FUND II – CURRENCY UNHEDGED |
VALUE FUND |
WORLDWIDE HIGH DIVIDEND YIELD VALUE FUND |
|
|
TOTAL ANNUAL FUND OPERATING EXPENSE RATIOS AS OF 03/31/2022 |
1.38% (gross); 1.34% (NET)† |
1.37% (gross); 1.34% (NET)* |
1.39% (gross); 1.34% (NET)* |
1.48% (gross); 1.34% (NET)* |
|
TOTAL ANNUAL FUND OPERATING EXPENSE RATIOS AS OF 03/31/2021 |
1.38% (gross); 1.37% (NET) |
1.38% (gross); 1.38% (NET) |
1.41% (gross); 1.38% (NET) |
1.47% (gross); 1.39% (NET) |
|
30‐DAY STANDARDIZED YIELDS AS OF 03/31/2022 |
0.94% (Subsidized); 0.93% (Unsubsidized) |
1.07% (Subsidized); 1.07% (Unsubsidized) |
0.66% (Subsidized); 0.66% (Unsubsidized) |
1.78% (Subsidized); 1.79% (Unsubsidized) |
The performance data shown above represents past performance and is not a guarantee of future results. Investment return and principal value of an investment will fluctuate so that an investor’s shares, when redeemed, may be worth more or less than their original cost. Current performance may be higher or lower than the performance data quoted.†
Tweedy, Browne has voluntarily agreed, effective May 22, 2020 through at least July 31, 2023, to waive the International Value Fund’s fees whenever the Fund’s average daily net assets (“ADNA”) exceed $6 billion. Under the arrangement, the advisory fee payable by the Fund is as follows: 1.25% on the first $6 billion of the Fund’s ADNA; 0.80% on the next $1 billion of the Fund’s ADNA (ADNA over $6 billion up to $7 billion); 0.70% on the next $1 billion of the Fund’s ADNA (ADNA over $7 billion up to $8 billion); and 0.60% on the remaining amount, if any, of the Fund’s ADNA (ADNA over $8 billion). The performance data shown above would have been lower had fees not been waived pursuant to this arrangement from May 22, 2020 onwards.
* Tweedy, Browne has voluntarily agreed, effective December 1, 2017 through at least July 31, 2023, to waive a portion of the International Value Fund II’s, the Value Fund’s and the Worldwide High Dividend Yield Value Fund’s investment advisory fees and/or reimburse a portion of each Fund’s expenses to the extent necessary to keep each Fund’s expense ratio in line with the expense ratio of the International Value Fund. (For purposes of this calculation, each Fund’s acquired fund fees and expenses, brokerage costs, interest, taxes and extraordinary expenses are disregarded, and each Fund’s expense ratio is rounded to two decimal points.) The net expense ratios set forth above reflect this limitation, while the gross expense ratios do not. The International Value Fund II’s, Value Fund’s and Worldwide High Dividend Yield Value Fund’s performance data shown above would have been lower had certain fees and expenses not been waived and/or reimbursed during certain periods.
The Funds do not impose any front-end or deferred sales charges. The expense ratios shown above reflect the inclusion of acquired fund fees and expenses (i.e., the fees and expenses attributable to investing cash balances in money market funds) and may differ from those shown in the Funds’ financial statements.
COMMENTARY
Rising levels of inflation and interest rates around the world, lockdowns in China, the ongoing war in Ukraine, and growing concerns about the prospect of what could be a more serious than expected recession, led to increased volatility in global equity markets in the second quarter. As a result, a number of equity markets worldwide are now firmly in or near bear market territory, down over 20% year-to-date.
While the Tweedy, Browne Funds were not immune to these challenges during the quarter, they, for the most part, held up much better than their benchmark international and global indices. Our flagship, the International Value Fund, underperformed its hedged benchmark by 57 basis points, but outperformed the standard unhedged MSCI EAFE Index by 666 basis points. The Fund’s hedging policy provided significant protection against return dilution from declining foreign currencies.
This was also the case for the hedged Value Fund, which bested both the hedged and unhedged MSCI World Index, by 611 and 818 basis points, respectively. It should be noted that it has been difficult of late for the hedged Tweedy, Browne Funds to best their hedged benchmarks, in light of their policies of hedging their perceived currency exposure, their significant underweightings in Japanese equities, and the recent weakness of the Japanese Yen. In spite of those impediments, the Value Fund handily beat its hedged benchmark index, and the
International Value Fund came within 57 basis points of doing so. Both the International Value Fund II – Currency Unhedged and Worldwide High Dividend Yield Value Fund, which do not hedge perceived foreign currency risk, also bested their benchmarks by 494 and 680 basis points, respectively. With valuation-related discount rates on the rise and increasing concerns about a slowdown in growth in corporate earnings, the rotation of investors away from more growth-oriented equities to more value-oriented equities that began in September 2020 appears to remain firmly in place.
It is impossible, of course, to know whether markets have hit bottom, but if the past is prologue concerning previous major market inflection points, this may go on for a while. The good news is that these volatile markets, in our view, continue churning up new investment opportunities. We remain hopeful that this challenging environment and the pricing opportunities it presents could set the stage for the resurgence of value.
TWEEDY, BROWNE INTERNATIONAL VALUE FUND MORNINGSTAR PEER GROUP RESULTS: PERIODS ENDING 06/30/2022
|
Q2 2022 |
1 YEAR |
5 YEARS |
10 YEARS |
15 YEARS |
20 YEARS |
|
|
Percentile Rank For TB Int Value Fund |
Top 5% out of |
Top 14 % out of |
Top 15 % out of |
Top 11 % out of |
Top 1% out of |
Top 9% out of |
|
Total Funds in Category |
352 |
344 |
292 |
175 |
117 |
65 |
Morningstar has ranked the International Value Fund among its peers in the Foreign Large Value Category. Percentile rank in a category is the Fund’s total‐return percentile rank relative to all funds that have the same Morningstar Category. The highest (or most favorable) percentile rank is 1 and the lowest (or least favorable) percentile rank is 100. The top‐performing fund in a category will always receive a rank of 1. The “out of” number represents the total number of funds in the category for the listed time period. Percentile rank in a category is based on total returns, which include reinvested dividends and capital gains, if any, and exclude sales charges. The preceding performance data represents past performance and is not a guarantee of future results.
PERFORMANCE ATTRIBUTION
Please note that the individual companies discussed herein were held in one or more of the Funds during the quarter ended June 30, 2022, but were not necessarily held in all four of the Funds. Please refer to each Fund’s portfolio page, beginning on page 7, for selected purchase and sale information during the quarter and the footnotes on page 16 for each Fund’s respective holdings in each of these companies as of June 30, 2022.
Most stocks across our Fund portfolios faced declines in their share prices during the quarter; however, there were several bright spots as well. Some of those included good absolute results from the Funds’ Chinese holdings, a strong return from the Funds’ sole oil & gas holding, TotalEnergies (TTE), good results from a couple of their branded consumer products companies, good returns from two defense contractors, and solid results from several of the Funds’ Japanese industrial holdings.
With regulatory rhetoric from the Chinese government easing during the quarter and lockdowns coming off near quarter-end, Chinese companies such as Dali Foods (OTCPK:DLLFF), Uni-President (OTCPK:UPCHY), WH Group (OTCPK:WHGLY), Shanghai Mechanical, and the platform technology companies, Baidu (BIDU) and JD.Com (JD), all perked up, producing a solid contribution to absolute results. TotalEnergies’s near-term earnings power buoyed by high oil prices continued to drive better returns in its stock.
Consumer stocks such as Coca-Cola FEMSA (KOF) and Unilever (UL), and a couple of the Funds’ pharma holdings, GSK (GSK), Vertex (VRTX), and Johnson & Johnson (JNJ), also had positive returns for the quarter. UK-based BAE Systems (OTCPK:BAESF) and Germany’s Rheinmetall (OTCPK:RNMBF), two defense contractors, produced attractive returns as near term earnings received a boost from rising defense concerns spawned in part by the war in Ukraine. The Funds also benefitted from good returns in a number of their Japanese industrial companies as Japan’s inflation levels remain relatively better and its monetary response more benign.
This includes attractive returns in companies such as Nabtesco (OTCPK:NCTKF), Sumitomo Heavy (OTCPK:SOHVF), Kamigumi (OTCPK:KMGIF), Nifco (OTCPK:NIFCY), Transcosmos (OTCPK:TRCLF), NGK Spark Plug (OTCPK:NGKSF), and Kuraray (OTCPK:KURRF). In addition, AutoZone (AZO), Standard Chartered (OTCPK:SCBFF), Inchcape PLC (OTCPK:IHCPF), Orange SA (ORAN), and FedEx (FDX, a new holding) were significant positive contributors to the quarter’s results.
Despite better results from the Japanese industrials, overall, the industrial component of the Funds’ portfolios suffered somewhat, due in some instances to margin compression associated with rising inflation and interest rates and the increasing prospects for a recession in the near term. This led to disappointing results for CNH Industrial (CNHI), BASF (OTCQX:BASFY), Safran (OTCPK:SAFRF), 3M (MMM), CK Hutchison (OTCPK:CKHUY), and Howden Joinery Group (OTCPK:HWDJF).
These same concerns also led to relatively poor stock price results in the Funds’ financial holdings, including banks such as Bank of America (BAC), Truist (TFC), Wells Fargo (WFC), United Overseas Bank (OTCPK:UOVEF), and DBS Group (OTCPK:DBSDF), and in other financial and insurance holdings such as Berkshire Hathaway (BRK.A, BRK.B) and SCOR (OTCPK:SCRYY), the French reinsurer. Progressive (PGR), the US-based auto insurer, and Standard Chartered, the UK-based bank, were the only financial companies in the Fund portfolios to produce positive returns during the quarter.
In addition, Intel (INTC), Roche (OTCQX:RHHBY), Nestlé (OTCPK:NSRGY), Diageo (DEO), and Megacable (OTCPK:MHSDF) also produced disappointing returns for the quarter.
PORTFOLIO ACTIVITY
With market volatility ever present during the quarter, we established several new positions including FedEx, the US based shipping company; German based Deutsche Post (OTCPK:DPSTF), which, in many ways, is FedEx’s counterpart in Europe; China Bank Corp, a small Philippine-based commercial bank; Howden Joinery, the UK-based kitchen designer; Nabtesco, the Japanese manufacturer of precision parts for the aviation, railroad, and robotic industries; Nifco, another Japanese manufacturer of synthetic fasteners and plastic components for automobiles; Paramount Global (PARA), the US-based media and entertainment company; and Samsung Electronics (OTCPK:SSNLF), the Korean semi-conductor and consumer products manufacturer.
All these companies at purchase were trading at significant discounts from our conservative estimates of their intrinsic values and, in our view, had solid balance sheets and strong prospects for future growth. In all but Nabtesco and Nifco, there was also recent insider buying in their shares at prices comparable to what we paid for the Funds’ shares. We also took advantage of pricing opportunities to add to the Funds’ portfolio positions in Kemira (OTCPK:KOYJF), SKF, Uni-President (OTCPK:UPCHY), and Safran (OTCPK:SAFRF).
On the sell side, a number of Fund positions were sold or trimmed back during the quarter, including US-based companies such as 3M and Carlisle (CSL), and non-US holdings such as Astellas Pharma (OTCPK:ALPMF), Standard Chartered, A-Living (OTCPK:ALVSF), Bollore (OTCPK:BOIVF), Samchully, Coca-Cola FEMSA, Diageo, and Roche (OTCQX:RHHBY), among others. The shares of Vivo Energy, the UK based distributor of petroleum products, held in both our International Value Fund and International Value Fund II, were sold after Vitol, a large existing shareholder, made a bid to take the company private.
ADDITIONAL COMMENTARY ON TWO NEWLY ESTABLISHED POSITIONS
Deutsche Post is a logistics conglomerate based in Germany with leading, global positions in most of its businesses. The company is named after its German Post (mail) and Parcel segment, but its largest and most valuable businesses are the DHL branded ones: Express, Freight Forwarding and Supply Chain Management which are part of a global oligopoly which includes US based UPS and FedEx.
Those businesses and a recently created one, e-Commerce Solutions, comprise ~80% of Deutsche Post’s operating profit, and benefit from trends in e-commerce, outsourcing and global trade. The German mail business is in a structural decline which we believe should be mostly offset by ecommerce related growth in that segment’s parcel business.
The company transformed itself after the 2008 financial crisis. The current CEO, Frank Appel, abandoned DHL’s attempt to compete with UPS and FedEx in the US domestic market, and re-focused it on the international express business. Since 2013, DHL Express has improved its segment operating margins by nearly 900 basis points, and grown its volumes by 8% annually. The company also has successfully managed the decline in its mail business and has developed a good supply chain management business. However, Deutsche Post’s freight forwarding segment has struggled.
All in all, primarily due to the DHL Express business, Deutsche Post’s operating margins have improved by over 400 basis points, and the company has now generated a consistent 20%+ ROE including goodwill. In addition, the current management has changed the culture and mindset at the company, as it has been focusing more on returns on capital and free cash flow generation. It also has a program to repurchase 2 billion euros of its shares by the end of 2024.
According to the company, its post and parcel business aims to have stable or flat operating profit, and its freight forwarding business should be able to grow its revenue at a GDP-oriented rate over time. However, the company’s other businesses have secular growth drivers (largely e-commerce), and we believe those businesses should be able to grow their revenues at mid-single digit rates, or better, organically over the longer longer-term.
At or around initial purchase, Deutsche Post was trading at roughly 6.8x EBIT on its 2021 and 2022 estimated EBIT, less than 10 times 2022 estimated earnings, and paid an annual dividend yield of around 5.1%. Management expects
EBIT to increase from ~8 billion euros to 8.5 billion euros by 2024. If one were to use a more conservative estimate of 6.2 billion euros (EBIT) after normalizing the freight forwarding business and making some other adjustments, it would imply a 8.9x EV/EBIT valuation. Private market transactions for comparable express and freight forwarding businesses transactions have occurred at high multiples. Two directors, the current CEO, and the company’s Chairman all bought shares at prices between $34-$37 per share before the Funds’ initial purchases of stock at around $35.
Nabtesco is a small to medium sized Japanese industrial company that manufactures precision parts for a wide range of motion-control applications including robots, aircrafts, railway equipment, and construction equipment. 46% of its revenue is directly derived from sources outside of Japan. Pandemic related slowdowns in aircraft and construction equipment component sales offered the Funds a pricing opportunity early in the quarter in this rather above average Japanese business.
The company’s products include reduction gears that allow industrial robots to make precise movements – sort of like the movements of a human elbow or wrist– and hydraulic pistons for applications such as construction machinery. Such products are typically critical to Nabtesco’s customers, with extremely demanding, worldleading specifications and a requirement for durability, allowing Nabtesco to enjoy a long term relationship with these customers. The company has also built significant market share in aircraft actuation systems, marine control systems, railway door systems and certain food packaging systems, establishing itself as the reference in motion control technologies.
Nabtesco enjoys stable margins, has had roughly 5% revenue growth over time, has compounded its intrinsic value at an estimated 7% including its dividend, and would appear to have the wind at its back because factory automation is a growth market. At initial purchase, the company was trading at approximately 13.5 times normalized earnings, which translates into an earnings yield of approximately 7.4%, comparing quite favorably to the 0.18% yield on the Japanese 10-year government bond. The company has also bought back shares on occasion.
ESG INITIATIVES
During the quarter, our investment team evaluated numerous ESG issues associated with existing and prospective holdings, three of which merit mentioning.
We continue to be active in the Funds’ position in Industrias Bachoco, the Mexican chicken company, arguing aggressively against a proposed voluntary tender offer under consideration by the Robinson Bours family. We believe the offer made by the controlling family is well below fair value and unfairly benefits the family at the expense of minority shareholders. We sent a letter to make our objections known. We also participated in an open letter along with other shareholders, collectively representing about 16% of the outstanding shares.
We believe the offer has left shareholders with two bad options: be forced to embrace this poor offer well below our estimate of fair value; or not tender and face even less liquidity in an already thinly-traded stock. Also, shareholders who choose not to tender could be vulnerable later to a follow-on tender offer to mop up holdouts at an even lower price. As a result, we have made numerous efforts to put pressure on the controlling family through the press and combined efforts with other shareholders in hopes of achieving a better outcome.
We decided to sell the Funds’ remaining holdings in 3M, primarily due to recent litigation around product safety. There has been an extended running liability issue involving so-called “forever chemicals” getting into the public water supply, and a more recent issue involving earplugs made for the military. Damage awards in several early ear plug cases have been extraordinarily large and could be a drag on growth for 3M in the years ahead. While the stock remained reasonably priced, we felt it was more prudent to deploy the Funds’ capital elsewhere rather than trying to wait out years of legal wrangling.
We also voted against a proposal by SCOR, the Funds’ French reinsurance company holding, to change the by-laws to allow the chairman, Denis Kessler, to stay in place until age 72 (from 70). We felt that his performance, specifically regarding his handling of the attempted takeover by Covea, and the fumbled SCOR CEO transition, did not provide the good corporate governance that we had become accustomed to in SCOR in past years.
Given that this measure required a super-majority to pass, we felt it was the best opportunity we had to try to force his retirement from the Board. The vote unfortunately passed, and Mr. Kessler will remain chairman for two more years, after which he is expected to retire. SCOR’s stock price remains extraordinarily cheap in our view, more than compensating for Kessler’s continued service, which over the longer term has been quite satisfactory.
COMINGS & GOINGS
We are pleased to announce that Andrew Ewert, a six-year veteran of our analytical team and equity stakeholder in our firm, has been promoted to Managing Director and has joined our Investment Committee effective July 1, 2022. Andrew joined Tweedy, Browne in 2016 after having worked at other value investing firms such as Equinox Partners and Ruane, Cunniff & Goldfarb. He received a Bachelor’s degree in Business Administration from Emory University in 2000 and an MBA from Columbia University in 2007, where he completed Columbia’s highly respected value investing program.
During his tenure at Tweedy, Browne, Andrew has been an extraordinarily productive analyst, researching both domestic and international equities. In addition, he has been responsible for a host of successful investments that have made their way into our portfolios in recent years. He is a clear thinker, of impeccable character, and day-in and day-out has exhibited the requisite temperament necessary for success as a value investor.
Andrew replaced Sean McDonald, who resigned from the firm effective June 30. Sean had been a member of our investment team since 2009, as well as a respected friend and colleague, and we were sad to see him go. We wish him success in his future endeavors.
We remain particularly proud of the strength and stability of our investment team, which consists of the seven members of our Investment Committee, Will Browne as senior advisor thereto, and three additional security analysts. This eleven-person team has logged 280 years at Tweedy, Browne (ranging from 6 to 48 years) for an average tenure of
25 years. Moreover, in Tweedy, Browne’s more than 100-year history, no member of the Management Committee of Tweedy, Browne has ever left to take another job elsewhere. We look forward to many more years of collaboration with this talented team of investment professionals.
PORTFOLIO POSITIONING AND OUTLOOK
The near-term environment remains challenging as markets come to grips with rising inflation and interest rates and the prospects for what could be a difficult global recession. While valuations have corrected somewhat, with many stocks down more than 20% from their highs, it remains to be seen whether it is enough, in light of the prospect for earnings disappointments on the near term horizon.
Nevertheless, it remains clear that this is an excellent time to be “mining for value,” particularly in non-US equity markets, which to a significant degree, did not achieve the excesses in valuation experienced by their US counterparts. Accordingly, we continue to focus on companies that we believe have strong balance sheets and/or the ability to continue to deliver pricing power, and those where there has been recent insider buying in their shares by “knowledgeable insiders.”
Rest assured that we will keep our nose to the grindstone, researching new and existing investments on a stock-by-stock basis, and refreshing our client portfolios for what we believe could be a period of relative prosperity for our style of investing.
Thank you for investing with us. Stay well.
Roger R. de Bree, Andrew Ewert, Frank H. Hawrylak, Jay Hill, Thomas H. Shrager, John D. Spears, Robert Q. Wyckoff, Jr.
Investment Committee, Tweedy, Browne Company LLC
INTERNATIONAL VALUE FUND PORTFOLIO AS OF JUNE 30, 2022
Performance Attribution
FACTORS WITH THE LARGEST IMPACT ON RETURN, ON AN ABSOLUTE BASIS, AND MEASURED IN LOCAL CURRENCIES.
» Oil & gas, personal products, aerospace & defense, distributors, and IT services were among the leading industries while the Fund’s interactive media, banks, machinery, insurance, and diversified financial services companies underperformed.
» Top performing countries during the quarter included Japan, China,
Chile, and the Netherlands, while holdings from the US, Switzerland, Singapore, France, and Britain underperformed during the quarter.
» Top contributing holdings included BAE Systems (OTCPK:BAESF), TotalEnergies (TTE), GSK, Unilever, WH Group, and Baidu. Declining stocks included CNH Industrial, Berkshire Hathaway, Alphabet (GOOG, GOOGL), SCOR, United Overseas Bank, and Roche.
|
Countries |
% FUND |
MARKET VALUE |
|
Belgium |
0.21% |
$12,030,106 |
|
Canada |
1.92 |
110,018,730 |
|
Chile |
0.30 |
16,951,505 |
|
China |
5.78 |
330,547,805 |
|
Croatia |
0.16 |
9,123,225 |
|
Czech Republic |
0.03 |
1,926,615 |
|
Finland |
0.50 |
28,833,772 |
|
France |
10.61 |
606,617,679 |
|
Germany |
7.44 |
425,758,840 |
|
Hong Kong |
1.76 |
100,830,481 |
|
Italy |
1.82 |
104,065,400 |
|
Japan |
2.73 |
155,970,885 |
|
Mexico |
2.15 |
123,000,946 |
|
Netherlands |
2.74 |
156,890,962 |
|
Philippines |
0.06 |
3,618,430 |
|
Singapore |
5.13 |
293,171,187 |
|
South Korea |
1.92 |
109,812,381 |
|
Sweden |
3.18 |
181,638,966 |
|
Switzerland |
13.05 |
746,304,600 |
|
United Kingdom |
18.40 |
1,052,594,817 |
|
United States |
13.48 |
770,792,083 |
|
Total Equities |
93.37% |
$5,340,499,416 |
|
Cash & Other Net Assets* |
3.66 |
209,425,187 |
|
Currency Hedges |
2.97% |
169,661,916 |
|
Total Fund |
100.00% |
$5,719,586,519 |
|
Industry Sectors |
% FUND |
MARKET VALUE |
|
Communication Services |
9.86% |
$563,946,347 |
|
Consumer Discretionary |
4.53 |
259,160,052 |
|
Consumer Staples |
20.50 |
1,172,507,896 |
|
Energy |
3.53 |
201,755,219 |
|
Financials |
14.52 |
830,227,979 |
|
Health Care |
12.73 |
728,169,991 |
|
Industrials |
19.30 |
1,104,020,423 |
|
Information Technology |
1.10 |
62,662,618 |
|
Materials |
5.41 |
309,495,759 |
|
Real Estate |
0.85 |
48,776,763 |
|
Utilities |
1.05 |
59,776,369 |
|
Total Equities |
93.37% |
$5,340,499,416 |
|
Cash & Other Assets* |
3.66 |
209,425,187 |
|
Currency Hedges |
2.97 |
169,661,916 |
|
Total Fund |
100.00% |
$5,719,586,519 |
* Includes cash, Treasurys and money market funds.
|
Selected Purchases & Sales |
|||||
|
Astellas Pharma Inc |
S |
Nifco Inc. |
P |
||
|
Bollore SA |
T |
Roche Holding |
T |
||
|
Deutsche Post |
P |
Safran SA |
A |
||
|
Diageo PLC |
T |
Samchully |
S |
||
|
Fagron NV |
A |
Samsung Electronics Co. |
P |
||
|
Howden Joinery Group PLC |
P |
SKF AB |
A |
||
|
Kemira OYJ |
A |
Uni-President China Holdings |
A |
||
|
Nabtesco Corporation |
P |
Vivo Energy |
S |
||
|
P: PURCHASE A: ADD S: SALE T: TRIM |
TO: TAKEOVER M: MERGER |
||||
|
Top 20 Equity Holdings |
% FUND |
MARKET VALUE |
|||
|
Nestlé |
5.16% |
$295,095,006 |
|||
|
Diageo PLC |
3.97 |
227,091,809 |
|||
|
TotalEnergies SE |
3.53 |
201,755,219 |
|||
|
GSK PLC |
3.16 |
180,506,373 |
|||
|
Roche Holding |
3.14 |
179,417,502 |
|||
|
Berkshire Hathaway |
2.99 |
170,941,100 |
|||
|
CNH Industrial |
2.96 |
169,574,348 |
|||
|
BAE Systems PLC |
2.94 |
168,374,882 |
|||
|
Alphabet Inc. (Class A) |
2.88 |
164,507,979 |
|||
|
Safran SA |
2.84 |
162,278,610 |
|||
|
Heineken Holding |
2.74 |
156,890,962 |
|||
|
United Overseas Bank |
2.73 |
155,994,544 |
|||
|
Johnson & Johnson |
2.44 |
139,792,143 |
|||
|
DBS Group Holdings |
2.40 |
137,176,644 |
|||
|
Alphabet Inc. (Class C) |
2.30 |
131,345,435 |
|||
|
SCOR SE |
2.08 |
119,161,784 |
|||
|
Zurich Insurance Group |
1.99 |
113,646,444 |
|||
|
Unilever |
1.80 |
103,177,314 |
|||
|
Henkel KGaA |
1.80 |
102,751,606 |
|||
|
Alibaba Group Holding |
1.64 |
93,523,299 |
|||
|
Total Equities |
55.48% |
$3,173,003,003 |
|||
|
Market Cap (US$) |
% FUND |
MARKET VALUE |
|||
|
> 50 billion |
42.98% |
$2,458,156,481 |
|||
|
20 – 50 billion |
13.76 |
786,835,720 |
|||
|
10 – 25 billion |
12.85 |
734,927,021 |
|||
|
2 – 10 billion |
15.26 |
872,805,643 |
|||
|
< 2 billion |
8.53 |
487,774,551 |
|||
|
Total Equities |
93.37% |
$5,340,499,416 |
|||
|
Cash & Other Assets* |
3.66 |
209,425,187 |
|||
|
Currency Hedges |
2.97 |
169,661,916 |
|||
|
Total Fund |
100.00% |
$5,719,586,519 |
|||
|
Other Fund Information |
|||||
|
Number of Issues |
100 |
||||
|
Net Assets of Fund |
$5.7 billion |
||||
|
12-Month Turnover |
12% |
||||
Allocations of investments shown above reflect the Fund’s investments on 06/30/22 and may not be representative of the Fund’s current or future holdings. Data is based on the Fund’s net assets reported as of the close of business on 06/30/22, and may differ from net assets reported in the Fund’s financial statements, which reflect adjustments in accordance with accounting principles generally accepted in the United States.
INTERNATIONAL VALUE FUND PERFORMANCE AS OF JUNE 30, 2022
As of 03/31/2022: 1.38% (gross), 1.34% (NET) // As of 03/31/2021: 1.38% (gross), 1.37% (NET)
The performance shown above represents past performance and is not a guarantee of future results. Investment return and principal value of an investment will fluctuate so that an investor’s shares, when redeemed, may be worth more or less than their original cost. Current performance may be lower or higher than the performance data quoted. Please visit www.tweedy.com to obtain performance data, which is current to the most recent month end.
† Tweedy, Browne has voluntarily agreed, effective May 22, 2020 through at least July 31, 2023, to waive the Fund’s fees whenever the Fund’s average daily net assets (“ADNA”) exceed $6 billion. Under the arrangement, the advisory fee payable by the Fund is as follows: 1.25% on the first $6 billion of the Fund’s ADNA; 0.80% on the next $1 billion of the Fund’s ADNA (ADNA over $6 billion up to $7 billion); 0.70% on the next $1 billion of the Fund’s ADNA (ADNA over $7 billion up to $8 billion); and 0.60% on the remaining amount, if any, of the Fund’s ADNA (ADNA over $8 billion). The performance data shown above would have been lower had fees not been waived pursuant to this arrangement from May 22, 2020 onwards.
* The Fund does not impose any front-end or deferred sales charges. The expense ratios shown above reflect the inclusion of acquired fund fees and expenses (i.e., the fees and expenses attributable to investing cash balances in money market funds) and may differ from those shown in the Fund’s financial statements.
Please refer to footnotes (1) through (8) at the end of this commentary for descriptions of the Fundʹs indexes.
INTERNATIONAL VALUE FUND II – CURRENCY UNHEDGED PORTFOLIO AS OF JUNE 30, 2022
Performance Attribution
FACTORS WITH THE LARGEST IMPACT ON RETURN, ON AN ABSOLUTE BASIS, AND MEASURED IN LOCAL CURRENCIES.
» Oil & gas, distributors, personal products, industrial conglomerates, and specialty retail companies were among the leading industries while the Fund’s machinery, auto components, insurance, chemicals, and diversified financial services companies underperformed.
» Top performing countries during the quarter included China, the Netherlands, Japan, and Chile, while holdings from France, the US, Switzerland, Singapore, and Britain underperformed during the quarter.
» Top contributing holdings included BAE Systems, TotalEnergies, Standard Chartered, GSK, Rheinmetall, and AutoZone. Declining stocks included CNH Industrial, Michelin, Berkshire Hathaway, SCOR, Cisco Systems, and Roche.
|
Countries |
% FUND |
MARKET VALUE |
|
Belgium |
0.27% |
$1,283,430 |
|
Canada |
1.21 |
5,747,609 |
|
Chile |
0.30 |
1,442,812 |
|
China |
7.16 |
34,039,038 |
|
Finland |
0.51 |
2,404,955 |
|
France |
11.75 |
55,854,716 |
|
Germany |
8.56 |
40,672,554 |
|
Hong Kong |
1.89 |
8,986,241 |
|
Italy |
1.02 |
4,835,222 |
|
Japan |
4.51 |
21,416,397 |
|
Mexico |
3.33 |
15,848,796 |
|
Netherlands |
1.81 |
8,583,974 |
|
Philippines |
0.33 |
1,578,636 |
|
Singapore |
3.93 |
18,658,765 |
|
South Korea |
2.78 |
13,220,139 |
|
Sweden |
2.93 |
13,924,580 |
|
Switzerland |
11.36 |
54,022,753 |
|
Thailand |
0.97 |
4,589,826 |
|
United Kingdom |
17.82 |
84,715,013 |
|
United States |
12.48 |
59,335,352 |
|
Total Equities |
94.99% |
$451,547,039 |
|
Cash & Other Net Assets* |
5.01 |
23,833,671 |
|
Total Fund |
100.00% |
$475,380,710 |
|
Industry Sectors |
% FUND |
MARKET VALUE |
|
Communication Services |
4.60% |
$21,865,062 |
|
Consumer Discretionary |
10.62 |
50,487,145 |
|
Consumer Staples |
15.70 |
74,615,425 |
|
Energy |
2.78 |
13,207,378 |
|
Financials |
12.82 |
60,962,961 |
|
Health Care |
12.87 |
61,159,205 |
|
Industrials |
23.94 |
113,794,397 |
|
Information Technology |
2.49 |
11,818,814 |
|
Materials |
6.51 |
30,942,428 |
|
Real Estate |
0.90 |
4,267,829 |
|
Utilities |
1.77 |
8,426,395 |
|
Total Equities |
94.99% |
$451,547,039 |
|
Cash & Other Assets* |
5.01 |
23,833,671 |
|
Total Fund |
100.00% |
$475,380,710 |
* Includes cash, Treasurys and money market funds.
|
Selected Purchases & Sales |
||||
|
Astellas Pharma Inc |
S |
Nifco Inc. |
P |
|
|
Bollore SA |
T |
Norma Group SE |
A |
|
|
China Banking Corporation |
P |
Safran SA |
A |
|
|
Deutsche Post |
P |
Samsung Electronics Co. |
P |
|
|
Howden Joinery Group PLC |
P |
Standard Chartered |
S |
|
|
Kemira OYJ |
A |
Vivo Energy |
S |
|
|
Nabtesco Corporation |
P |
|||
|
P: PURCHASE A: ADD S: SALE T: TRIM |
TO: TAKEOVER M: MERGER |
|||
|
Top 20 Equity Holdings |
% FUND |
MARKET VALUE |
||
|
Nestlé |
3.32% |
$15,792,038 |
||
|
CNH Industrial |
3.20 |
15,212,684 |
||
|
Diageo PLC |
3.18 |
15,118,262 |
||
|
Roche Holding |
3.17 |
15,069,859 |
||
|
AutoZone, Inc. |
3.13 |
14,861,165 |
||
|
Safran SA |
2.99 |
14,216,017 |
||
|
GSK PLC |
2.79 |
13,266,155 |
||
|
TotalEnergies SE |
2.78 |
13,207,378 |
||
|
Johnson & Johnson |
2.68 |
12,748,768 |
||
|
Zurich Insurance Group |
2.59 |
12,331,746 |
||
|
BAE Systems PLC |
2.47 |
11,747,194 |
||
|
Berkshire Hathaway |
2.39 |
11,384,934 |
||
|
DBS Group Holdings |
2.10 |
9,961,578 |
||
|
Alibaba Group Holding |
2.05 |
9,739,512 |
||
|
Inchcape PLC |
1.91 |
9,086,153 |
||
|
United Overseas Bank |
1.83 |
8,697,187 |
||
|
BASF SE |
1.83 |
8,684,850 |
||
|
Cisco Systems |
1.79 |
8,522,457 |
||
|
SCOR SE |
1.73 |
8,207,493 |
||
|
Unilever |
1.71 |
8,121,974 |
||
|
Total Equities |
49.64% |
$235,977,403 |
||
|
Market Cap (US$) |
% FUND |
MARKET VALUE |
||
|
> 50 billion |
35.15% |
$167,095,120 |
||
|
20 – 50 billion |
15.48 |
73,604,853 |
||
|
10 – 25 billion |
12.08 |
57,408,626 |
||
|
2 – 10 billion |
20.83 |
99,023,488 |
||
|
< 2 billion |
11.45 |
54,414,952 |
||
|
Total Equities |
94.99% |
$451,547,039 |
||
|
Cash & Other Assets* |
5.01 |
23,833,671 |
||
|
Total Fund |
100.00% |
$475,380,710 |
||
|
Other Fund Information |
||||
|
Number of Issues |
105 |
|||
|
Net Assets of Fund |
$475.4 million |
|||
|
12-Month Turnover |
11% |
|||
Allocations of investments shown above reflect the Fund’s investments on 06/30/22 and may not be representative of the Fund’s current or future holdings. Data is based on the Fund’s net assets reported as of the close of business on 06/30/22, and may differ from net assets reported in the Fund’s financial statements, which reflect adjustments in accordance with accounting principles generally accepted in the United States.
.
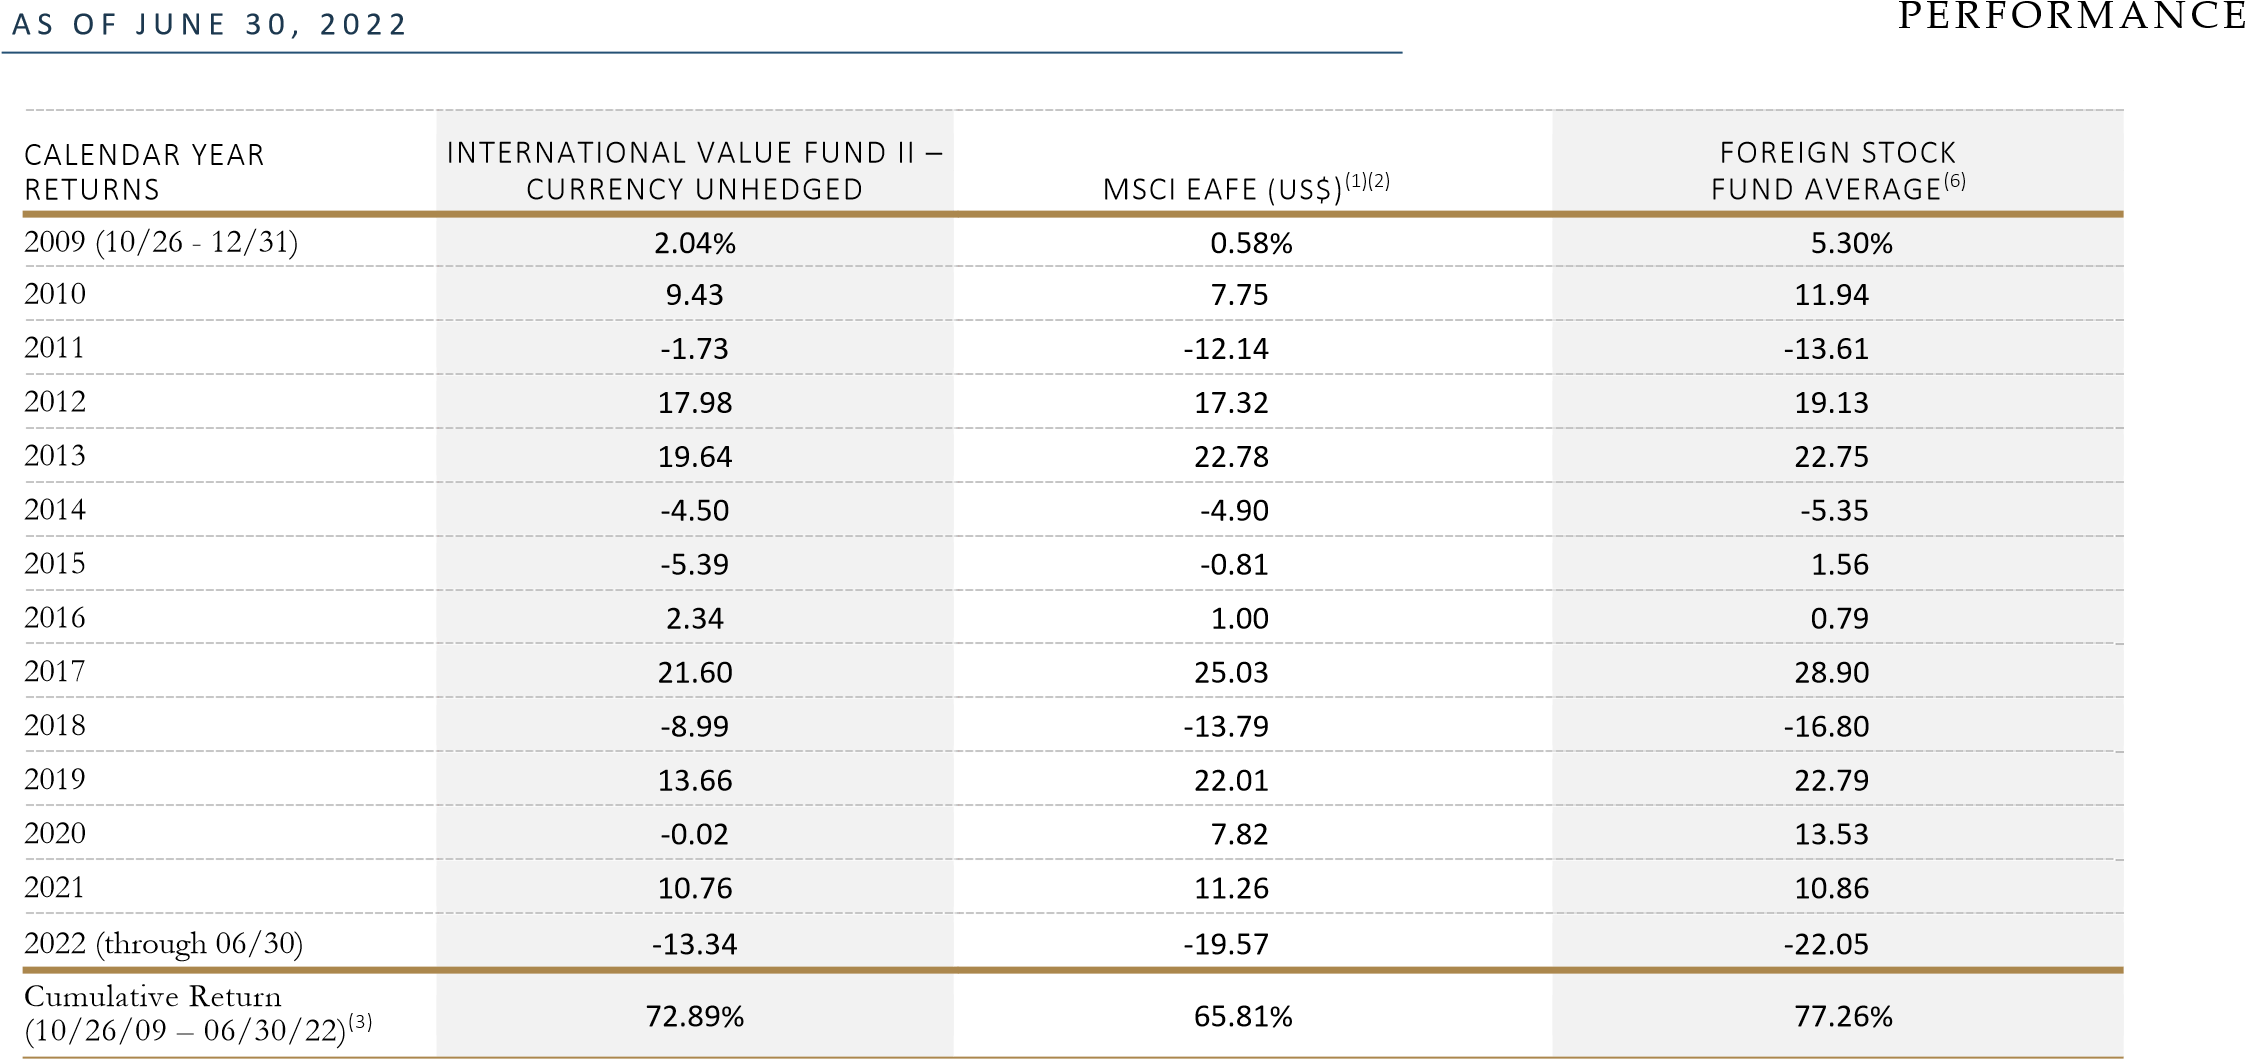
INTERNATIONAL VALUE FUND II – CURRENCY UNHEDGED PERFORMANCE AS OF JUNE 30, 2022
|
AVERAGE ANNUAL TOTAL RETURNS AS OF 06/30/22 |
INTERNATIONAL VALUE FUND II – CURRENCY UNHEDGED |
MSCI EAFE (US$)(1)(2) |
FOREIGN STOCK FUND AVERAGE(6) |
|
1 year |
‐12.77% |
‐17.77% |
‐21.76% |
|
3 years |
‐0.72 |
1.07 |
1.54 |
|
5 years |
1.29 |
2.20 |
2.11 |
|
10 years |
4.18 |
5.40 |
5.77 |
|
Since Inception (10/26/09)(3) |
4.41% |
4.07% |
4.62% |
Total Annual Fund Operating Expense Ratios†*
As of 03/31/2022: 1.37% (gross), 1.34% (NET) // As of 03/31/2021: 1.38% (gross), 1.38% (NET)
The performance shown above represents past performance and is not a guarantee of future results. Investment return and principal value of an investment will fluctuate so that an investor’s shares, when redeemed, may be worth more or less than their original cost. Current performance may be lower or higher than the performance data quoted. Please visit www.tweedy.com to obtain performance data which is current to the most recent month end.
† Tweedy, Browne has voluntarily agreed, through at least July 31, 2023, to waive a portion of the Fund’s investment advisory fees and/or reimburse a portion of the Fund’s expenses to the extent necessary to keep the Fund’s expense ratio in line with the expense ratio of the International Value Fund. (For purposes of this calculation, each Fund’s acquired fund fees and expenses, brokerage costs, interest, taxes and extraordinary expenses are disregarded, and each Fund’s expense ratio is rounded to two decimal points.) Please refer to the Fund’s prospectus for additional information on the Fund’s expenses. The performance data shown above would have been lower had fees and expenses not been waived and/or reimbursed during certain periods.
* The Fund does not impose any front-end or deferred sales charges. The expense ratios shown above reflect the inclusion of acquired fund fees and expenses (i.e., the fees and expenses attributable to investing cash balances in money market funds) and may differ from those shown in the Fund’s financial statements.
Please refer to footnotes (1) through (8) at the end of this commentary for descriptions of the Fundʹs indexes.
VALUE FUND PORTFOLIO (AS OF JUNE 30, 2022)
Performance Attribution
FACTORS WITH THE LARGEST IMPACT ON RETURN, ON AN ABSOLUTE BASIS, AND MEASURED IN LOCAL CURRENCIES.
» Oil & gas, air freight, specialty retail, biotechnology, and industrial conglomerates were among the leading industries while the Fund’s diversified financial services, banks, interactive media, machinery, and chemicals underperformed.
» Top performing countries during the quarter included China, Japan, and Chile, while holdings from the US, Britain, Switzerland, France, and Singapore underperformed during the quarter.
» Top contributing holdings included TotalEnergies, BAE Systems, Rheinmetall, AutoZone, FedEx, and GSK. Declining stocks included Berkshire Hathaway, Alphabet, CNH Industrial, Wells Fargo, Diageo, and Intel.
|
Countries |
% FUND |
MARKET VALUE |
|
Belgium |
0.26% |
$1,040,933 |
|
Canada |
0.74 |
2,974,368 |
|
Chile |
0.19 |
755,174 |
|
China |
6.02 |
24,207,203 |
|
Finland |
0.52 |
2,074,680 |
|
France |
8.97 |
36,071,013 |
|
Germany |
7.90 |
31,732,444 |
|
Hong Kong |
1.23 |
4,933,942 |
|
Italy |
0.42 |
1,677,479 |
|
Japan |
2.93 |
11,761,409 |
|
Mexico |
2.36 |
9,471,642 |
|
Netherlands |
2.31 |
9,296,028 |
|
Philippines |
0.26 |
1,047,150 |
|
Singapore |
1.81 |
7,290,416 |
|
South Korea |
1.26 |
5,049,067 |
|
Sweden |
2.88 |
11,593,893 |
|
Switzerland |
7.56 |
30,371,140 |
|
United Kingdom |
11.84 |
47,603,334 |
|
United States |
34.87 |
140,149,203 |
|
Total Equities |
94.32% |
$379,100,516 |
|
Cash & Other Net Assets* |
3.80 |
15,281,225 |
|
Currency Hedges |
1.87 |
7,531,630 |
|
Total Fund |
100.00% |
$401,913,371 |
|
Industry Sectors |
% FUND |
MARKET VALUE |
|
Communication Services |
9.97% |
$40,085,909 |
|
Consumer Discretionary |
7.28 |
29,245,006 |
|
Consumer Staples |
15.52 |
62,361,571 |
|
Energy |
3.75 |
15,068,237 |
|
Financials |
15.65 |
62,891,835 |
|
Health Care |
13.75 |
55,281,830 |
|
Industrials |
19.71 |
79,205,175 |
|
Information Technology |
2.93 |
11,775,117 |
|
Materials |
4.27 |
17,152,113 |
|
Real Estate |
0.00 |
‐ |
|
Utilities |
1.50 |
6,033,722 |
|
Total Equities |
94.32% |
$379,100,516 |
|
Cash & Other Assets* |
3.80 |
15,281,225 |
|
Currency Hedges |
1.87 |
7,531,630 |
|
Total Fund |
100.00% |
$401,913,371 |
* Includes cash, Treasurys and money market funds.
|
Selected Purchases & Sales |
||||
|
3M Co. |
S |
Iveco Group NV |
S |
|
|
A-Living Smart City Services |
S |
Johnson Service Group |
A |
|
|
Astellas Pharma Inc |
S |
Nabtesco Corporation |
P |
|
|
Bollore SA |
S |
Nifco Inc. |
P |
|
|
Carlisle Companies Inc. |
S |
Norma Group SE |
A |
|
|
Coca-Cola FEMSA |
T |
Paramount Global |
P |
|
|
Deutsche Post |
P |
Safran SA |
A |
|
|
FedEx Corp |
P |
SCOR SE |
T |
|
|
Fresenius SE & Co KGaA |
A |
Zurich Insurance Group |
T |
|
|
Howden Joinery Group PLC |
P |
|||
|
P: PURCHASE A: ADD S: SALE T: TRIM |
TO: TAKEOVER M: MERGER |
|||
|
Top 20 Equity Holdings |
% FUND |
MARKET VALUE |
||
|
Berkshire Hathaway |
6.11% |
$24,537,000 |
||
|
Nestlé |
3.44 |
13,824,804 |
||
|
Alphabet Inc. |
3.33 |
13,402,449 |
||
|
AutoZone, Inc. |
3.30 |
13,281,562 |
||
|
TotalEnergies SE |
3.10 |
12,447,609 |
||
|
Johnson & Johnson |
2.94 |
11,823,586 |
||
|
Safran SA |
2.91 |
11,712,650 |
||
|
Diageo PLC |
2.72 |
10,919,936 |
||
|
Wells Fargo & Company |
2.56 |
10,308,095 |
||
|
CNH Industrial |
2.56 |
10,272,804 |
||
|
Roche Holding |
2.55 |
10,249,434 |
||
|
Heineken Holding |
2.31 |
9,296,028 |
||
|
Unilever |
2.11 |
8,496,653 |
||
|
Fresenius SE & Co. |
1.93 |
7,745,383 |
||
|
GSK PLC |
1.83 |
7,361,345 |
||
|
United Overseas Bank |
1.81 |
7,290,416 |
||
|
National Western Life Ins |
1.70 |
6,832,612 |
||
|
Vertex Pharmaceuticals |
1.67 |
6,713,647 |
||
|
Alibaba Group Holding |
1.61 |
6,454,362 |
||
|
Ionis Pharmaceuticals Inc |
1.51 |
6,061,655 |
||
|
Total Equities |
52.01% |
$209,032,029 |
||
|
Market Cap (US$) |
% FUND |
MARKET VALUE |
||
|
> 50 billion |
45.35% |
$182,268,221 |
||
|
20 – 50 billion |
14.23 |
57,194,768 |
||
|
10 – 25 billion |
11.81 |
47,447,086 |
||
|
2 – 10 billion |
16.23 |
65,235,048 |
||
|
< 2 billion |
6.71 |
26,955,392 |
||
|
Total Equities |
94.32% |
$379,100,516 |
||
|
Cash & Other Assets* |
3.80 |
15,281,225 |
||
|
Currency Hedges |
1.87 |
7,531,630 |
||
|
Total Fund |
100.00% |
$401,913,371 |
||
|
Other Fund Information |
||||
|
Number of Issues |
86 |
|||
|
Net Assets of Fund |
$401.9 million |
|||
|
12-Month Turnover |
22% |
|||
Allocations of investments shown above reflect the Fund’s investments on 06/30/22 and may not be representative of the Fund’s current or future holdings. Data is based on the Fund’s net assets reported as of the close of business on 06/30/22, and may differ from net assets reported in the Fund’s financial statements, which reflect adjustments in accordance with accounting principles generally accepted in the United States.
VALUE FUND PERFORMANCE (AS OF JUNE 30, 2022)
|
CALENDAR YEAR RETURNS |
VALUE FUND |
MSCI WORLD INDEX (HEDGED TO US$)(1)(5) |
S&P 500 (12/08/93‐12/31/06)/ MSCI WORLD INDEX (HEDGED TO US$) (01/01/07‐PRESENT)(1)(4) |
|
1993 (12/08 – 12/31) |
‐0.60% |
5.53% |
0.18% |
|
1994 |
‐0.56 |
‐0.99 |
1.32 |
|
1995 |
36.21 |
20.55 |
37.59 |
|
1996 |
22.45 |
17.94 |
22.97 |
|
1997 |
38.87 |
23.64 |
33.38 |
|
1998 |
9.59 |
21.55 |
28.58 |
|
1999 |
2.00 |
29.09 |
21.04 |
|
2000 |
14.45 |
‐8.45 |
‐9.13 |
|
2001 |
‐0.09 |
‐14.00 |
‐11.88 |
|
2002 |
‐14.91 |
‐24.71 |
‐22.09 |
|
2003 |
23.24 |
24.43 |
28.69 |
|
2004 |
9.43 |
11.01 |
10.88 |
|
2005 |
2.30 |
16.08 |
4.91 |
|
2006 |
11.63 |
16.89 |
15.79 |
|
2007 |
0.60 |
5.61 |
5.61 |
|
2008 |
‐24.37 |
‐38.45 |
‐38.45 |
|
2009 |
27.60 |
26.31 |
26.31 |
|
2010 |
10.51 |
10.46 |
10.46 |
|
2011 |
‐1.75 |
‐5.46 |
‐5.46 |
|
2012 |
15.45 |
15.77 |
15.77 |
|
2013 |
22.68 |
28.69 |
28.69 |
|
2014 |
4.02 |
9.71 |
9.71 |
|
2015 |
‐5.39 |
2.01 |
2.01 |
|
2016 |
9.69 |
9.39 |
9.39 |
|
2017 |
16.46 |
19.13 |
19.13 |
|
2018 |
‐6.39 |
‐6.59 |
‐6.59 |
|
2019 |
16.05 |
28.43 |
28.43 |
|
2020 |
‐1.99 |
14.27 |
14.27 |
|
2021 |
16.16 |
24.38 |
24.38 |
|
2022 (through 06/30) |
‐10.13 |
‐18.00 |
‐18.00 |
|
Cumulative Return (12/08/93 – 06/30/22)(3) |
699.82% |
734.11% |
904.03% |
|
AVERAGE ANNUAL TOTAL RETURNS AS OF 06/30/22 |
VALUE FUND |
MSCI WORLD INDEX (HEDGED TO US$)(1)(5) |
S&P 500 (12/08/93‐12/31/06)/ MSCI WORLD INDEX (HEDGED TO US$) (01/01/07‐PRESENT)(1)(4) |
|
1 year |
‐8.18% |
‐10.72% |
‐10.72% |
|
3 years |
2.05 |
8.48 |
8.48 |
|
5 years |
3.81 |
8.94 |
8.94 |
|
10 years |
6.39 |
11.04 |
11.04 |
|
15 years |
4.58 |
6.00 |
6.00 |
|
20 years |
5.30 |
7.44 |
7.24 |
|
Since Inception (12/08/93)(3) |
7.55% |
7.70% |
8.41% |
Total Annual Fund Operating Expense Ratios†*
As of 03/31/2022: 1.39% (gross), 1.34% (NET) // As of 03/31/2021: 1.41% (gross), 1.38% (NET)
The performance shown above represents past performance and is not a guarantee of future results. Investment return and principal value of an investment will fluctuate so that an investor’s shares, when redeemed, may be worth more or less than their original cost. Current performance may be lower or higher than the performance data quoted. Please visit www.tweedy.com to obtain performance data which is current to the most recent month end.
† Tweedy, Browne has voluntarily agreed, through at least July 31, 2023, to waive a portion of the Fund’s investment advisory fees and/or reimburse a portion of the Fund’s expenses to the extent necessary to keep the Fund’s expense ratio in line with the expense ratio of the International Value Fund. (For purposes of this calculation, each Fund’s acquired fund fees and expenses, brokerage costs, interest, taxes and extraordinary expenses are disregarded, and each Fund’s expense ratio is rounded to two decimal points.) Please refer to the Fund’s prospectus for additional information on the Fund’s expenses. The performance data shown above would have been lower had fees and expenses not been waived and/or reimbursed during certain periods.
* The Fund does not impose any front-end or deferred sales charges. The expense ratios shown above reflect the inclusion of acquired fund fees and expenses (i.e., the fees and expenses attributable to investing cash balances in money market funds) and may differ from those shown in the Fund’s financial statements.
Please refer to footnotes (1) through (8) at the end of this commentary for descriptions of the Fundʹs indexes.
WORLDWIDE HIGH DIVIDEND YIELD VALUE FUND PORTFOLIO (AS OF JUNE 30, 2022)
Performance Attribution
FACTORS WITH THE LARGEST IMPACT ON RETURN, ON AN ABSOLUTE BASIS, AND MEASURED IN LOCAL CURRENCIES.
» Diversified telecommunication services, personal products, distributors, aerospace & defense, and specialty retail companies were among the leading industries while the Fund’s banks, insurance, semiconductor, health care providers, and chemicals companies underperformed.
» Top performing countries during the quarter included Britain, Japan, the Netherlands, China, and South Korea, while holdings from the US, France, Germany, Switzerland, and Singapore underperformed during the quarter.
» Top contributing holdings included BAE Systems, GSK, Orange, Unilever, Inchcape, and Astellas Pharma. Declining stocks included SCOR, Intel, Fresenius Medical, Bank of America, Roche, and BASF.
|
Countries |
% FUND |
MARKET VALUE |
|
China |
2.61% |
$1,918,451 |
|
Finland |
1.88 |
1,376,794 |
|
France |
10.91 |
8,004,733 |
|
Germany |
7.73 |
5,674,562 |
|
Hong Kong |
5.27 |
3,870,635 |
|
Japan |
4.51 |
3,309,522 |
|
Mexico |
5.85 |
4,290,882 |
|
Singapore |
3.97 |
2,916,004 |
|
South Korea |
1.09 |
801,859 |
|
Sweden |
5.04 |
3,700,973 |
|
Switzerland |
11.38 |
8,349,754 |
|
United Kingdom |
16.37 |
12,014,548 |
|
United States |
19.60 |
14,384,718 |
|
Total Equities |
96.23% |
$70,613,433 |
|
Cash & Other Net Assets* |
3.77 |
2,769,205 |
|
Total Fund |
100.00% |
$73,382,638 |
|
Industry Sectors |
% FUND |
MARKET VALUE |
|
Communication Services |
8.63% |
$6,332,859 |
|
Consumer Discretionary |
4.54 |
3,328,529 |
|
Consumer Staples |
18.39 |
13,497,172 |
|
Energy |
0.96 |
700,881 |
|
Financials |
16.90 |
12,398,506 |
|
Health Care |
16.22 |
11,899,056 |
|
Industrials |
19.06 |
13,988,930 |
|
Information Technology |
3.16 |
2,316,390 |
|
Materials |
5.07 |
3,721,429 |
|
Real Estate |
1.05 |
767,636 |
|
Utilities |
2.26 |
1,662,045 |
|
Total Equities |
96.23% |
$70,613,433 |
|
Cash & Other Assets* |
3.77 |
2,769,205 |
|
Total Fund |
100.00% |
$73,382,638 |
* Includes cash, Treasurys and money market funds.
|
Selected Purchases & Sales |
|||
|
3M Co. |
S |
Nabtesco Corporation |
P |
|
Deutsche Post |
P |
Norma Group SE |
P |
|
Howden Joinery Group PLC |
P |
Paramount Global |
P |
|
Johnson Electric Holdings Ltd |
A |
||
|
P: PURCHASE A: ADD S: SALE T: TRIM |
TO: TAKEOVER M: MERGER |
Top 20 Equity Holdings
|
% FUND |
DIV YIELD |
MARKET VALUE |
|
|
Nestlé |
4.96% |
2.51% |
$3,638,228 |
|
Verizon Communications |
4.17 |
5.04 |
3,059,515 |
|
GSK PLC |
4.15 |
4.25 |
3,048,349 |
|
Diageo PLC |
3.97 |
2.09 |
2,916,436 |
|
Roche Holding |
3.28 |
2.92 |
2,405,720 |
|
Johnson & Johnson |
3.24 |
2.55 |
2,379,522 |
|
BAE Systems PLC |
3.03 |
3.02 |
2,225,077 |
|
Trelleborg AB |
3.01 |
2.67 |
2,209,852 |
|
SCOR SE |
2.95 |
8.78 |
2,168,248 |
|
Coca-Cola FEMSA |
2.84 |
4.84 |
2,085,991 |
|
Unilever |
2.75 |
3.94 |
2,019,205 |
|
Safran SA |
2.64 |
0.53 |
1,937,335 |
|
BASF SE |
2.57 |
8.19 |
1,888,436 |
|
Orange SA |
2.27 |
6.24 |
1,662,896 |
|
Rubis SCA |
2.26 |
8.35 |
1,662,045 |
|
Progressive Corp/The |
2.03 |
0.34 |
1,487,675 |
|
United Overseas Bank |
2.02 |
4.57 |
1,480,842 |
|
Inchcape PLC |
1.98 |
3.24 |
1,456,472 |
|
Truist Financial |
1.98 |
4.05 |
1,453,492 |
|
Intel Corporation |
1.97 |
3.90 |
1,449,263 |
|
58.10% |
4.00% |
$42,634,598 |
|
Market Cap (US$) |
% FUND |
MARKET VALUE |
|
> 50 billion |
43.37% |
$31,829,206 |
|
20 – 50 billion |
17.26 |
12,665,826 |
|
10 – 25 billion |
7.04 |
5,164,366 |
|
2 – 10 billion |
22.16 |
16,258,798 |
|
< 2 billion |
6.40 |
4,695,238 |
|
Total Equities |
96.23% |
$70,613,433 |
|
Cash & Other Assets* |
3.77 |
2,769,205 |
|
Total Fund |
100.00% |
$73,382,638 |
|
Other Fund Information |
||
|
Number of Issues |
54 |
|
|
Net Assets of Fund |
$73.4 million |
|
|
12-Month Turnover |
18% |
Allocations of investments shown above reflect the Fund’s investments on 06/30/22 and may not be representative of the Fund’s current or future holdings. Data is based on the Fund’s net assets reported as of the close of business on 06/30/22, and may differ from net assets reported in the Fund’s financial statements, which reflect adjustments in accordance with accounting principles generally accepted in the United States.
WORLDWIDE HIGH DIVIDEND YIELD VALUE FUND PERFORMANCE (AS OF JUNE 30, 2022)
|
CALENDAR YEAR RETURNS |
WORLDWIDE HIGH DIVIDEND YIELD VALUE FUND |
MSCI WORLD INDEX (IN US$)(1)(5) |
MSCI WORLD HIGH DIVIDEND YIELD INDEX (IN US$)(1)(5) |
GLOBAL STOCK FUND AVERAGE(7) |
||
|
2007 (09/05 – 12/31) |
0.32% |
2.57% |
1.15% |
2.16% |
||
|
2008 |
‐29.35 |
‐40.71 |
‐42.98 |
‐41.93 |
||
|
2009 |
28.18 |
29.99 |
32.48 |
35.35 |
||
|
2010 |
7.73 |
11.76 |
6.29 |
13.79 |
||
|
2011 |
4.04 |
‐5.54 |
3.89 |
‐7.96 |
||
|
2012 |
12.34 |
15.83 |
12.24 |
15.84 |
||
|
2013 |
18.77 |
26.68 |
21.91 |
25.20 |
||
|
2014 |
‐0.92 |
4.94 |
2.48 |
2.76 |
||
|
2015 |
‐7.51 |
‐0.87 |
‐3.20 |
‐1.69 |
||
|
2016 |
4.56 |
7.51 |
9.29 |
5.50 |
||
|
2017 |
22.06 |
22.40 |
18.14 |
24.63 |
||
|
2018 |
‐5.61 |
‐8.71 |
‐7.56 |
‐11.94 |
||
|
2019 |
18.55 |
27.67 |
23.15 |
26.09 |
||
|
2020 |
‐4.35 |
15.90 |
‐0.03 |
21.41 |
||
|
2021 |
11.58 |
21.82 |
15.83 |
15.18 |
||
|
2022 (through 06/30) |
‐12.81 |
‐ |
‐20.51 |
‐8.51 |
‐22.03 |
|
|
Cumulative Return (09/05/07 – 06/30/22)(3) |
65.44% |
1 1 |
119.24% |
78.35% |
96.08% |
|
|
AVERAGE ANNUAL TOTAL RETURNS AS OF 06/30/22 |
WORLDWIDE HIGH DIVIDEND YIELD VALUE FUND |
MSCI WORLD INDEX (IN US$)(1)(5) |
MSCI WORLD HIGH DIVIDEND YIELD INDEX (IN US$)(1)(5) |
GLOBAL STOCK FUND AVERAGE(7) |
||
|
1 year |
‐10.45% |
‐14.34% |
‐4.10% |
‐19.54% |
||
|
3 years |
‐0.82 |
7.00 |
4.68 |
4.82 |
||
|
5 years |
2.55 |
7.67 |
5.45 |
5.84 |
||
|
10 years |
4.65 |
9.51 |
7.42 |
8.17 |
||
|
Since Inception (09/05/07)(3) |
3.46% |
5.44% |
3.98% |
4.65% |
||
Total Annual Fund Operating Expense Ratios†*: As of 03/31/2022: 1.48% (gross); 1.34% (NET) // As of 03/31/2021: 1.47% (gross); 1.39% ((NET)) 30‐Day Standardized Yield as of 06/30/2022: 2.24% (Subsidized); 2.20% (Unsubsidized)
The performance shown above represents past performance and is not a guarantee of future results. Investment return and principal value of an investment will fluctuate so that an investor’s shares, when redeemed, may be worth more or less than their original cost. Current performance may be lower or higher than the performance data quoted. Please visit www.tweedy.com to obtain performance data which is current to the most recent month end.
† Tweedy, Browne has voluntarily agreed, through at least July 31, 2023, to waive a portion of the Fund’s investment advisory fees and/or reimburse a portion of the Fund’s expenses to the extent necessary to keep the Fund’s expense ratio in line with the expense ratio of the International Value Fund. (For purposes of this calculation, each Fund’s acquired fund fees and expenses, brokerage costs, interest, taxes and extraordinary expenses are disregarded, and each Fund’s expense ratio is rounded to two decimal points.) Please refer to the Fund’s prospectus for additional information on the Fund’s expenses. The performance data shown above would have been lower had fees and expenses not been waived and/or reimbursed during certain periods.
* The Fund does not impose any front-end or deferred sales charges. The expense ratios shown above reflect the inclusion of acquired fund fees and expenses (i.e., the fees and expenses attributable to investing cash balances in money market funds) and may differ from those shown in the Fund’s financial statements.
Please refer to footnotes (1) through (8) at the end of this commentary for descriptions of the Fundʹs indexes.
NOTES
- Indexes are unmanaged, and the figures for the indexes shown include reinvestment of dividends and capital gains distributions and do not reflect any fees or expenses. Investors cannot invest directly in an index.
- The MSCI EAFE Index is a free float‐adjusted, market capitalization weighted index that is designed to measure the equity market performance of developed markets, excluding the US and Canada. The MSCI EAFE Index (in US$) reflects the return of the MSCI EAFE Index for a US dollar investor. The MSCI EAFE Index (Hedged to US$) consists of the results of the MSCI EAFE Index hedged 100% back into US dollars and accounts for interest rate differentials in forward currency exchange rates. Results for each index are inclusive of dividends and net of foreign withholding taxes.
- Inception dates for the International Value Fund, International Value Fund II, Value Fund and Worldwide High Dividend Yield Value Fund are June 15, 1993, October 26, 2009, December 8, 1993, and September 5, 2007, respectively. Prior to 2004, information with respect to the MSCI EAFE and MSCI World Indexes used was available at month end only; therefore, the since‐inception performance of the MSCI EAFE Indexes quoted for the International Value Fund reflects performance from May 31, 1993, the closest month end to the International Value Fund’s inception date, and the since inception performance of the MSCI World Index quoted for the Value Fund reflects performance from November 30, 1993, the closest month end to the Value Fund’s inception date. Information with respect to the Morningstar Foreign Stock Fund Average is available at month end only; therefore the closest month end to the inception date of the International Value Fund, May 31, 1993, was used; and closest month end to the inception date of International Value Fund II, October 31, 2009, was used.
- The S&P 500/MSCI World Index (Hedged to US$) is a combination of the S&P 500 Index and the MSCI World Index (Hedged to US$), linked together by Tweedy, Browne, and represents the performance of the S&P 500 Index for the periods 12/08/93 – 12/31/06 and the performance of the MSCI World Index (Hedged to US$) beginning 01/01/07 and thereafter (beginning December 2006, the Fund was permitted to invest more significantly in non‐US securities). The S&P 500 Index is a market capitalization weighted index composed of 500 widely held common stocks that assumes the reinvestment of dividends. The index is generally considered representative of US large capitalization stocks.
- The MSCI World Index is a free float‐adjusted market capitalization weighted index that is designed to measure the equity market performance of developed markets. The MSCI World Index (in US$) reflects the return of this index for a US dollar investor. The MSCI World Index (Hedged to US$) consists of the results of the MSCI World Index with its foreign currency exposure hedged 100% back into US dollars. The index accounts for interest rate differentials in forward currency exchange rates. The MSCI World High Dividend Yield Index reflects the performance of equities in the MSCI World Index (excluding REITs) with higher dividend income and quality characteristics than average dividend yields that are both sustainable and persistent. The index also applies quality screens and reviews 12‐month past performance to omit stocks with potentially deteriorating fundamentals that could force them to cut or reduce dividends. The MSCI World High Dividend Yield Index (in US$) reflects the return of the MSCI World High Dividend Yield Index for a US dollar investor. Results for each index are inclusive of dividends and net of foreign withholding taxes.
- Since September 30, 2003, the Foreign Stock Fund Average is calculated by Tweedy, Browne based on data provided by Morningstar and reflects average returns or portfolio turnover rates of all mutual funds in the Morningstar Foreign Large‐Value, Foreign Large‐Blend, Foreign Large‐Growth, Foreign Small/Mid‐Value, Foreign Small/Mid‐Blend, and Foreign Small/Mid‐Growth categories. Funds in these categories typically invest in international stocks and have less than 20% of their assets invested in US stocks. These funds may or may not be hedged to the US dollar, which will affect reported returns. References to “Foreign Stock Funds” or the “Foreign Stock Fund Average” that predate September 30, 2003 are references to Morningstar’s Foreign Stock Funds and Foreign Stock Fund Average, respectively, while references to Foreign Stock Funds and the Foreign Stock Fund Average for the period beginning September 30, 2003 refer to Foreign Stock Funds and the Foreign Stock Fund Average as calculated by Tweedy, Browne. Content reproduced from Morningstar is ©2021 Morningstar, Inc. All Rights Reserved. The information contained herein: (1) is proprietary to Morningstar and/or its content providers; (2) may not be copied or distributed; and (3) is not warranted to be accurate, complete or timely. Neither Morningstar nor its content providers are responsible for any damages or losses arising from any use of this information. Past performance is no guarantee of future results.
- Since April 28, 2017, the Global Stock Fund Average is calculated by Tweedy, Browne based on data provided by Morningstar, and reflects average returns or portfolio turnover rates of all mutual funds in the Morningstar Global Large Stock (including Global Large Value, Global Large Growth, and Global Large Blend categories) and Global Small/Mid Stock categories. Prior to April 28, 2017, the Global Stock Fund Average was calculated by Morningstar. Funds in these categories typically invest in stocks throughout the world while maintaining a percentage of their assets (normally 20% ‐ 60%) invested in US stocks. These funds may or may not be hedged to the US dollar, which will affect reported returns. References to “Global Stock Funds” or the “Global Stock Fund Average” that predate April 28, 2017 are references to Morningstar’s Global Stock Funds and Global Stock Fund Average, respectively, while references to Global Stock Funds and the Global Stock Fund Average for the period beginning April 28, 2018 refer to the Global Stock Funds and Global Stock Fund Average as calculated by Tweedy, Browne. Content reproduced from Morningstar is ©2022 Morningstar, Inc. All Rights Reserved. The information contained herein: (1) is proprietary to Morningstar and/or its content providers; (2) may not be copied or distributed; and (3) is not warranted to be accurate, complete or timely. Neither Morningstar nor its content providers are responsible for any damages or losses arising from any use of this information. Past performance is no guarantee of future results.
As of June 30, 2022, the International Value Fund, International Value Fund II, Value Fund, and Worldwide High Dividend Yield Value Fund had each invested the following percentages of its net assets, respectively, in the following portfolio holdings:
|
International Value Fund |
Int’l Value Fund II |
Value Fund |
Worldwide High Div |
|
|
3M Co. |
0.0% |
0.0% |
0.0% |
0.0% |
|
A‐Living Smart City |
0.0% |
0.4% |
0.0% |
0.0% |
|
Astellas Pharma |
0.0% |
0.0% |
0.0% |
1.0% |
|
AutoZone |
0.0% |
3.1% |
3.3% |
0.0% |
|
BAE Systems |
2.9% |
2.5% |
1.3% |
3.0% |
|
Baidu |
1.4% |
1.4% |
1.1% |
0.0% |
|
Bank of America |
0.0% |
0.0% |
0.6% |
1.7% |
|
BASF |
1.1% |
1.8% |
1.0% |
2.6% |
|
Berkshire Hathaway |
3.0% |
2.4% |
6.1% |
0.0% |
|
Bollore |
0.8% |
0.4% |
0.0% |
0.0% |
|
Carlisle |
0.0% |
0.0% |
0.0% |
0.0% |
|
China Banking |
0.0% |
0.1% |
0.0% |
0.0% |
|
CK Hutchison |
0.9% |
0.9% |
0.8% |
1.6% |
|
CNH Industrial |
3.0% |
3.2% |
2.6% |
0.0% |
|
Coca‐Cola FEMSA |
1.5% |
1.4% |
1.1% |
2.8% |
|
Covea |
0.0% |
0.0% |
0.0% |
0.0% |
|
Dali Foods |
0.4% |
0.7% |
0.4% |
1.5% |
|
DBS Group |
2.4% |
2.1% |
0.0% |
2.0% |
|
Deutsche Post |
0.5% |
1.0% |
1.0% |
1.0% |
|
Diageo |
4.0% |
3.2% |
2.7% |
4.0% |
|
FedEx |
0.0% |
0.0% |
1.2% |
0.0% |
|
GSK |
3.2% |
2.8% |
1.8% |
4.2% |
|
Howden Joinery |
0.2% |
0.5% |
0.5% |
0.5% |
|
Inchcape |
0.8% |
1.9% |
0.6% |
2.0% |
|
Industrias Bachoco |
0.3% |
0.6% |
0.6% |
1.3% |
|
Intel |
0.0% |
0.0% |
1.4% |
2.0% |
|
0.0% |
0.0% |
0.0% |
0.0% |
|
|
Johnson & Johnson |
2.4% |
2.7% |
2.9% |
3.2% |
|
Kamigumi |
0.0% |
0.1% |
0.0% |
0.0% |
|
Kemira |
0.5% |
0.5% |
0.5% |
1.9% |
|
Kuraray |
0.5% |
0.5% |
0.5% |
0.6% |
|
Megacable |
0.4% |
1.3% |
0.7% |
1.8% |
|
Nabtesco |
0.5% |
0.5% |
0.5% |
0.5% |
|
Nestlé |
5.2% |
3.3% |
3.4% |
5.0% |
|
NGK Spark Plug |
0.3% |
0.0% |
0.0% |
0.0% |
|
Nifco |
0.2% |
0.3% |
0.3% |
0.0% |
|
Orange |
0.0% |
0.0% |
0.0% |
2.3% |
|
Progressive |
0.0% |
0.0% |
0.0% |
2.0% |
|
Rheinmetall |
0.3% |
1.4% |
1.3% |
0.0% |
|
Roche Holding |
3.1% |
3.2% |
2.6% |
3.3% |
|
Safran |
2.8% |
3.0% |
2.9% |
2.6% |
|
Samchully |
0.0% |
0.0% |
0.0% |
0.0% |
|
SCOR |
2.1% |
1.7% |
1.0% |
3.0% |
|
Shanghai Mechanical |
0.4% |
0.3% |
0.3% |
0.0% |
|
SKF |
1.0% |
1.0% |
0.9% |
1.0% |
|
Standard Chartered |
0.0% |
0.0% |
0.0% |
0.0% |
|
Sumitomo Heavy Industries |
0.5% |
0.5% |
0.5% |
0.5% |
|
TotalEnergies |
3.5% |
2.8% |
3.1% |
0.0% |
|
Transcosmos |
0.3% |
0.3% |
0.2% |
0.0% |
|
Truist Financial |
0.0% |
0.0% |
0.6% |
2.0% |
|
Unilever |
1.6% |
1.7% |
0.2% |
2.8% |
|
Uni‐President |
0.2% |
0.5% |
0.5% |
1.1% |
|
United Overseas Bank |
2.7% |
1.8% |
1.8% |
2.0% |
|
UPS |
0.0% |
0.0% |
0.0% |
0.0% |
|
Vertex Pharmaceuticals |
0.0% |
0.0% |
1.7% |
0.0% |
|
Vitol |
0.0% |
0.0% |
0.0% |
0.0% |
|
Vivo Energy |
0.0% |
0.0% |
0.0% |
0.0% |
|
Wells Fargo |
0.0% |
0.0% |
2.6% |
0.0% |
|
WH Group |
0.3% |
0.3% |
0.3% |
0.0% |
The above listed portfolio holdings reflect the Funds’ investments on the date indicated and may not be representative of the Funds’ current or future holdings. Selected Purchases & Sales illustrate some or all of the largest purchases and sales made for each Fund during the preceding quarter and may not include all purchases and sales. Some “undisclosed” names may have been withheld where disclosure may be disadvantageous to a Fund’s accumulation or disposition program.
Earnings before interest and taxes (or EBIT) is an indicator of a company’s profitability, calculated as revenue minus expenses, excluding tax and interest. Return on Equity (ROE) is a measure of financial performance calculated by dividing net income by shareholders’ equity. Enterprise Value (or EV) is a measure of a company’s total value (market value of common stock + market value of preferred equity + market value of debt + minority interest – cash and investments).
Current and future portfolio holdings are subject to risk. The securities of small, less well‐known companies may be more volatile than those of larger companies. In addition, investing in foreign securities involves additional risks beyond the risks of investing in securities of US markets. These risks which are more pronounced in emerging markets, include economic and political considerations not typically found in US markets, including currency fluctuation, political uncertainty and different financial standards, regulatory environments, and overall market and economic factors in the countries.
Force majeure events such as pandemics and natural disasters are likely to increase the risks inherent in investments and could have a broad negative impact on the world economy and business activity in general. Value investing involves the risk that the market will not recognize a security’s intrinsic value for a long time, or that a security thought to be undervalued may actually be appropriately priced when purchased. Dividends are not guaranteed, and a company currently paying dividends may cease paying dividends at any time.
Diversification does not guarantee a profit or protect against a loss in declining markets. Investors should refer to the prospectus for a description of risk factors associated with investments in securities held by the Funds.
Although the practice of hedging against currency exchange rate changes utilized by the International Value Fund and Value Fund reduces the risk of loss from exchange rate movements, it also reduces the ability of the Funds to gain from favorable exchange rate movements when the US dollar declines against the currencies in which the Funds’ investments are denominated and may impose costs on the Funds. As a result of practical considerations, fluctuations in a security’s prices, and fluctuations in currencies, a Fund’s hedges are expected to approximate, but will generally not equal, the Fund’s perceived foreign currency risk.
Stocks and bonds are subject to different risks. In general, stocks are subject to greater price fluctuations and volatility than bonds and can decline significantly in value in response to adverse issuer, political, regulatory, market or economic developments. Unlike stocks, if held to maturity, bonds generally offer to pay both a fixed rate of return and a fixed principal value. Bonds are subject to interest rate risk (as interest rates rise bond prices generally fall), the risk of issuer default, issuer credit risk, and inflation risk.
This commentary contains opinions and statements on investment techniques, economics, market conditions and other matters. There is no guarantee that these opinions and statements will prove to be correct, and some of them are inherently speculative. None of them should be relied upon as statements of fact. The views expressed herein represent the opinions of Tweedy, Browne Company LLC as of the date of this commentary, are not intended as a forecast or a guarantee of future results, or investment advice and are subject to change without notice.
Tweedy, Browne International Value Fund, Tweedy, Browne International Value Fund II – Currency Unhedged, Tweedy, Browne Value Fund, and
Tweedy, Browne Worldwide High Dividend Yield Value Fund are distributed by AMG Distributors, Inc., Member FINRA/SIPC.
This material must be preceded or accompanied by a current prospectus for Tweedy, Browne Fund Inc. You should consider the Funds’ investment objectives, risks, charges and expenses carefully before investing. The prospectus contains this and other information about the Funds. The prospectus should be read carefully before investing.
Editor’s Note: The summary bullets for this article were chosen by Seeking Alpha editors.
Be the first to comment