

anyaberkut
Retirees have had a rough 2022 to say the least.
Charlie Bilello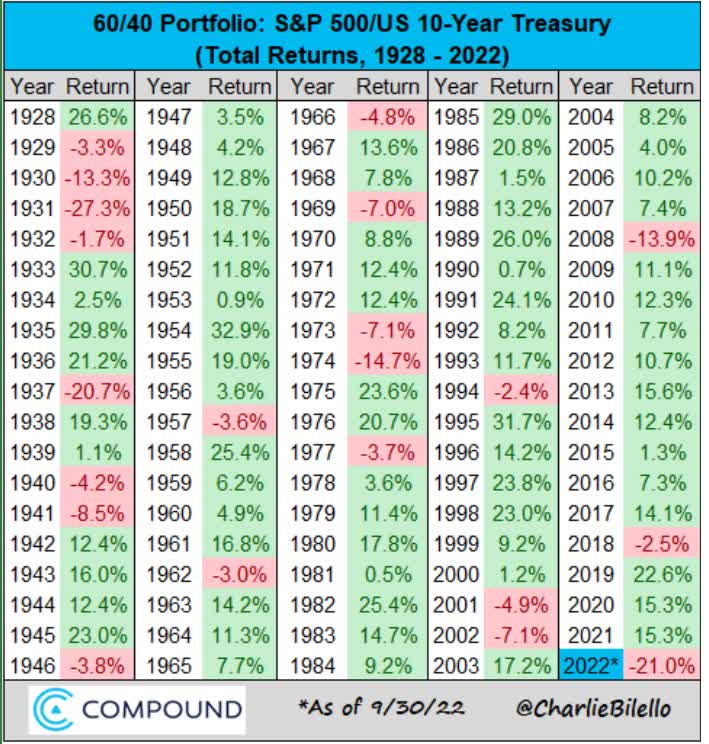
The worst bond bear market in history means that for the first time ever, both stocks and bonds are down double-digits, resulting in the 2nd worst return for a 60/40 in history.
And to make matters worse, inflation, and thus the Fed, are causing some truly historical volatility.
Daily Shot 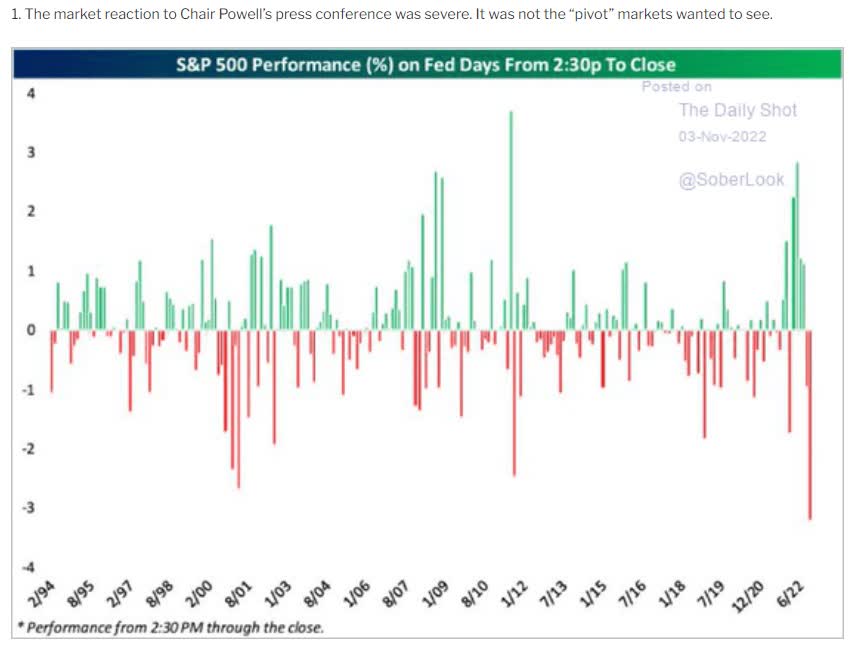
Last week we had the worst Fed day collapse in history, with stocks falling 3.7% in 90 minutes, because the Fed didn’t give the market the pivot it was hoping for.
But there is a silver lining to the Fed’s inflation-fighting warpath.
depositaccounts.com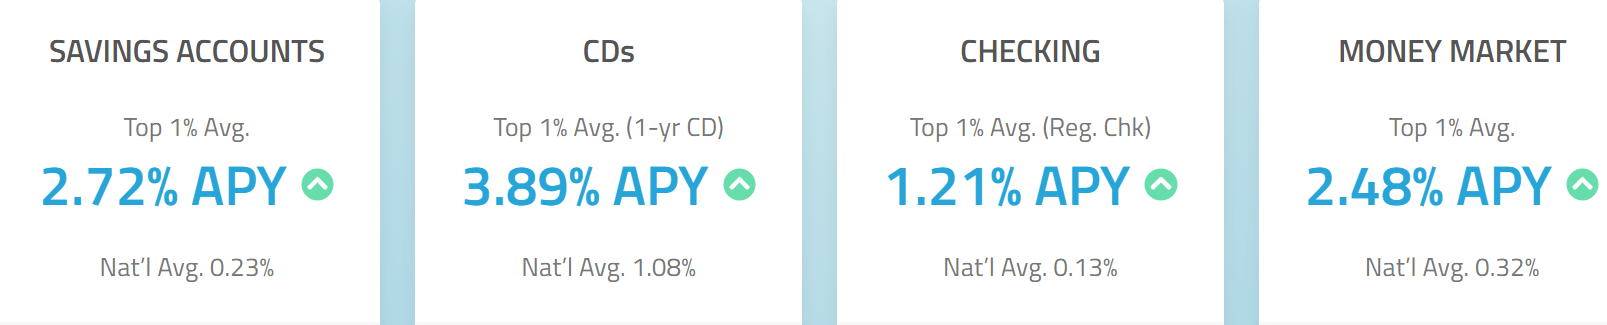
Risk-free FDIC savings account yields have soared in this tightening cycle, and these averages don’t even include the most recent 75 basis point hike.
- the bond market expects another 1.5% of hikes before the Fed pauses for 12 to 24 months
Pre-Fed Rate Hike (depositaccounts.com)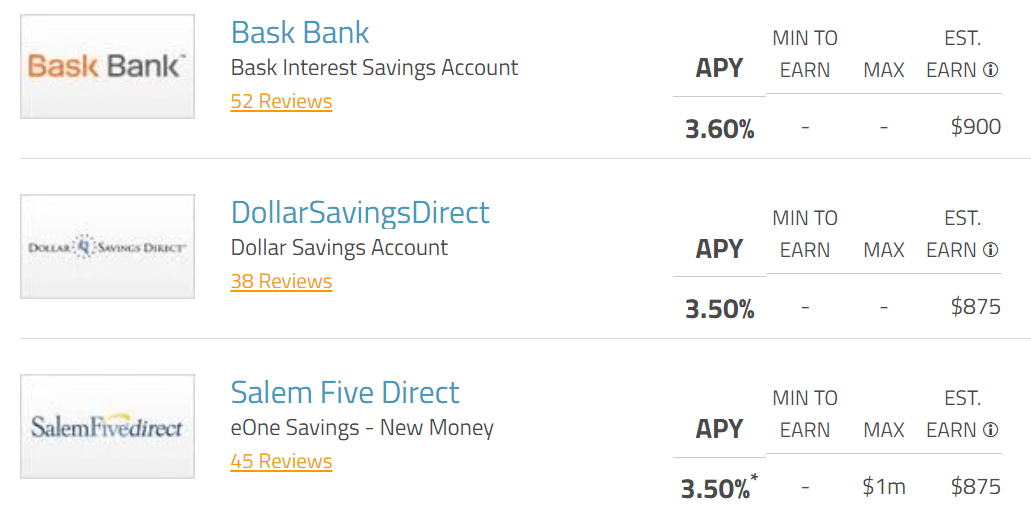
You can now find FDIC insured, risk-free high-yield savings that are as high as 50 basis points above the Fed funds rate.
- 5.5% to 5.75% likely peak risk-free yield coming within a few months
For your emergency funds, which shouldn’t be invested in the stock market at all, the ability to earn over 5% for 1 to 2 years is a blessing, not a curse.
Long-term, the Fed expects the Fed funds rate to normalize at 2% to 3% (the bond market thinks 3%) meaning that in the future, risk-free yield (with no duration or volatility risk and instant liquidity) of 2.5% to 3.5% is likely.
- compared to 2.3% the bond market’s 30-year inflation expectations
- 0.2% to 1.2% real risk-free yield
After a decade of effectively zero real risk-free yield, savers are facing a potential golden age.
But high savings accounts (DollarSavingsDirect has the highest customer reviews among the ultra-yielding savings accounts) are just for emergency funds.
They might be sky-high compared to the 0.5% you could get during the ZIRP era that’s just ended, but you’re not going to retire in safety and splendor, or retire at all, earning a risk-free yield.
That’s where the power of ultra-yield dividend growth blue-chips comes in.
Now we all have our favorite ultra-yield names, slow growing mature businesses such as dividend king Altria (MO). But these kinds of ultra-yielding stocks tend to be slow growing.
But there are a handful of fast-growing ultra-yielding blue-chips that aren’t just growing at a good clip, they are growing at double-digits, faster than the S&P 500 and dividend aristocrats.
- S&P long-term growth consensus 8.5% CAGR
- dividend aristocrats long-term growth consensus 8.6%
So let me share with you my two favorite ultra-yield blue-chips growing at double-digits that aren’t just potentially great high-yield options for retirees today, they are potential rich retirement dream stocks, in my opinion.
Companies that I believe can potentially turbocharge your retirement income and help you retire in safety and splendor, no matter what the economy or stock market does in the coming years and decades.
Keyera (OTCPK:KEYUF): The Best Monthly Dividend Ultra-Yield Blue-Chip You’ve Never Heard Of
- Full Investment Thesis: Keyera: 6.2%-Yielding Monthly Dividend Blue Chip Made For Turbulent Times
- Full investment thesis, risk profile, and growth outlook
Tax Implications
- Canadian company
- 1099 tax form, qualified dividends (paid monthly)
- 15% dividend tax withholding except in retirement accounts
- tax credit available for taxable accounts to recoup the withholding
- own in retirement accounts to avoid paperwork and the withholding tax
Investor Presentation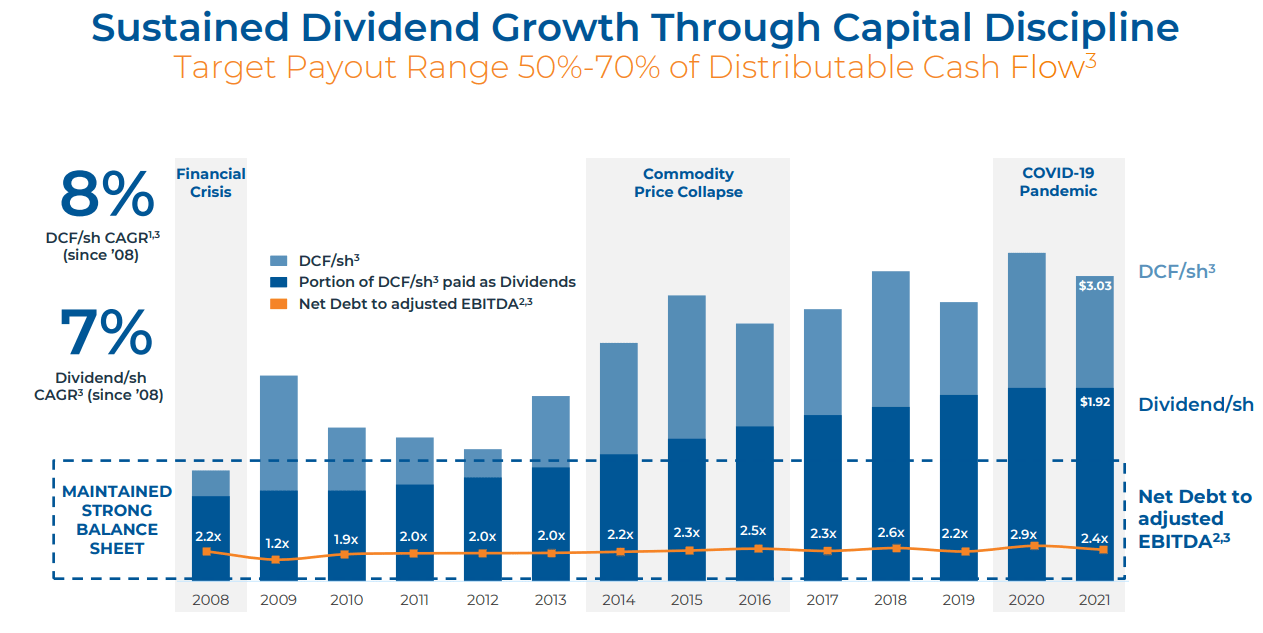
Keyera is one of the best monthly high-yield blue-chips you’ve never heard of, able to deliver relatively consistent cash flow growth and safe dividends even in the worst economic and industry conditions.
That’s thanks to management’s focus on a strong balance sheet, including one of the lowest leverage ratios in the industry, never rising above 2.9X even when oil hit -$38 in April 2020.
Investor Presentation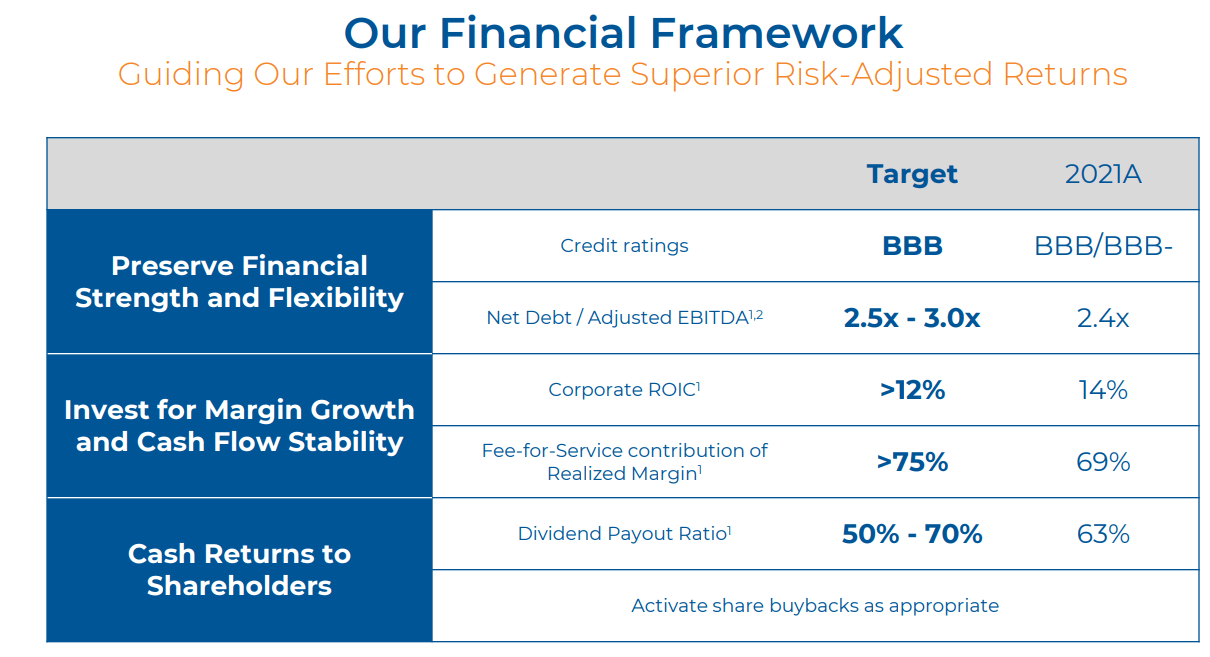
Management targets a 50% to 70% DCF payout ratio and in 2022 analysts are expecting 66%.
- 83% is considered safe for this industry according to rating agencies
Management’s long-term leverage range is 2.5 to 3X net debt/adjusted EBITDA, and rating agencies consider 5.0X or less safe.
Long-term, management is focused on getting at least 75% of cash flow from fee-for service (commodity price insensitive) contracts and its growth backlog of projects is focused on getting them to 75% to 80%.
Reasons To Potentially Buy Keyera Today
| Metric | Keyera |
| Quality | 84% 13/13 Quality Ultra SWAN (Sleep Well At Night) Midstream |
| Risk Rating | Medium Risk |
| DK Master List Quality Ranking (Out Of 500 Companies) | 215 |
| Quality Percentile | 58% |
| Dividend Growth Streak (Years) |
0 (no dividend cuts since at least 2010) |
| Dividend Yield | 6.5% |
| Dividend Safety Score | 85% |
| Average Recession Dividend Cut Risk | 0.5% |
| Severe Recession Dividend Cut Risk | 1.80% |
| S&P Credit Rating | BBB stable |
| 30-Year Bankruptcy Risk | 7.50% |
| LT S&P Risk-Management Global Percentile |
56% Average, Medium Risk |
| Fair Value | $28.93 |
| Current Price | $21.70 |
| Discount To Fair Value | 25% |
| DK Rating |
Potential Very Strong Buy |
| Price/Cash Flow | 7.5 (anti-bubble blue-chip) |
| Growth Priced In | -2.0% |
| Historical P/Cash Flow | 11 to 12.5 |
| LT Growth Consensus/Management Guidance | 10.6% |
| 5-year consensus total return potential |
16% to 22% CAGR |
| Base Case 5-year consensus return potential |
21% CAGR (3X the S&P 500) |
| Consensus 12-month total return forecast | 25% |
| Fundamentally Justified 12-Month Return Potential | 40% |
| LT Consensus Total Return Potential | 17.1% |
| Inflation-Adjusted Consensus LT Return Potential | 14.8% |
| Consensus 10-Year Inflation-Adjusted Total Return Potential (Ignoring Valuation) | 3.98 |
| LT Risk-Adjusted Expected Return | 11.07% |
| LT Risk-And Inflation-Adjusted Return Potential | 8.78% |
| Conservative Years To Double | 8.2 vs 15.4 S&P 500 |
(Source: Dividend Kings Zen Research Terminal)
Keyera is trading at one of its lowest valuations in history, outside of the Pandemic oil crash when crude traded negative.
It trades at 7.5X cash flow, a 25% historical discount to its normal market-determined long-term fair value of 11 to 12.5X.
Keyera 2024 Consensus Total Return Potential
(Source: FAST Graphs, FactSet)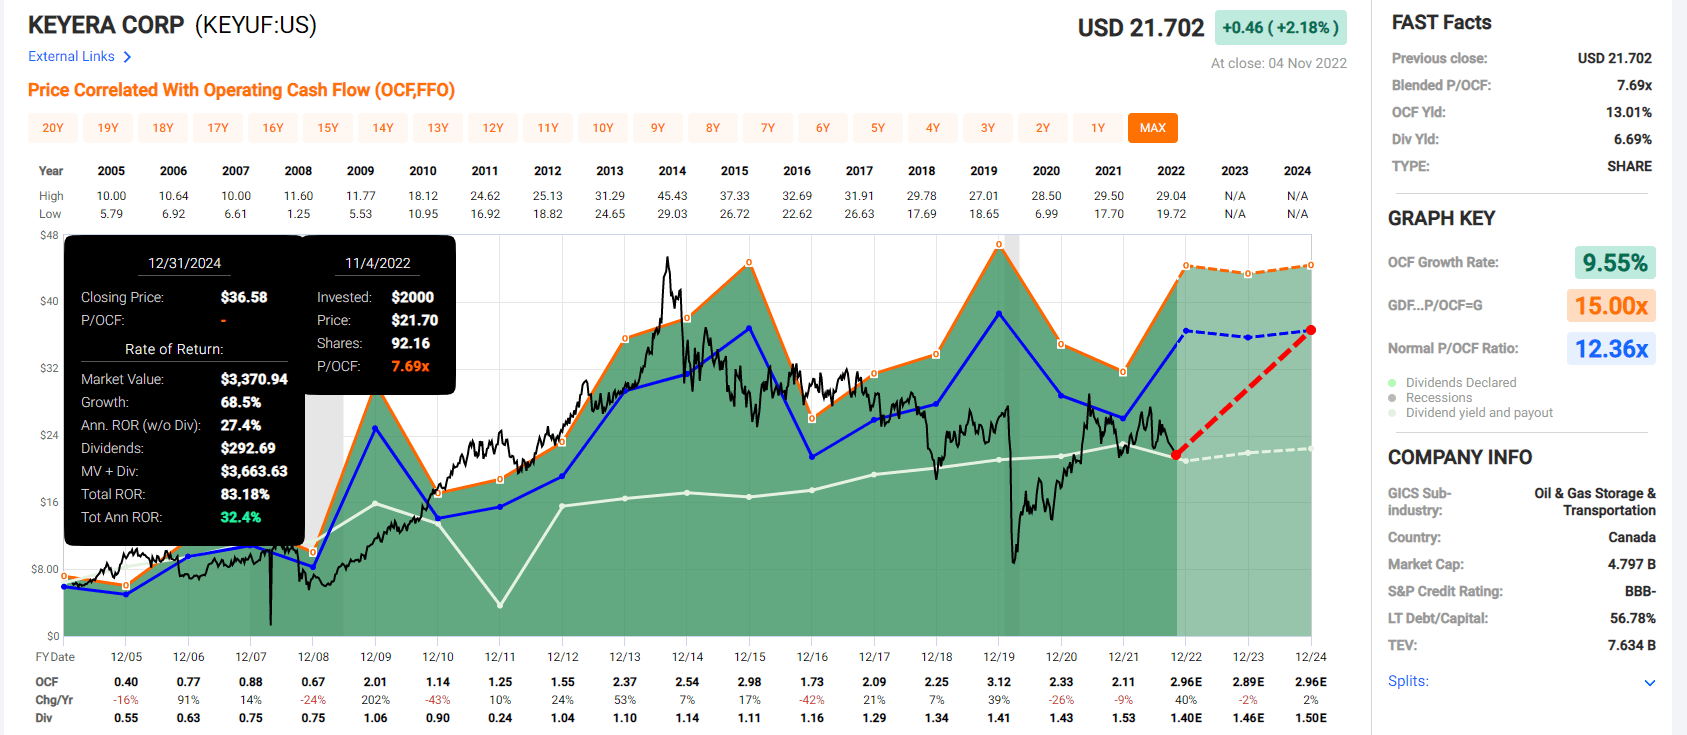
If Keyera grows as expected and returns to historical fair value by 2024, that’s a potential 83% total return or 33% annually.
- Buffett-like return potential from a blue-chip bargain hiding in plain sight
- about 3X better than the S&P 500 consensus
Keyera 2027 Consensus Total Return Potential
(Source: FAST Graphs, FactSet)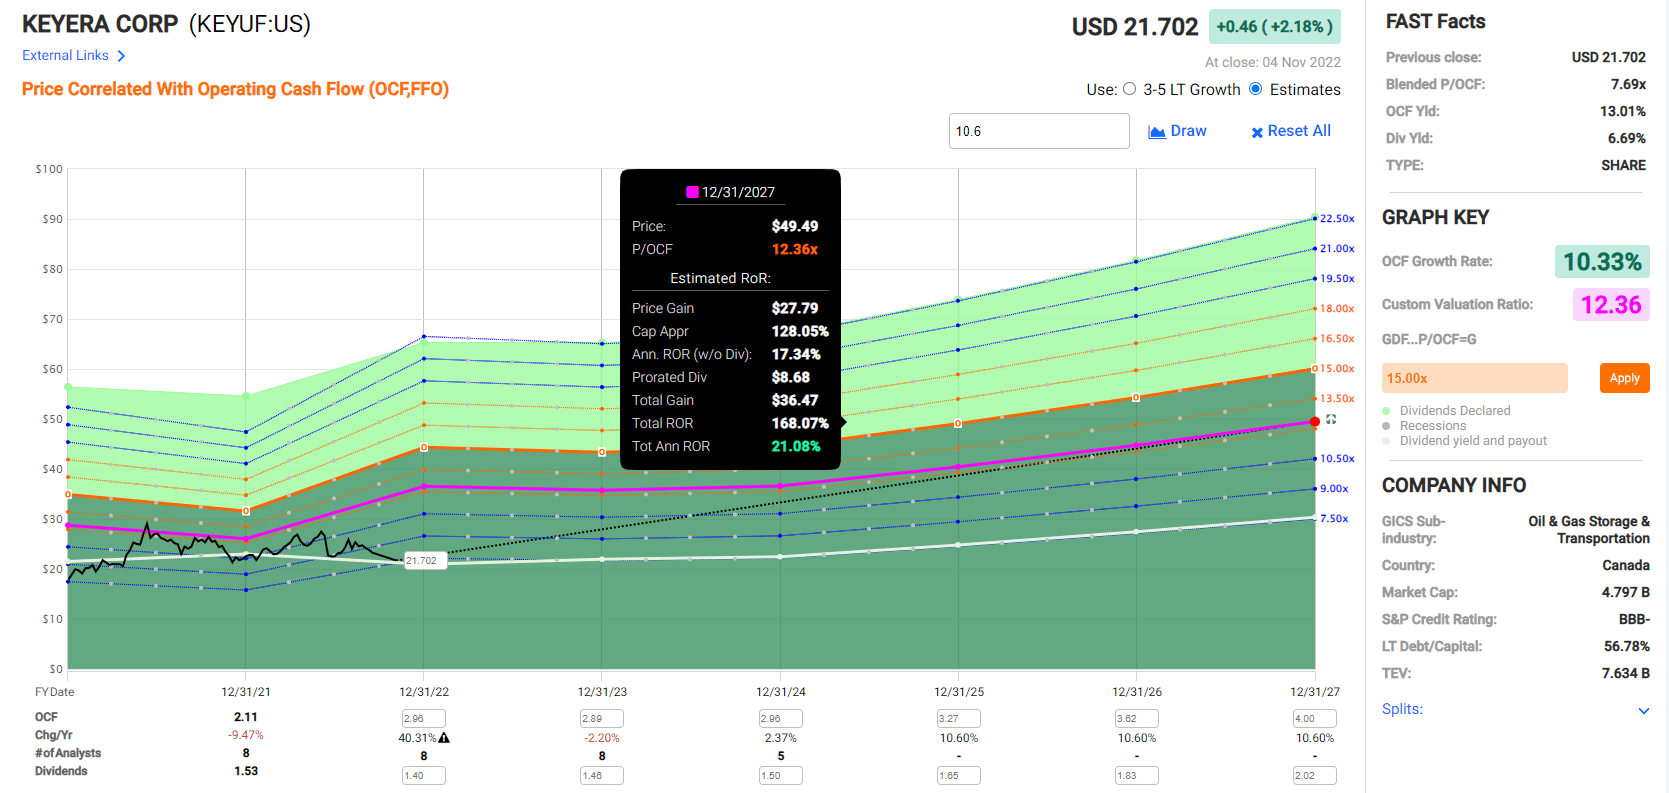
If Keyera grows as expected and returns to historical market-determined fair value by 2027, it could deliver 168% total returns or a Buffett-like 21% CAGR.
- 3X better than the S&P 500
Keyera Total Returns Since 2003
(Source: Portfolio Visualizer Premium)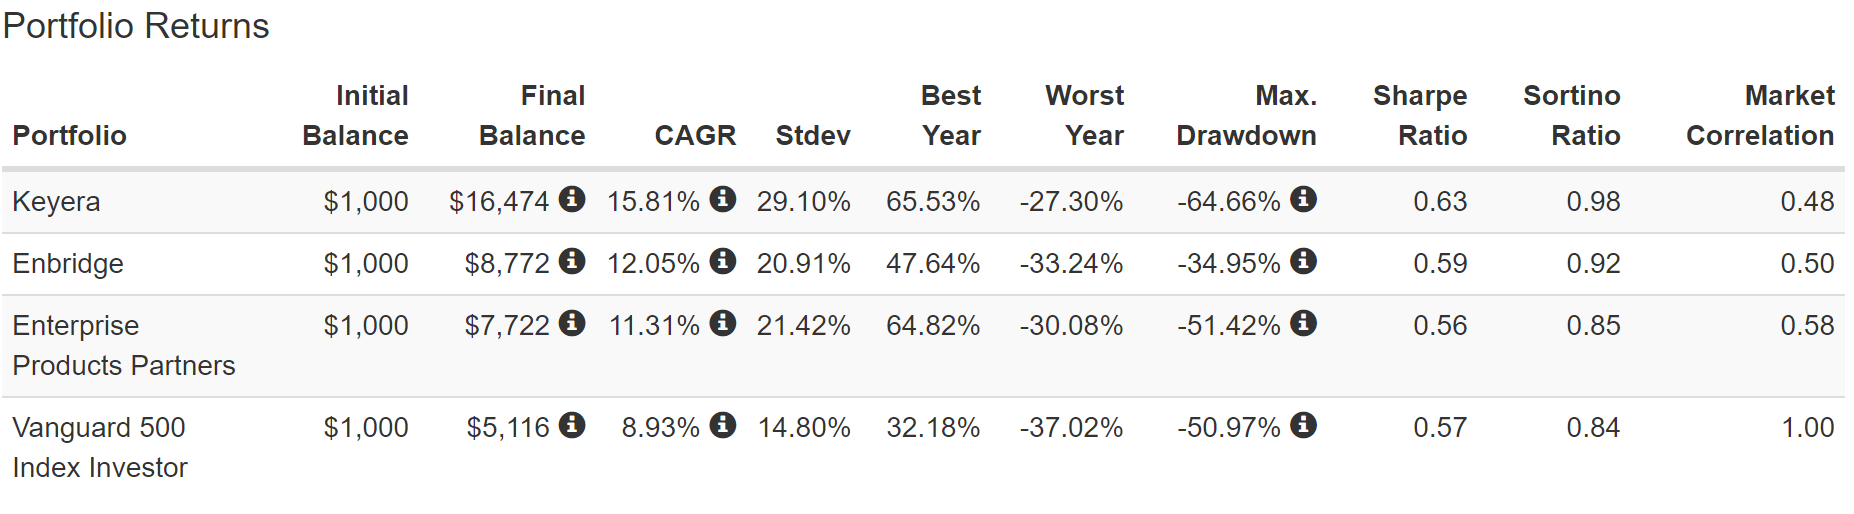
Keyera has been delivering excellent market crushing returns for almost 20 years, and from bear market lows is capable of Buffett-like 20% annual returns for 15 years.
(Source: Portfolio Visualizer Premium)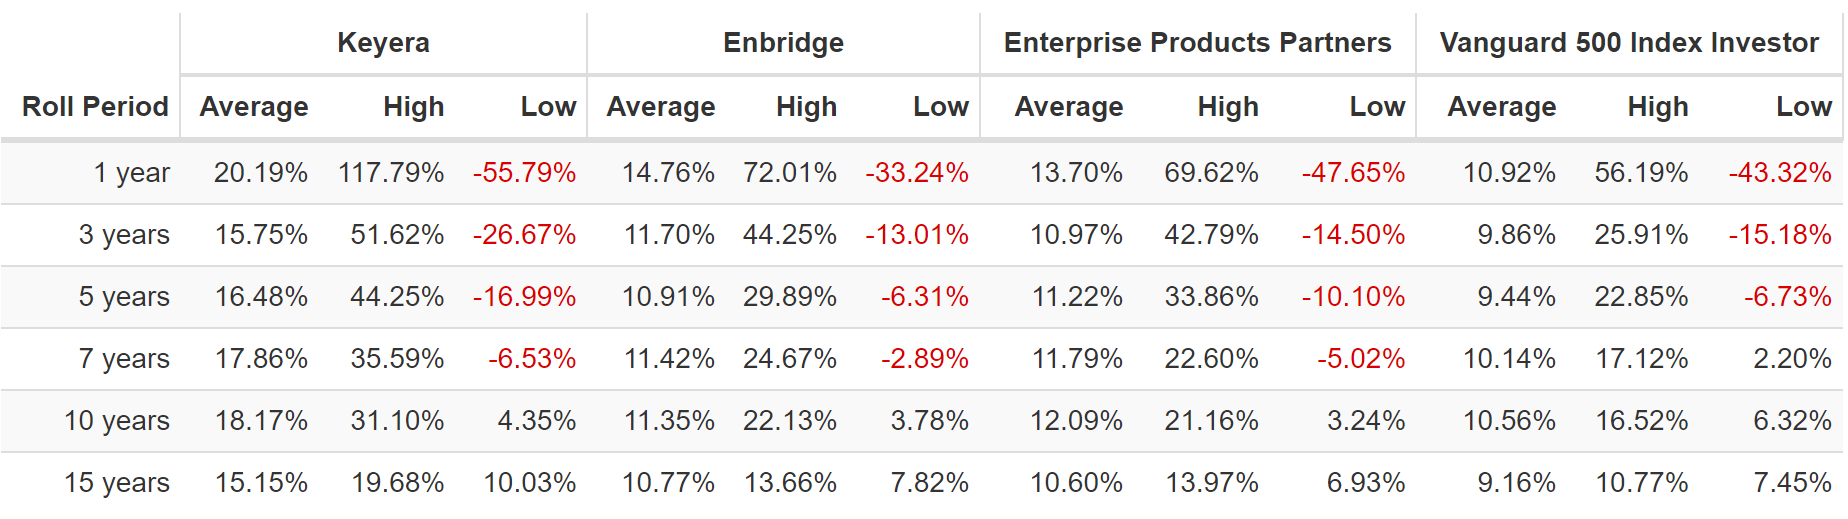
Up to 15.4X total return over 15 years.
(Source: Portfolio Visualizer Premium)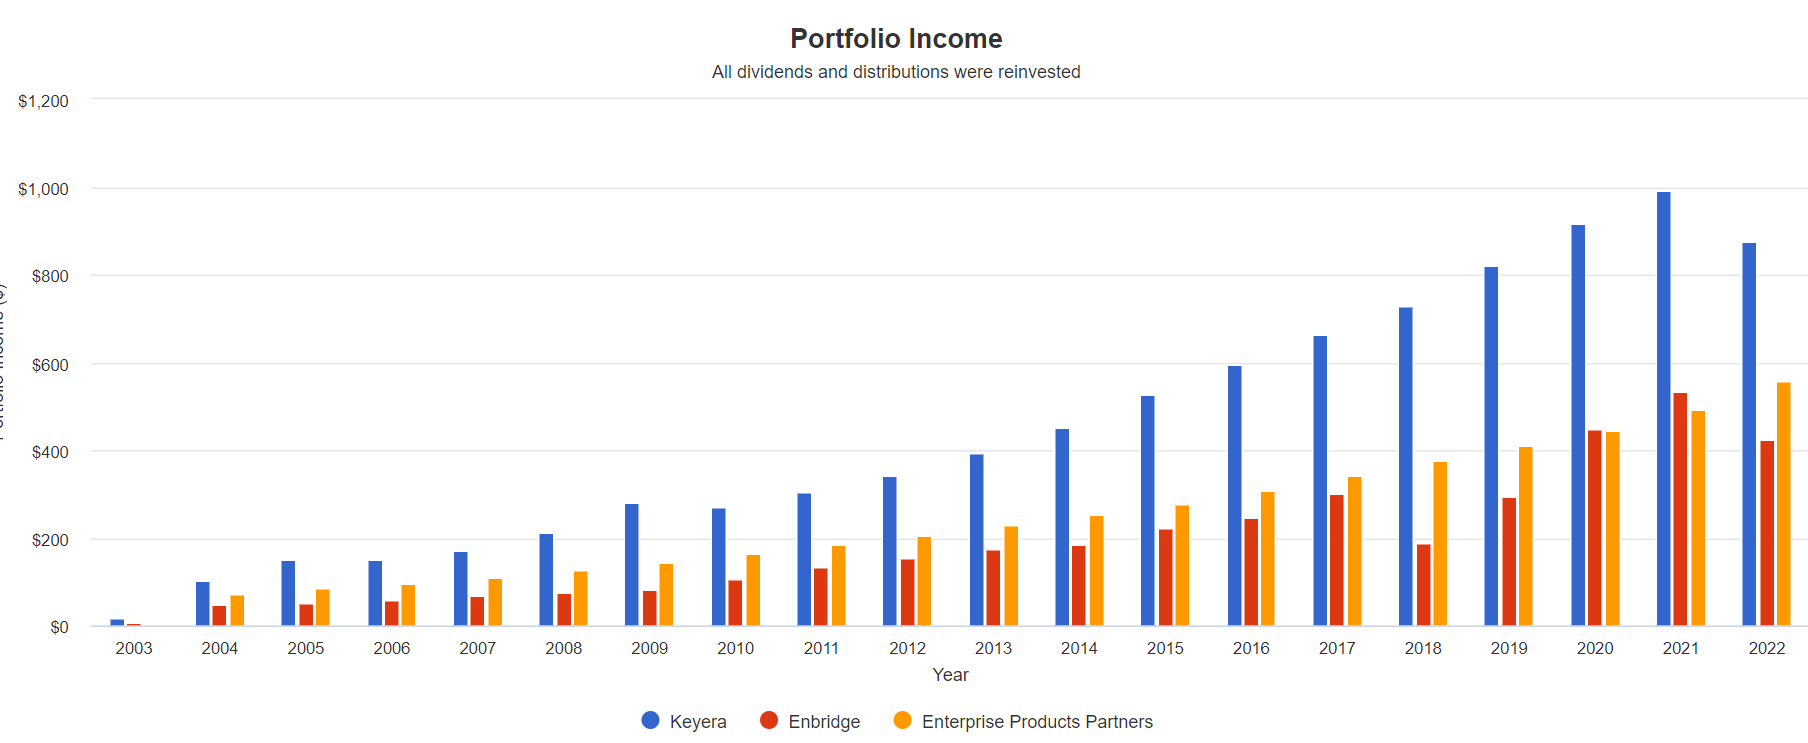
- 2004 yield: 10.3%
- 2022 yield on cost: 105%
- dividend growth over the last 18 years: 15.6% CAGR
This is the king of very safe ultra-yield and hyper-income growth that rich retirement dreams are made of.
Keyera Investment Decision Score
DK (Source: Dividend Kings Automated Investment Decision Tool)
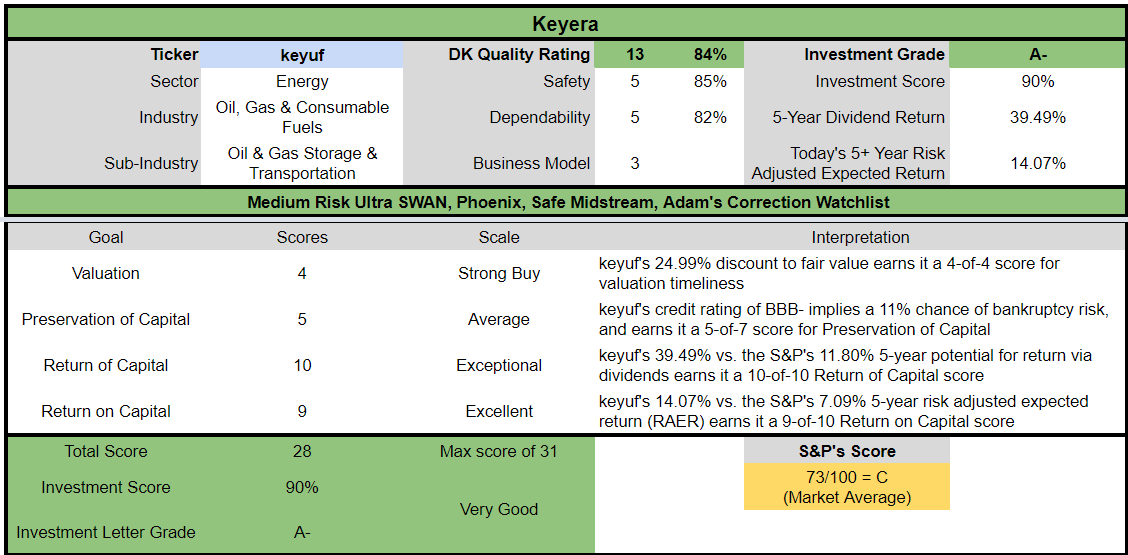
KEYUF is a potentially very good ultra-yield monthly dividend blue-chip for anyone comfortable with its risk profile. Look at how it compares to the S&P 500.
- 25% discount to fair value vs. 3% S&P = 22% better valuation
- 6.5% very safe yield, 3.5X higher than the S&P 500
- 70% higher long-term annual return potential
- 2X better risk-adjusted expected return
- almost 4X higher 5-year consensus dividend income
British American Tobacco (BTI): The Fastest Growing Ultra-Yield Dividend Aristocrat
- Full Investment Thesis: 7% Yielding British American Tobacco Is The Perfect Bear Market Buy
- Full investment thesis, risk profile, and growth outlook
Tobacco bears think they have a fool-proof reason for why tobacco blue-chips are a terrible long-term investment.
- eventually cigarette volumes will go to zero
- smoke-free future = a terrible investment
Do you know who is the first to agree with this thesis? Tobacco companies, all of which have plans to eventually sell zero cigarettes and tobacco.
- 100% reduce-risk nicotine, cannabis and medical vaporizers
So the question to ask about tobacco companies isn’t “are cigarette volumes falling”? Cigarette volumes have been falling globally for over 50 years and will eventually go to zero.
The only thing that matters is how well a tobacco blue-chip is executing on its smoke-free future plans.
For the last three years, BTI’s reduced-risk or RRP sales have been growing at 32% annually, while its RRP userbase has grown at 31% CAGR.
- RRPs now make up 14% of sales
- up from 5% in 2019 and 8% in 2020
- up to 72% of sales in Sweden
BTI’s RRP customers have been growing steadily.
- +2.5 million in 2019
- +3.0 million in 2020
- +4.8 million in 2021
They were 18.3 million at the end of 2021 and by 2025 management plans to get that to 50 million.
BTI’s RRP sales are growing at 50%, faster than even Philip Morris (PM), the industry RRP leader.
- it now has more RRP users than PM
How well is BTI executing on its smoke-free future plans?
- at the start of the year analysts expected 15% of sales from RRPs in 2025
- RRP sales are on track to hit 15% of revenue by the end of 2022
Now, BTI isn’t yet earning a profit on RRPs (unlike PM), but management expects that to change in 2023.
And given that PM’s gross margins on RRPs are slightly higher than on cigarettes, this bodes well for BTI’s future growth prospects.
How strong are those?
FactSet Research Terminal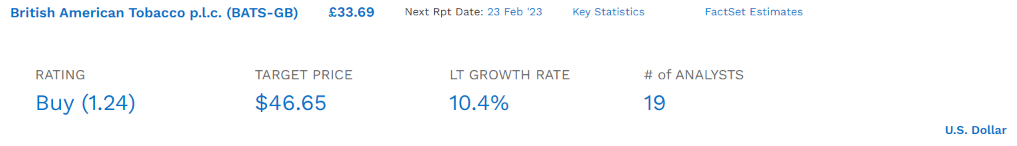
The median long-term growth consensus on BTI has been rising steadily all year, from 8% (mid-range management guidance) to 10.4% CAGR.
- the strongest growth outlook in 20 years
If a company has a solid BBB+ balance sheet (because of safe leverage) and the growth prospects are the best in 20 years, then fundamentally speaking you’d expect the best valuation in 20 years right? Or at least at the upper end of its historical range of 13 to 14X earnings.
One Of The Lowest Valuations In 20 Years… But The Best Growth Outlook In 20 Years
FAST Graphs, FactSet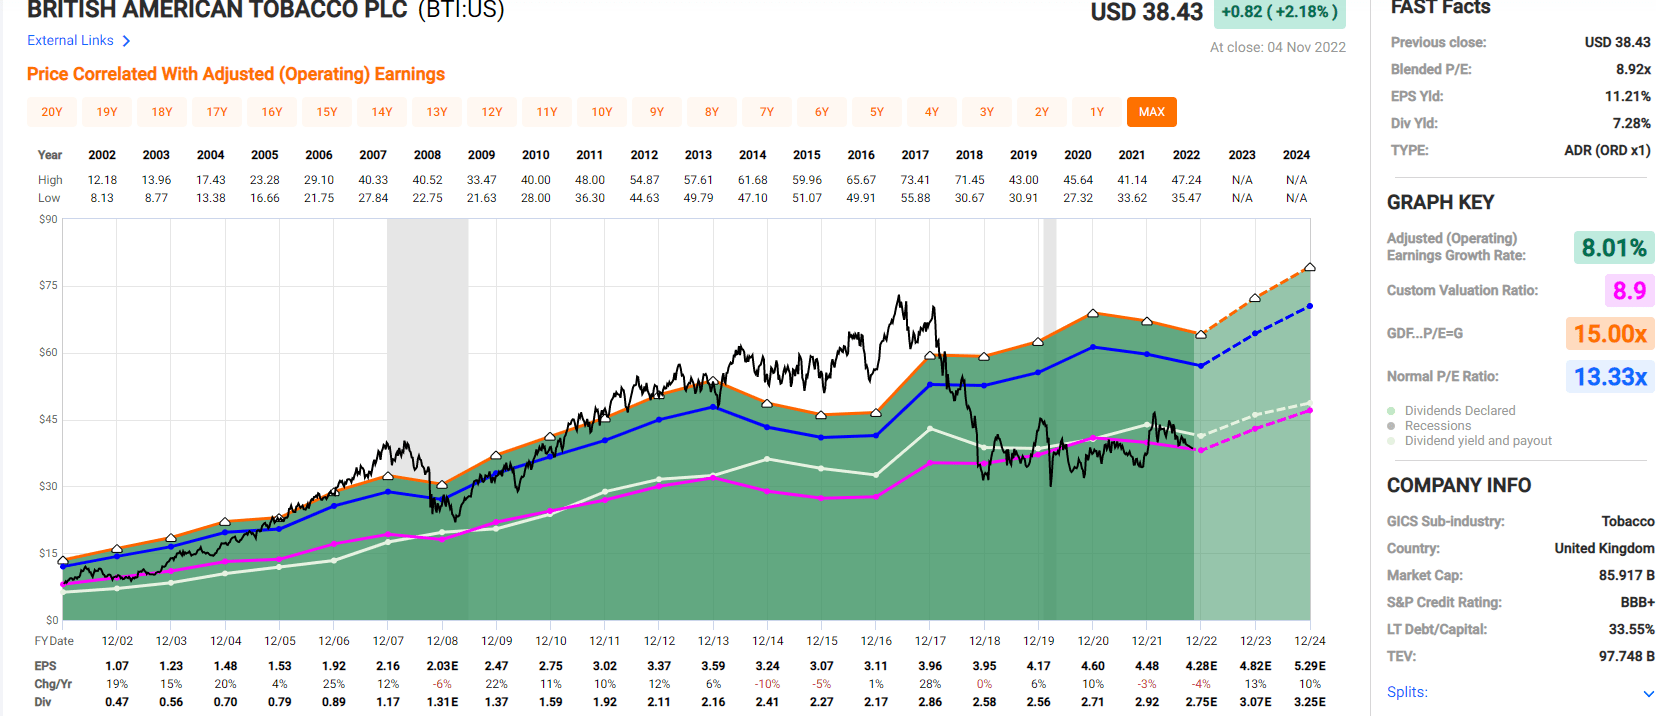
BTI’s PE is near the lowest it’s been for 20 years. That’s objective fact.
BTI growing at 8% long-term is worth about 13.3X earnings, that’s market-determined fair value.
And today you can buy it at a cash-adjusted 8.3X forward earnings, a 37% historical discount.
- anti-bubble valuation pricing in -0.4% CAGR growth
- when management is guiding for 8% to 9%
- and analysts expect 10.4% CAGR
- including 13% growth in 2023 and 10% growth in 2024
How can a dividend aristocrat growing at its fastest rate in 20 years be a long-term value trap? Simple, it can’t.
Reasons To Potentially Buy British American Tobacco Today
| Metric | British American |
| Quality | 84% 13/13 Quality Ultra SWAN (Sleep Well At Night) Global Aristocrat |
| Risk Rating | Very Low Risk |
| DK Master List Quality Ranking (Out Of 500 Companies) | 204 |
| Quality Percentile | 60% |
| Dividend Growth Streak (Years) | 22 (at least) |
| Dividend Yield | 6.5% |
| Dividend Safety Score | 82% |
| Average Recession Dividend Cut Risk | 0.5% |
| Severe Recession Dividend Cut Risk | 1.95% |
| S&P Credit Rating |
BBB+ negative outlook |
| 30-Year Bankruptcy Risk | 5.00% |
| LT S&P Risk-Management Global Percentile |
100% Exceptional, Very Low Risk |
| Fair Value | $61.02 |
| Current Price | $38.43 |
| Discount To Fair Value | 37% |
| DK Rating |
Potential Ultra Value Buy |
| PE | 8.1 |
| Cash-Adjusted PE | 8.3 (anti-bubble blue-chip) |
| Growth Priced In | -0.4% |
| Historical PE | 13 to 14 |
| LT Growth Consensus/Management Guidance | 10.4% |
| PEG Ratio | 0.80 |
| 5-year consensus total return potential |
23% to 28% CAGR |
| Base Case 5-year consensus return potential |
24% CAGR (3.5X the S&P 500) |
| Consensus 12-month total return forecast | 36% |
| Fundamentally Justified 12-Month Return Potential | 65% |
| LT Consensus Total Return Potential | 16.9% |
| Inflation-Adjusted Consensus LT Return Potential | 14.6% |
| Consensus 10-Year Inflation-Adjusted Total Return Potential (Ignoring Valuation) | 3.91 |
| LT Risk-Adjusted Expected Return | 11.24% |
| LT Risk-And Inflation-Adjusted Return Potential | 8.95% |
| Conservative Years To Double | 8.05 |
(Source: Dividend Kings Zen Research Terminal)
BTI is trading at 8.1X earnings and 8.3X cash-adjusted earnings, pricing in -0.4% CAGR growth while it’s actually growing at double-digits.
That means potentially Buffett-like 17% CAGR long-term return potential.
Think that’s crazy?
British American Total Returns Since 1985
(Source: Portfolio Visualizer Premium)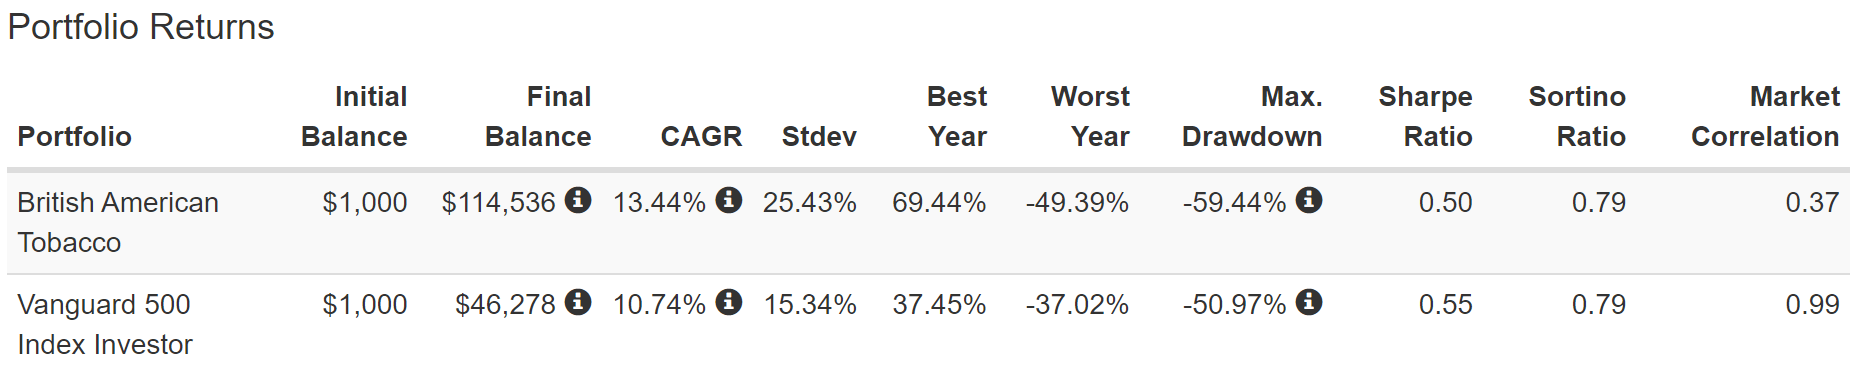
BTI has been a 115X bagger since 1985, 41.3X adjusted for inflation, delivering 3X better return returns than the S&P 500.
- with cigarette volumes declining every single year
(Source: Portfolio Visualizer Premium)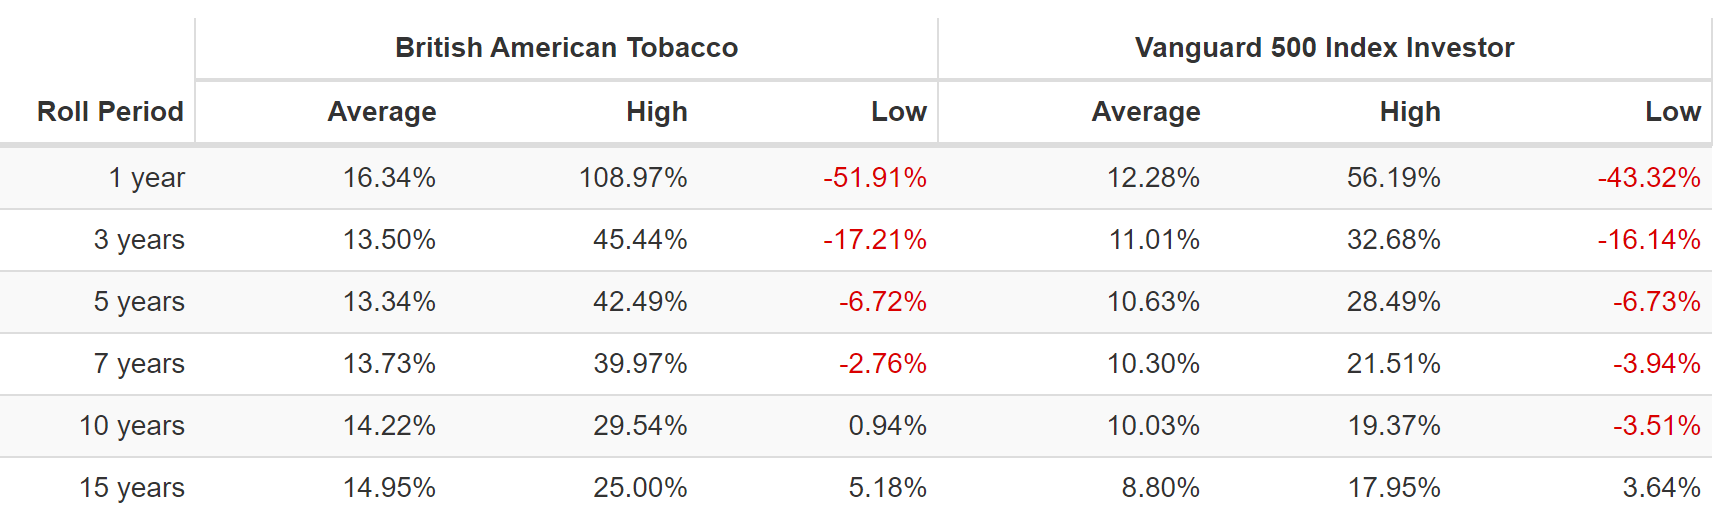
BTI’s average 12-month rolling return since 1985 is 16.3% CAGR and its average 15-year rolling return is a Nasdaq-smashing 15% CAGR.
And the last time it was this undervalued? Back in 2000? BTI delivered 25% CAGR returns for the next 15 years.
- 30X returns from 2000 to 2017 (the last bubble peak)
But this time is different, right? BTI is on borrowed time because eventually it won’t be able to keep hiking cigarette prices to offset volume declines and fund its dividend and RRP efforts, right?
BTI plans to be 100% smoke-free within 20 to 30 years. How long can they keep raising prices before demand destruction kills the legacy cigarette business model?
Since 2011, a series of Draconian anti-cigarette measures in Australia have led to the introduction of plain packs and tax increases that caused the doubling of the retail price of cigarettes in just six years, which in turn has led to the smoking rate falling from 16% to 13% over the same period, and to significant trading down between price segments.” – Morningstar
Morningstar’s estimate for how long tobacco has to transition to a smoke-free future is based on the price elasticity of Australia, which has the most draconian tobacco regulations and the most expensive cigarette prices in the world.
A pack of 20 cigarettes (equivalent; a standard pack contains 25 sticks in Australia) now costs roughly $26, well above the $17.80 retail price for a premium pack in the U.K., $6.50 in the U.S., and around $5.50 on average globally, according to the World Health Organization.” – Morningstar
A pack of smokes is $26 in Australia, 5X more expensive than the US.
Assuming the Australian experience is applicable to price elasticity in other markets, it appears a great deal of headroom remains for price increases globally. At 4% real pricing (based on 6% nominal price/mix and 2% global inflation), this crude calculation suggests that it will be 2051 before global pricing reaches levels at which price elasticity increased in Australia. This is comfortably longer than 20 years, the benchmark period that we expect wide-moat companies to continue generating economic rent.” – Morningstar
Morningstar estimates tobacco has 29 years to make the smoke-free transition, which is comfortably within the time tables for all the big tobacco companies.
- 15 years for PM
- 20 to 30 years for BTI
- 25 to 30 years for MO
But you don’t have to wait decades for BTI to earn rich returns from some of the best valuations in history (with the best growth prospects in history).
British American Tobacco 2024 Consensus Total Return Potential
(Source: FAST Graphs, FactSet)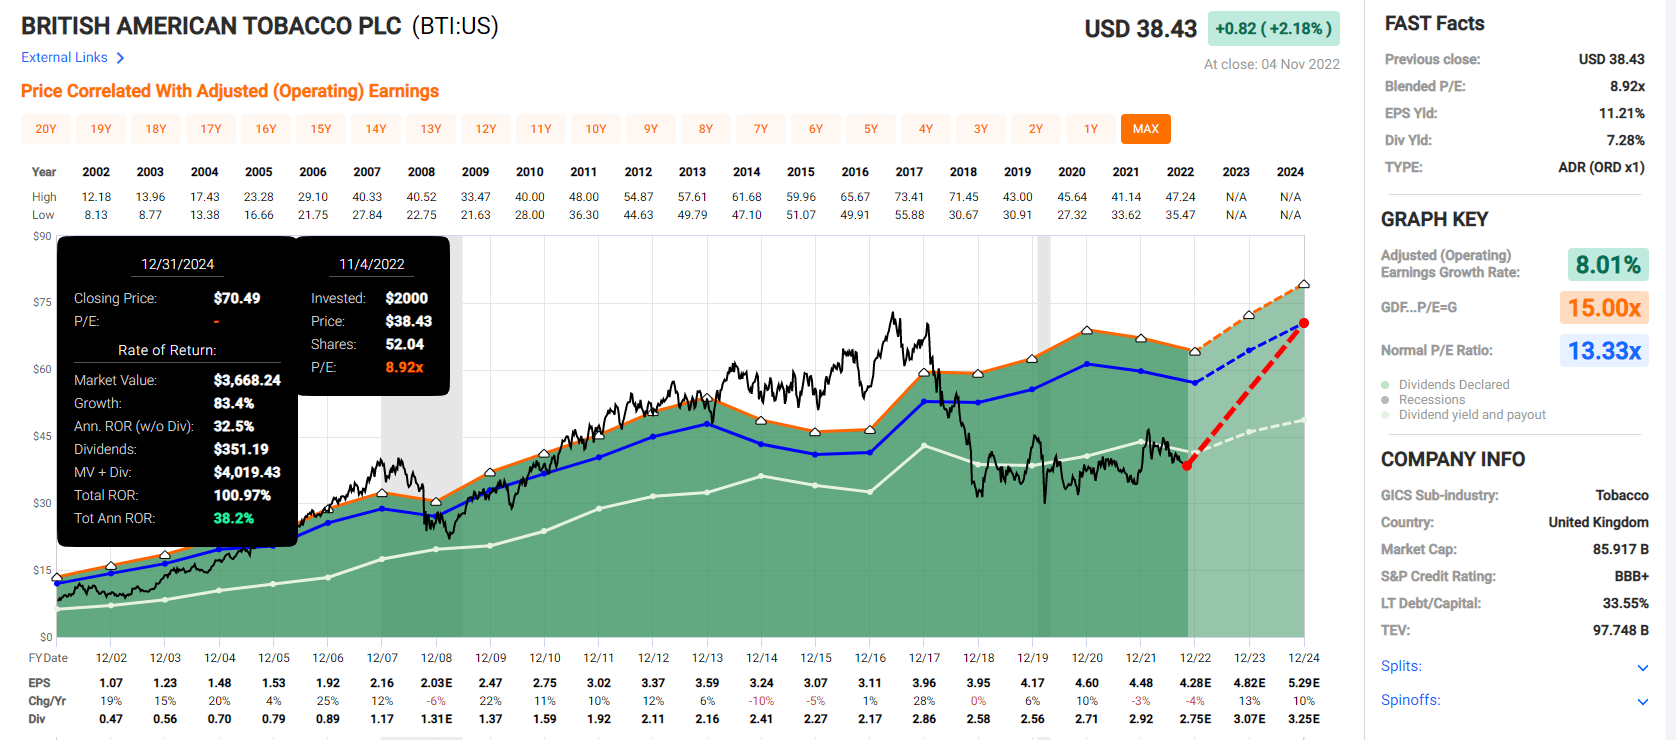
If BTI grows as expected through 2024 and returns to historical-mid-range market-determined fair value, it could possibly double in the next two years.
- Buffett-like 38% CAGR annual returns
- 3.5X better than the S&P 500 consensus
British American Tobacco 2024 Consensus Total Return Potential
(Source: FAST Graphs, FactSet)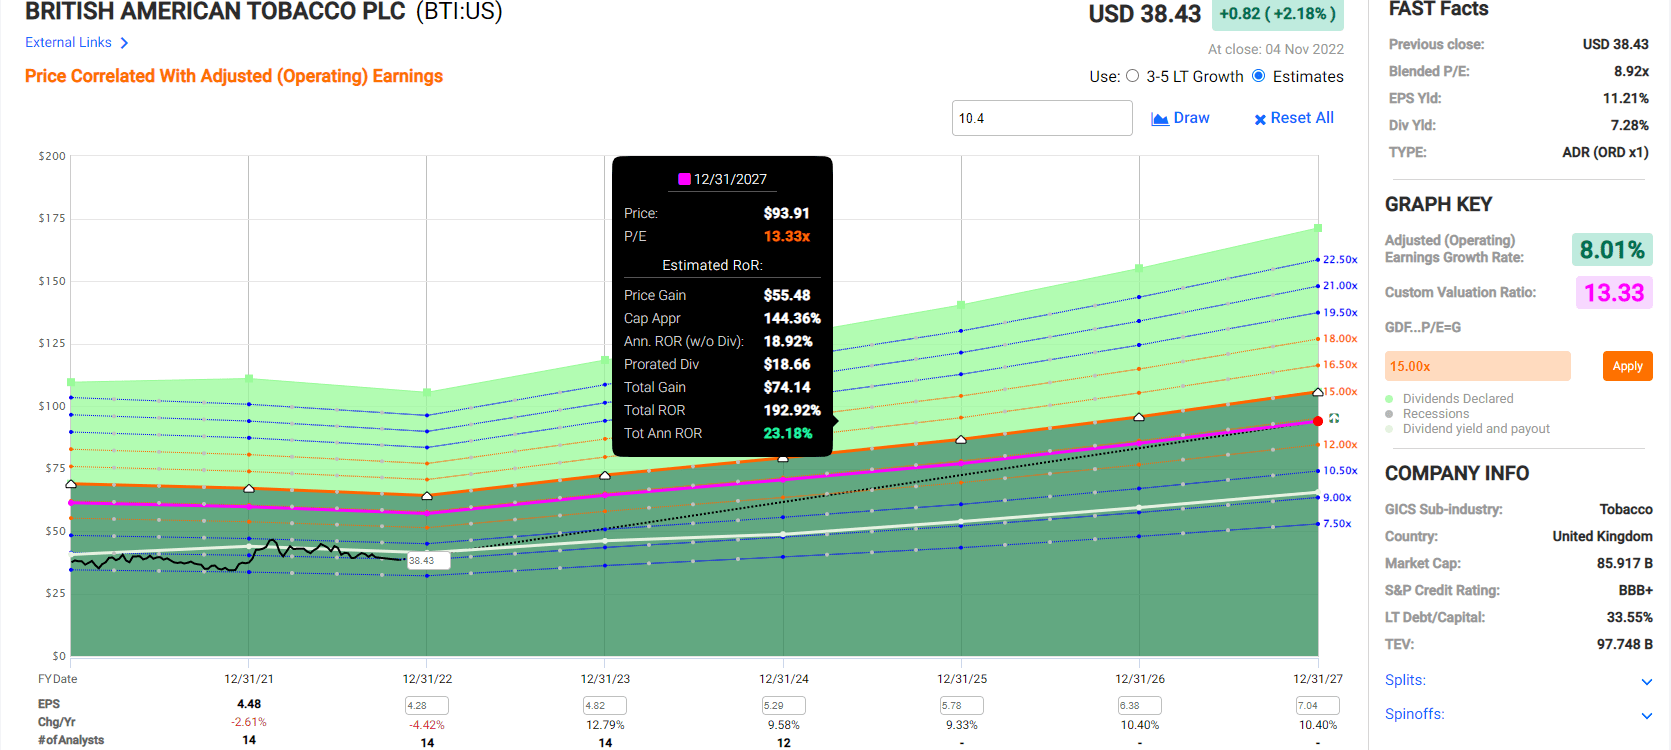
If BTI grows as expected over the next five years and returns to historical fair value, it could potentially almost triple, delivering Buffett-like 23% annual returns.
- 3.5X better than the S&P 500
British American Investment Decision Score
DK (Source: Dividend Kings Automated Investment Decision Tool)
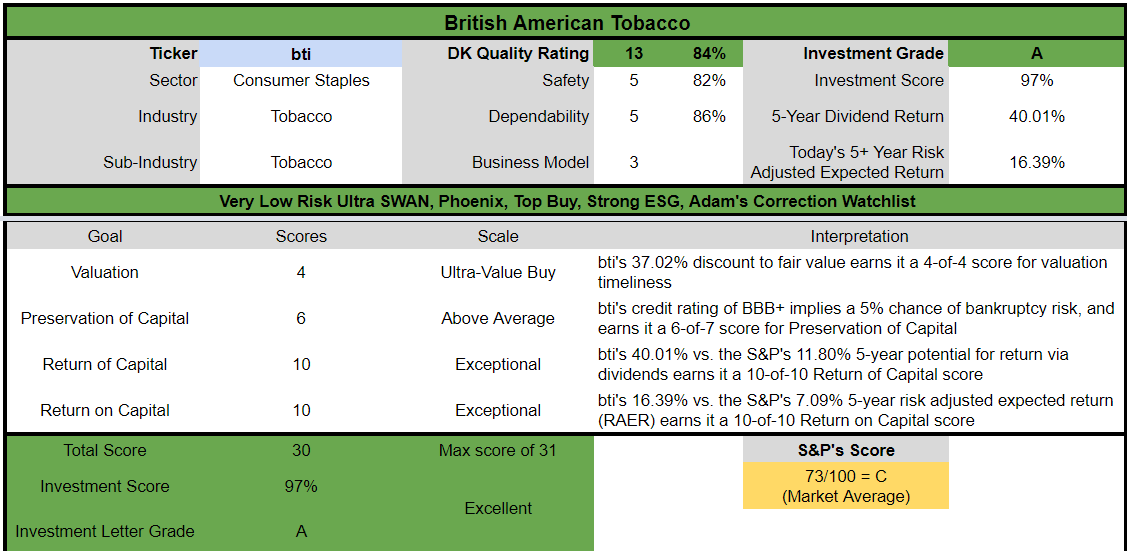
BTI is a potentially excellent ultra-yield dividend aristocrat for anyone comfortable with its risk profile. Look at how it compares to the S&P 500.
- 37% discount to fair value vs. 3% S&P = 34% better valuation
- 6.5% very safe yield, 3.5X higher than the S&P 500
- 70% higher long-term annual return potential
- over 2X better risk-adjusted expected return
- almost 4X higher 5-year consensus dividend income
Bottom Line: These 2 Fast-Growing 6+% Yielding Blue-Chips Can Help You Retire In Safety And Splendor
I can’t tell you when the Fed will stop hiking, because not even the Fed knows when inflation will let it pause rate hikes (or allow it to start cutting again).
I can’t tell you when the economy will fall into recession in 2023, only that the bond market estimates it 100% will sometime next year.
I can’t tell you when earnings estimates will bottom, or when the stock market will, just give you the current probability curves.
- most likely an 11% to 23% further decline with a bottom between Q1 and Q3 2023
- range of 0% to 23% further decline
- range of January 2023 and October 2024 final bottom
Neither the real world nor Wall Street runs on certainties, just probabilities and risk management.
But what I can say with high confidence is that fast-growing ultra-yield blue-chips like BTI and KEYUF are two of the best sources of very safe and fast-growing long-term income you can buy today.
- 6.5% very safe yield
- investment-grade BBB and BBB+ balance sheets
- 10.4% to 10.6% CAGR long-term growth consensus
- long-term return potential of 16.9% to 17.1% CAGR (similar to historical returns over the last 20 years)
If you want to beat long-term inflation and retire rich and stay rich in retirement, savings accounts and bonds can help, but they can’t get you all the way to your financial goals.
But world-beater blue-chips like these? Trading at some of their lowest valuations in 20 years with the best growth prospects in decades? Well my friends, that’s what rich retirement dreams are made of.
Be the first to comment