

Ceri Breeze/iStock Editorial via Getty Images
In a previous article back in April, I made the argument that TUI AG (OTCPK:TUIFF) could see challenges over the short to medium-term as a result of higher fuel prices and ongoing flight disruptions due to staff shortages.
Since then, the stock has declined by nearly 40%:
investing.com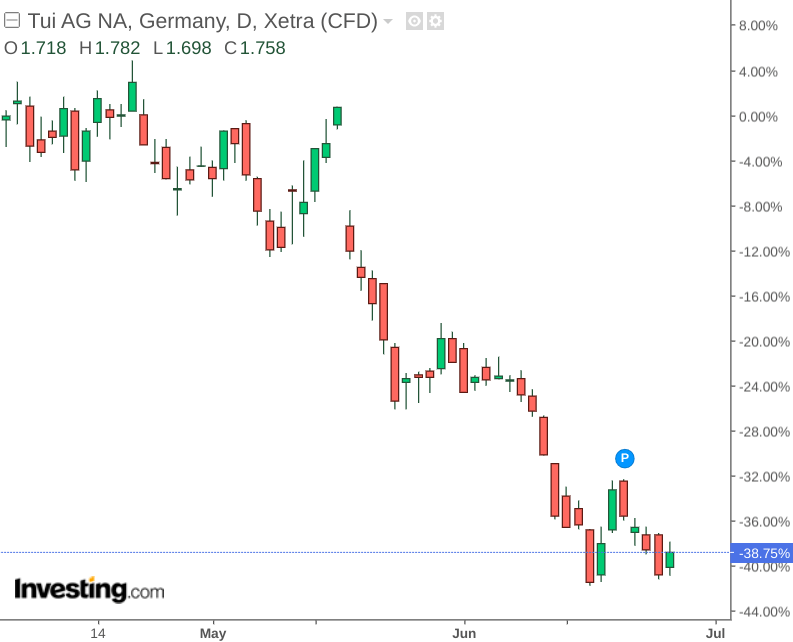
While the macroeconomic environment has been challenging, I wish to investigate whether TUI has potential for a significant rebound going forward – on account of an potentially increasing disconnect between price and financial performance.
Performance
When looking at revenue performance in the most recent quarter – we can see that Markets & Airlines has brought in the largest portion of revenue by far.
TUI Group Half-Year Financial Report 1 October 2021 – 31 March 2022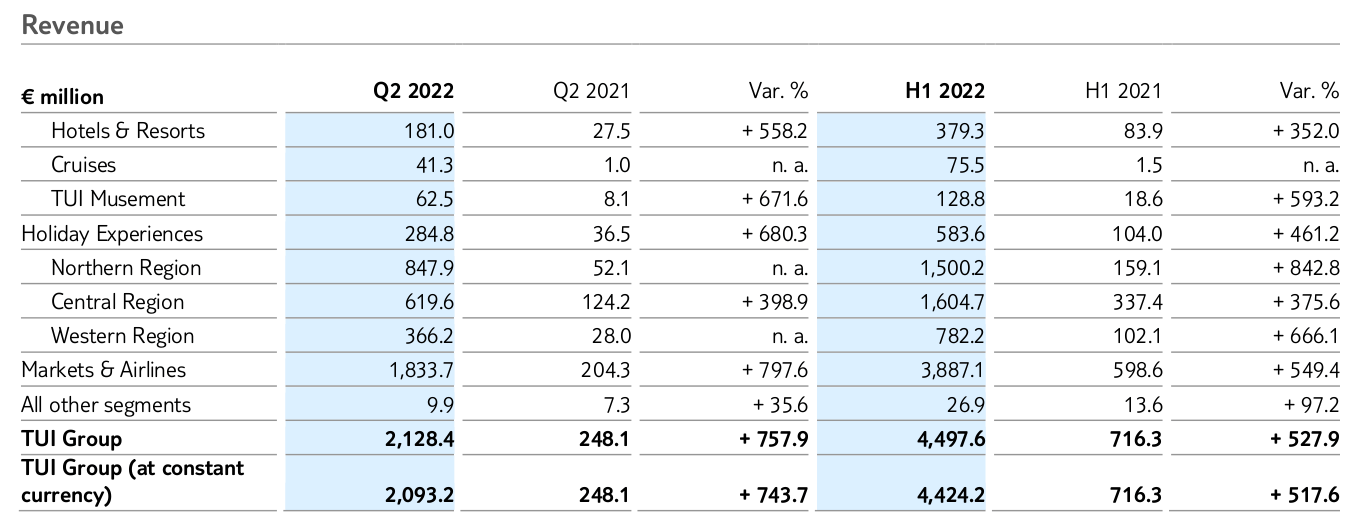
However, when comparing performance to 2019 levels – we can see that revenue across Markets & Airlines has rebounded strongly to near levels seen in that year.
Notably, the Spanish (including Canary Islands) market has accounted for over a third of total revenue.
External revenue allocated by destinations: October 2021 to March 2022
TUI Group Half-Year Financial Report 1 October 2021 – 31 March 2022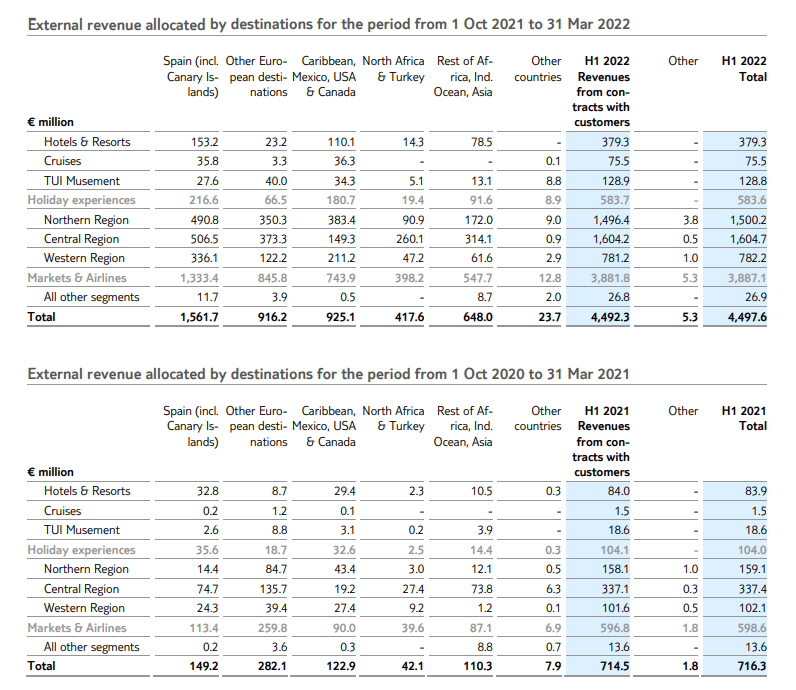
External revenue allocated by destinations: October 2020 to March 2021
TUI Group Half Year Financial Report 1 October 2020 – 31 March 2021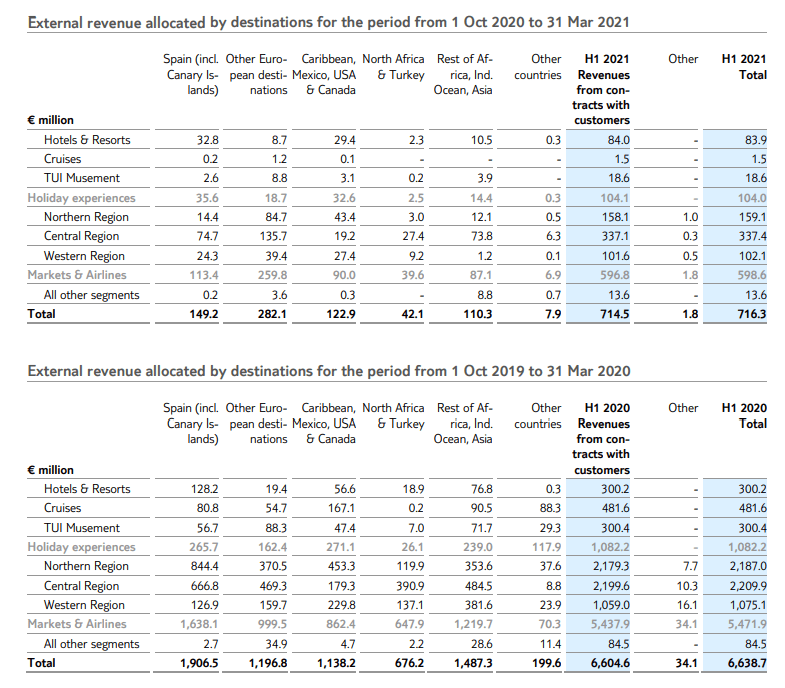
From a balance sheet standpoint, we can see that the company’s quick ratio – or a measure of the company’s ability to pay its current liabilities without needing to sell inventory – is down from 0.61 in September 2019 to 0.46 in March 2022.
| Period | March 2022 | September 2021 | March 2021 | September 2020 | March 2020 | September 2019 |
| Current assets | 3549.9 | 2933.3 | 2621.4 | 2693.4 | 4389.2 | 4313.5 |
| Inventories | 50.1 | 42.8 | 71.5 | 73.2 | 108.5 | 114.7 |
| Current liabilities | 7680.7 | 6240.3 | 4797 | 5873.2 | 7777.8 | 6857.4 |
| Quick ratio | 0.46 | 0.46 | 0.53 | 0.45 | 0.55 | 0.61 |
Source: Figures sourced from historical TUI Half Year Financial Reports (2019 – present). Quick ratio calculated by author.
In this regard, we can see that while revenue has been rebounding strongly – this has affected the company’s liquidity to a degree. While it is probable that investors might be willing to tolerate lower levels of liquidity temporarily for as long as revenue is rebounding – there will come a point where investors will want to ensure that the company is generating sufficient cash relative to expenses. Cash and cash equivalents themselves have recovered from just over €1 billion in March 2020 to over €1.5 billion in March 2022 (with cash levels in 2019 just over €1.7 billion).
Additionally, when looking at historical earnings per share for TUI, we can see that earnings per share has been negative for the past five years when looking at half-year results:
| Period | H1 2018 | H1 2019 | H1 2020 | H1 2021 | H1 2022 |
| Earnings per share | -0.48 | -0.58 | -1.51 | -1.83 | -0.47 |
Source: Figures sourced from historical TUI Half Year Financial Reports (2019 – present).
Looking forward
From the above, we can see that while TUI has managed to effect a strong rebound in revenue – negative earnings growth has been an issue even before the pandemic.
From this standpoint, we can see that the stock price has been on a downward trajectory overall since 2015:
investing.com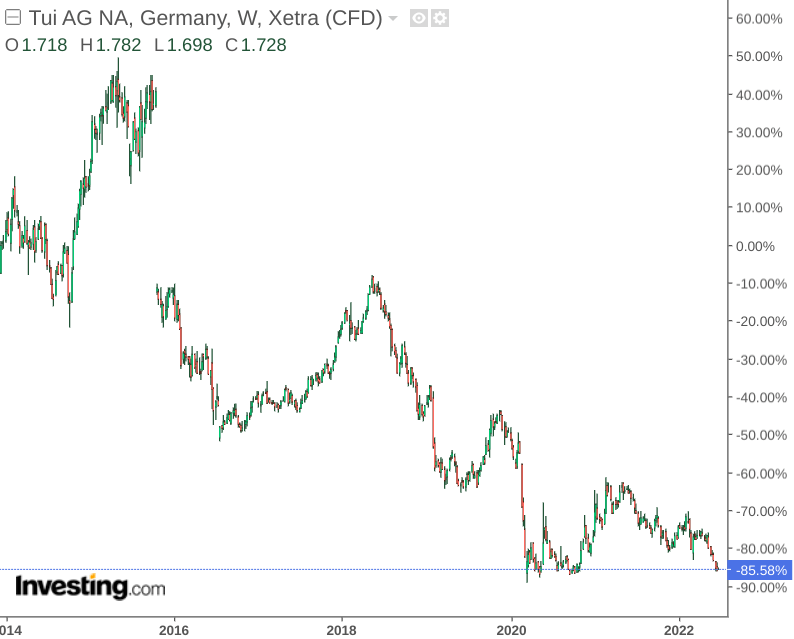
As I mentioned in my previous article – higher fuel prices could significantly increase the cost of sales in the coming years. While TUI may be able to recover to pre-pandemic sales levels, it will cost the company more to make those sales. The fact that the quick ratio has yet to recover to 2019 levels is discouraging.
TUI has also come under pressure due to staff shortages – leading to last minute cancellations of numerous flights. Given that Markets & Airlines accounts for the bulk of the company’s revenue – costs arising from flight cancellations stand to affect the company to a greater extent than travel companies that are less exposed to this segment of the industry.
Therefore, in spite of encouraging growth across segments such as Hotels & Resorts thanks to increasing average daily rates and resilient occupancy levels – such growth is unlikely to offset pressure across Markets & Airlines.
The main challenge for TUI going forward will be to bolster Markets & Airlines revenue sufficiently so as to boost overall earnings. The rebound we have seen so far has been encouraging. However, the company does face a challenging environment going forward as higher costs are set to erode into earnings. While the company has shown a strong rebound in cash growth since 2020 – investors will also want to see evidence that such growth remains sufficient to cover current liabilities.
Conclusion
To conclude, I rate TUI as a hold at this time. In my view, the stock’s strong rebound in Markets & Airlines revenue does not make the stock a sell at this time.
However, I would be watching for strong growth in both earnings per share and the quick ratio over the next year as evidence that the company can translate revenue growth to the bottom line.
Should we see evidence of this, then there could be potential for a rebound in the stock from here. That said, should sales growth in the next quarter come in below expectations – then the stock could face further downside.
Be the first to comment