

DNY59/iStock via Getty Images
Investment Thesis
Kinder Morgan, Inc. (NYSE:KMI) and The Williams Companies Inc. (NYSE:WMB) are U.S. energy companies mainly operating in the midstream sector. Both pay quarterly dividends that currently translate to yields of 6.7% and 5.7%, respectively. While such yields are certainly enticing, the past performance of WMB and KMI should be considered as well (Figure 1). While WMB’s price increased at a compound annual growth rate (CAGR) of 0.5% per year, investors in Kinder Morgan lost 6.5% compounded over the last decade, without the dividend. Of course, KMI and WMB are very cyclical stocks and their share prices are correlated with the price of oil. Therefore, it is best to view investments in midstream companies as non-maturing high-yield bonds with a certain upside in terms of dividend growth, given the seemingly below-average cyclicality of cash flows.
Figure 1: Share price of KMI and WMB since 2012 (own work, based on the weekly closing share prices of KMI an WMB)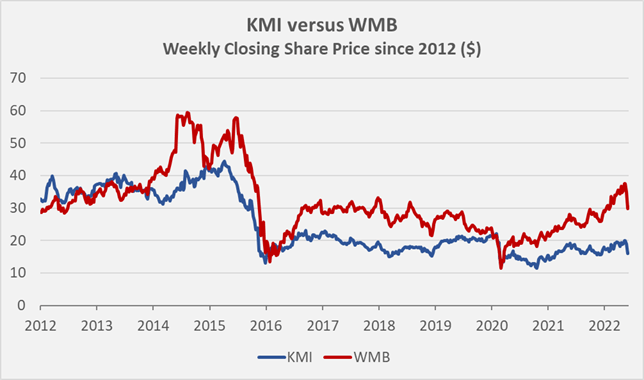
Even though we are far from the bottom of this commodity cycle, I figured that a closer look at both companies would nonetheless be warranted, given the current energy crisis in the European Union. The United States will play an increasingly important role in the context of liquefied natural gas (LNG) exports, and the transportation of gas to LNG compressors and shipping terminals is a reasonably predictable business, given that most of such companies’ cash flows are fee-based and/or regulated. During the Q1 2022 earnings call, Rich Kinder of KMI confirmed my thoughts in that he expects that the U.S. will be a major supplier of additional LNG to Europe to replace, at least in part, Russian gas. KMI is a major player in this context as approximately 50% of the gas going to LNG export terminals flow through the company’s pipelines. Of course, it will take considerable time for a sufficient number of receiving terminals to come online and therefore, I see demand picking up relatively slowly. However, given the depth of the crisis, it appears unlikely that relationships between the West and Russia will return to the pre-crisis level and it is therefore reasonable to expect a secular trend towards U.S. LNG.
A key risk to this investment thesis is the recent policy statement by the Federal Energy Regulation Commission (FERC), according to which greenhouse gas emissions resulting from the downstream combustion of transported gas should now be considered – the consequences on future pipeline projects could prove disastrous indeed. I will not detail this topic, as it has been discussed by fellow Seeking Alpha contributor Dividend Streamer in his excellent article. However, given the fact that the policy has been published already in mid-February 2022, shortly before Russia’s invasion of Ukraine, it does not come as a surprise that the FERC is now making concessions, going easier on projects in motion and also allowing new approvals.
Historical Earnings And Cash Flows Of WMB And KMI
KMI’s revenues since 2010 have been somewhat more cyclical than those of WMB, but have also grown faster. KMI is a larger company in terms of revenues and also its operating margin has historically been stronger, at 27% versus 23% for WMB, on average. Both companies typically generate more than 50% of their revenues from services, while product sales have been declining for WMB (42% in 2019, 25% in 2021) and increasing for KMI (37% in 2019, 53% in 2021). The steep increase in product sales at KMI should not be overemphasized because it is in part attributable to the windfall profit related to Winter Storm Uri. Nevertheless, it does not appear far-fetched to assume that the good position of the company and its swift reaction will pave the way for additional sales, as has also been noted by CEO Steven Kean.
Figure 2: Total revenues of KMI and WMB since 2010 (own work, based on the companies’ 2011 to 2021 10-Ks)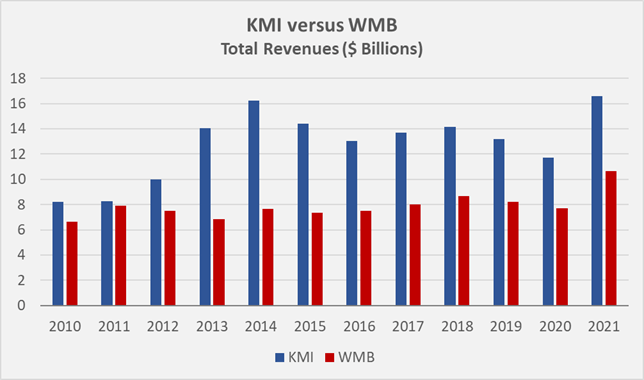
In terms of cash flows, KMI also looks to be in a better position than WMB, because it did not report negative free cash flow (FCF) since 2010, if asset- and goodwill impairment charges are ignored. Also, KMI’s cash return on invested capital (CROIC) is much more consistent than that of WMB (Figure 3). Nevertheless, both companies struggle to generate returns for their shareholders in excess of the weighted average cost of capital, which currently is around 6% for KMI and 7% for WMB.
Figure 3: Cash return on invested capital of KMI and WMB, based on free cash flow before impairments (own work, based on the companies’ 2011 to 2021 10-Ks, negative values are not shown)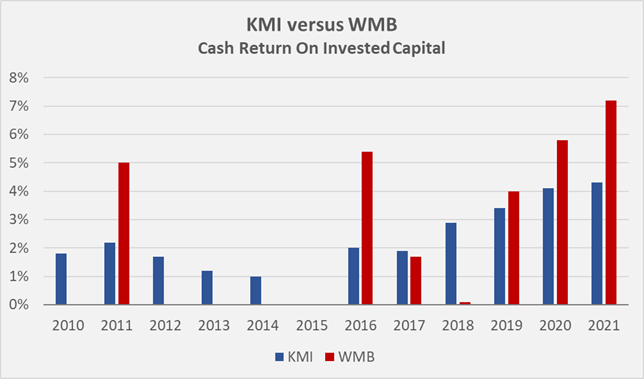
Including impairment charges, WMB generated negative FCF in 7 out of 12 years since 2010, whereas KMI lost $662 million after capital expenditures and impairments in 2015 (Figure 4). Overall, since 2010, WMB generated negative FCF of $393 million because the company had to impair $5.6 billion of the assets, which translates to 19% of the capital expenditures over the same time, or 12% of capital expenditures when also taking acquisitions into account. KMI also had to impair approximately 19% of the capital expenditures reported since 2010 (12% when taking acquisitions into account), but of course, they partially relate to expenditures from earlier years.
Figure 4: Free cash flow of KMI and WMB since 2010, taking impairment charges into account (own work, based on the companies’ 2011 to 2021 10-Ks)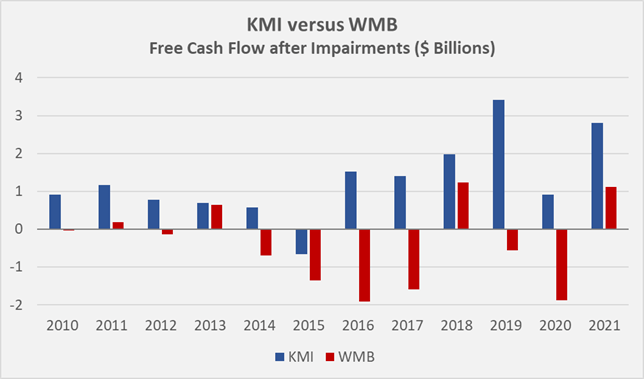
Taken together, Kinder Morgan appears much stronger in terms of actual cash flow generating capabilities than The William Companies, as is underlined by the $15.5 billion in post-impairments FCF the company generated since 2010.
Are The Dividends Safe And Can They Continue To Grow?
As already noted, both companies pay a generous dividend, which is likely also the main reason for investors holding on to their shares, despite the abysmal share price performance. However, it should not be forgotten that companies with high dividend yields, and oftentimes weak share price performance can represent phenomenal investments, as long as the dividend is consequently reinvested and the underlying operating performance is strong (i.e., the high dividend yield is not a consequence of a declining share price). The original Philip Morris, now known as Altria Group (MO) is an oft-cited example in this context, as the stock faced substantial declines on multiple occasions, mostly due to litigation, but has still performed exceptionally well for long-term shareholders.
However, key to the strong compounding effect underlying such an investment is the consistent growth of earnings, cash flows, and ultimately dividends. And this is where it gets difficult with cyclical businesses.
KMI’s earnings and cash flows have been much more robust over the last decade than those of WMB, but it is still important to assess dividend coverage in terms of FCF. Since 2010, WMB and KMI paid $21.7 billion and $22.4 billion to shareholders and non-controlling interests via dividends, respectively. Evidently, WMB paid out much more than it generated over the last twelve years, given it was barely able to generate positive FCF. KMI paid out approximately $1 billion more than it generated over the last twelve years, or $6.5 billion if impairments are included. Therefore, it does not come as a surprise that both companies significantly increased leverage over this period. Of course, acquisitions are responsible as well. Since 2010, KMI’s net debt ballooned from $15 billion to $31 billion, while WMB’s net debt almost tripled over the same period, to $22 billion in 2021 (Figure 5). Note, however, that WMB still had a fairly solid balance sheet in 2010, underscored by its very modest net debt to EBITDA ratio of less than 2. KMI comes from a much worse basis, as is shown by its 2010 net debt of more than 6 times EBITDA, but was able to bring leverage down to less than 5 times EBITDA in 2021. It is worth noting that KMI’s net debt peaked in 2015, the year in which the strategy in place at the time seized to work. Earlier, the then master limited partnership (MLP) funded its extensive pipeline projects by issuing new units and debt. Beginning in 2014, however, oil prices collapsed and valuations of KMI and other MLPs followed suit. The acquisition of an increasing stake in Natural Gas Pipeline Company of America was – at least in part – responsible for the change in outlook on Kinder Morgan’s debt to negative by Moody’s. The reduced share price, and the risk of a credit rating downgrade to junk status led to a liquidity crisis of sorts, that forced KMI to slash its dividend by 75%, shortly after an increase by 6% to 10% over its 2015 target dividend of $2.00 per share was indicated.
Figure 5: KMI’s and WMB’s historical net debt (own work, based on the companies’ 2011 to 2021 10-Ks)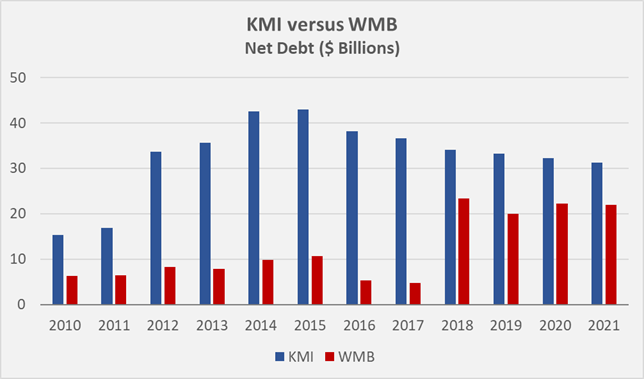
Since 2015, KMI pursues what it termed as a “self-sufficient” growth strategy, in that shareholders are no longer factored into the equation. The company continues to stand by its words, as the weighted average number of diluted shares outstanding has increased only slightly since 2015 (Figure 6). Obviously though, the share buybacks in recent years (KMI has a $2 billion buyback authorization from 2017) were not able to offset compensation-related dilution. Also, the fact that KMI so far only repurchased $575 million worth of shares suggests that the company in fact lacks the cash for such ventures.
Nevertheless, since the 2015/16 setback, KMI was able to reduce debt quite significantly and it is now at a leverage similar to that of WMB.
Williams, in stark contrast, continues to dilute its shareholders. Since 2015, the number of shares outstanding has increased by over 60%, underscoring the company’s seemingly insatiable appetite for capital.
Figure 6: Weighted average diluted shares outstanding for KMI and WMB, in percent of the 2011 and 2010 levels, respectively (own work, based on the companies’ 2011 to 2021 10-Ks)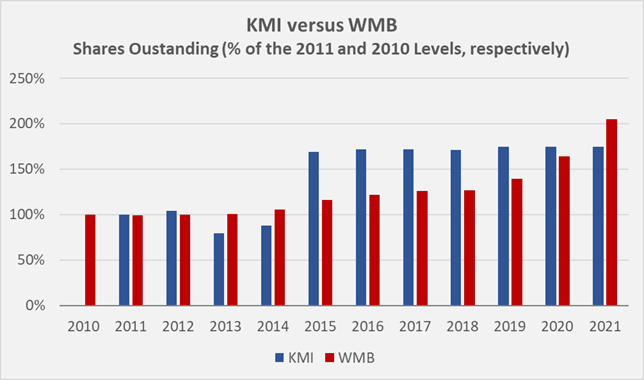
Going forward, it seems likely that energy prices remain elevated. Of course, a significant decline in demand due to an economic downturn might be possible, but I consider the earnings of midstream businesses pretty robust nonetheless. The role of gas as a “transitional fuel” en route to environmentally less-demanding fuels (solar and wind-derived power), and also the likely lasting effects of Russia’s invasion of Ukraine in terms of geopolitics and economic interests should not be underestimated. Therefore, it does not seem unfounded to expect that both KMI and WMB will continue to be able to pay dividends during a recession, even if neither company can fully fund them out of their own pockets.
After rebasing its dividend in 2016, KMI once again began increasing its payout to shareholders in 2018, and has done so at a five-year CAGR of 17%, when including the 2022 increase. Of course, the payout slowed in recent years and the most recent increase only amounted to 2.8%, but the company nevertheless did not use the pandemic as an excuse to cut the dividend once again. KMI’s 2021 payout ratio is 57% of pre-impairment FCF, significantly below the three-year average payout ratio of 81%.
WMB also had to cut its dividend in 2016, from a quarterly $0.64 to $0.20, beginning with the September payment. Its five-year CAGR of 7% since 2017 again confirms WMB’s worse position in terms of cash flow generation, but the company nevertheless elected to also increase its dividend during 2020. WMB’s 2021 payout ratio is considerably higher than KMI’s, at 81% of pre-impairment FCF, same as the three-year average payout ratio of 92%.
Neither KMI nor WMB pursue a sustainable dividend policy, as is underlined by the dividend cuts in 2016. This is somewhat concerning given the well-known cyclicality of the sector. On the one hand, this confirms that managements are in principle very shareholder friendly, but as an investor with a long-term mindset, I would prefer a less generous payout with a substantial buffer. It is also not very reassuring that WMB continues to dilute shareholders to fund growth (and/or the dividend). Competitors like the MLP Enterprise Products Partners (EPD) and the Canadian behemoth Enbridge (ENB) appear to be better alternatives, as is emphasized by the much stronger dividend records, with 23 and 27 years of consecutive increases, respectively. Of course, the tax-related issues with MLPs need to be considered with EPD.
In connection with future dividend increases, the debt profiles of KMI and WMB should also be reviewed. Interest rates are rising and as highly-leveraged companies, both could find themselves in a difficult situation at some point.
The weighted average interest rate for the almost exclusively fixed-interest debt is 4.6% for WMB and 5.1% for KMI. The companies paid $1.2 billion and $1.5 billion, respectively, in interest expense in 2021, representing about 31% and 35% of FCF before interest in that year, but it should be remembered that 2021 was already a pretty good year for midstream companies. 2022 will most likely be even better, but I would take the risk of a recession into account. In this context, the left-skewed maturity profiles are a bit concerning (Figure 7). Until 2031, 51% of KMI’s long-term debt matures, while WMB’s interest rate risk is even more pronounced because it is required to refinance 64% of its current long-term debt until 2031.
Figure 7: Upcoming debt maturities for KMI and WMB (own work, based on the companies’ 2021 10-K)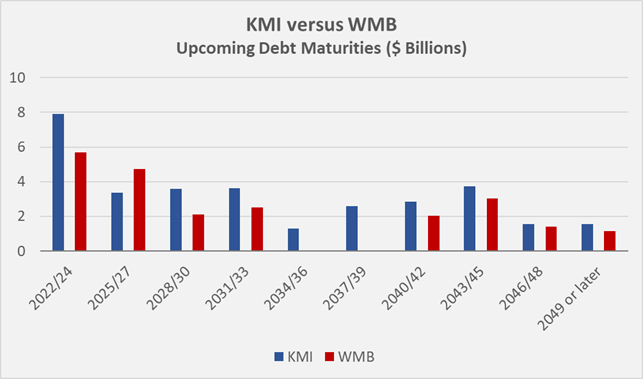
Conclusion – I Am Not Buying Either One At The Moment
Owning a midstream business in a diversified portfolio is certainly not a bad idea, in part because such companies have a distinct economic moat and high barriers to entry. However, I prefer to buy such companies near the bottom of the cycle, i.e., when demand is low. In retrospect, good entry points would have been in 2016 or 2021. The current dividend yields of KMI and WMB are still enticing, but in light of the relatively high payout ratios, the capital intensity of the businesses, and the lackluster returns on capital, I would expect a higher cash return from such an investment.
Of the two companies discussed herein, KMI is the better pick, even though management tends to overpromise and underdeliver at times. WMB’s weak cash flows, especially when taking impairment charges into account, are the prime reason why I would not invest in the company. In the end, what is the point of earning dividends that are paid via debt – such a process is hardly sustainable and it also puts the balance sheet in jeopardy.
WMB continues to dilute shareholders to fund growth, and we have seen how this has worked out for KMI shareholders. Trust in management is still not fully restored after six years, and it seems likely that shareholders of WMB could be in for a rough ride should we indeed face a deep recession with the associated decline in fossil fuel demand.
The companies are heavily indebted, and this is unlikely to change given the increasing investment in maintenance and meeting coming demand. If energy prices remain at a high level and the U.S. capitalizes on its strengthened position in LNG exports, both companies should have no problems servicing their debt and will most likely even increase their distributions to shareholders. Against this backdrop, the fact that both companies are likely to face rising interest payments, with more than 50% of long-term debt maturing in the next decade, is not unduly worrying.
Thank you very much for taking the time to read my article. In case of any questions or comments, I’m very happy to read from you in the comments section below.
Be the first to comment