

diegograndi/iStock via Getty Images
Introduction
Transocean (NYSE:RIG) released its second quarter 2021 results on August 1, 2022.
Also, Transocean published its fleet Status Report on July 25, 2022.
The company indicated, “The aggregate incremental backlog associated with these fixtures is approximately $650 million. As of July 25, the company’s total backlog is approximately $6.2 billion.”
Since then, Transocean announced two more significant contracts for a total of a $1,236 million backlog. It was a piece of impressive news showing some contracting turnaround that was not present until now.
- The Petrobras 10000 received a 5.8-year contract for work offshore Brazil with a national oil company. The contract is worth $915 million.
- The Deepwater Conqueror has been awarded a two-year contract by a major operator for work in the U.S. Gulf of Mexico at $440K per day with up to an incremental $39K per day for additional products and services. The additional backlog is $321 million.
Thus, as of August 1, 2022, the estimated backlog jumped to $7.4 billion. The first noticeable increase in the backlog that the company registered for many years, as we can see below.
Note: I have followed RIG quarterly since 2014 with 133 articles and counting. This new article is a quarterly update of my article published on June 13, 2022.
1 – 2Q22 Results snapshot
Transocean came out with a better-than-expected quarterly loss of $68 million or $0.10 per share compared to a loss of $0.17 per share a year ago.
Cash from operations was $39 million, and quarterly free cash flow was estimated at a loss of $76 million in 2Q22.
Operating and maintenance expense was $433 million, compared to $412 million in the prior period. Inflationary pressure starts to bite.
However, despite a better-than-expected quarter loss, we can see that the company cannot generate a profit.
Below is the backlog history since 2015. The backlog has dropped continuously despite two acquisitions (Songa Offshore and Ocean Rig) and has reached a low of $6.1 billion in 1Q22.
However, the company is now turning around, and contracts are finally showing improvements in duration and daily rate. It is what I called “show me the money,” and Transocean did it this quarter.
RIG Quarterly Backlog history (Fun Trading)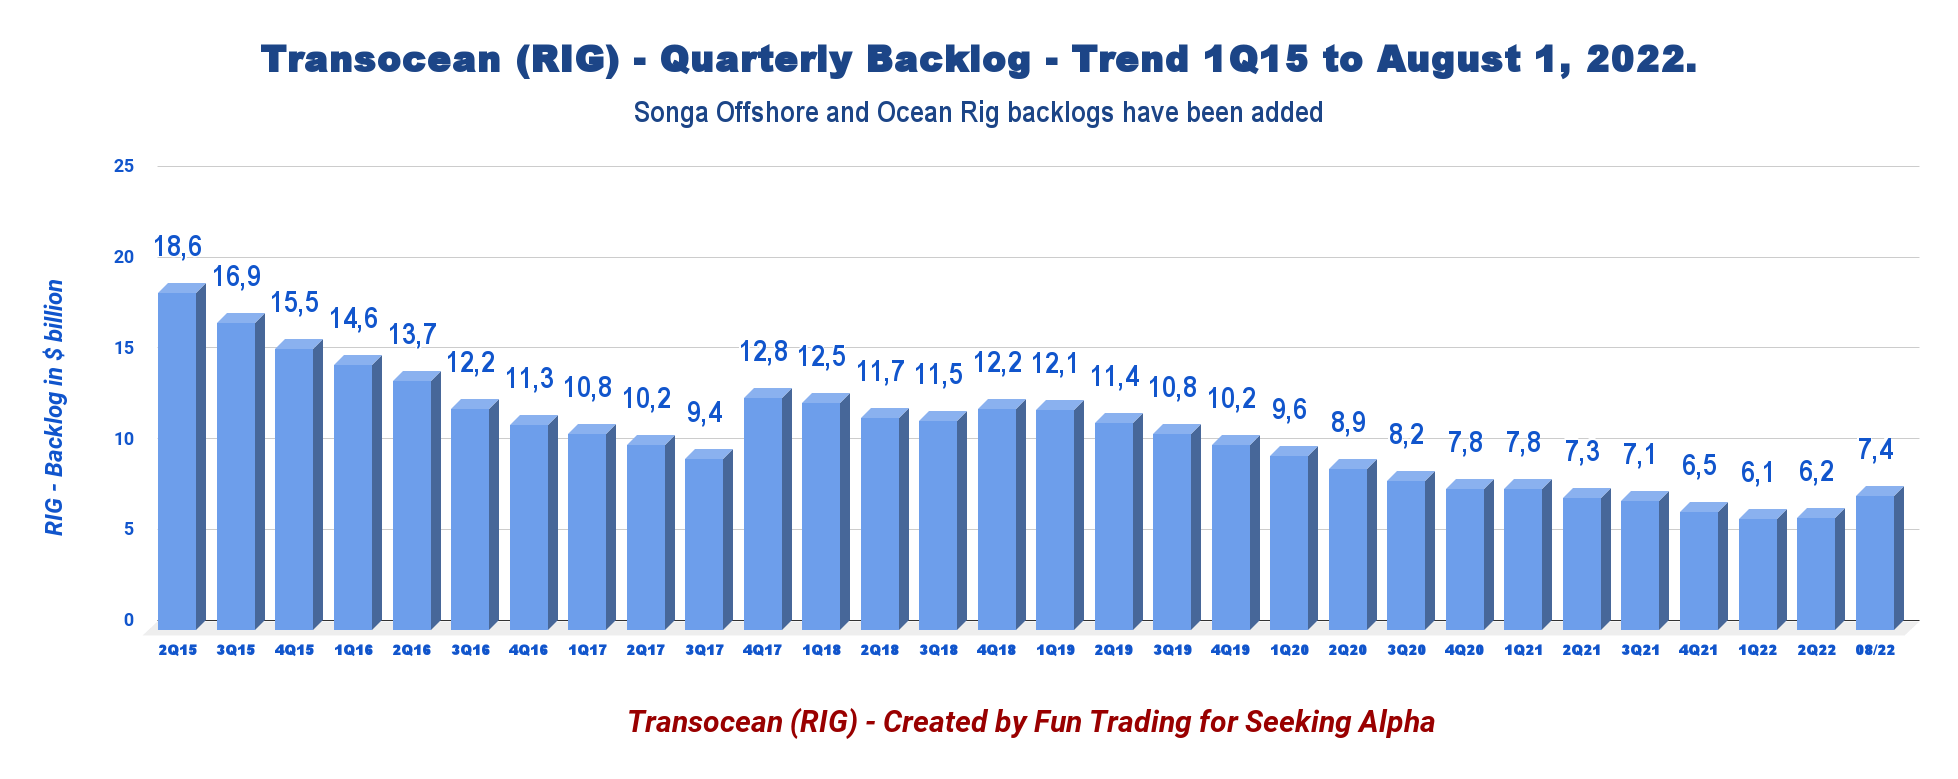
Transocean’s Ultra-deepwater floater’s revenues represented 65.2% of the total contract drilling revenues, while Harsh Environment floaters accounted for the remaining 34.8%. Also, the ultra-Deepwater backlog represents approximately 87% of the total backlog.
During 2Q22, revenues from the Ultra-deepwater and HE floaters are $451 million and $241 million, from $390 million and $196 million in 2Q21.
2 – Investment thesis
Despite a rally in oil prices that seem to be triggering some positive responses in the offshore drilling sector, it took Transocean more than two quarters to show some improvements in the backlog. Better late than never.
The world economy is slowly entering a recession induced by the FED that will affect oil demand and ultimately push oil prices lower. The company’s balance sheet is still weak with a massive debt burden, but we can notice slow progress. Unfortunately, it is not strong enough to convince me to go long again.
Interest rates will tend to rise, partly because of higher inflation rates and partly because of the higher level of expected defaults. This debt pattern will reinforce the tendency toward lower GDP growth compared to energy consumption growth. This is a major reason that raising interest rates now is likely to push the economy downward.
Second, the company’s debt load is highly toxic and has prevented the company from competing fairly against peers that restructured last year and are more solid financially now.
In short, RIG is not suited for a savvy investor’s portfolio but fits a special kind of trader looking for high risk/reward potential. It lacks dividends, the business generates recurring losses, and the company struggles with a massive debt load.
Thus, nothing has changed since my preceding article. It is essential to trade short-term LIFO about 60%-70% of your RIG holding and keep a small long-term core position for a higher target. This dual strategy entitles you to take full advantage of the offshore drilling sector’s high volatility and inherent cyclicity. It is what I recommend in my marketplace, “The Gold and Oil Corner.”
3 – Stock performance
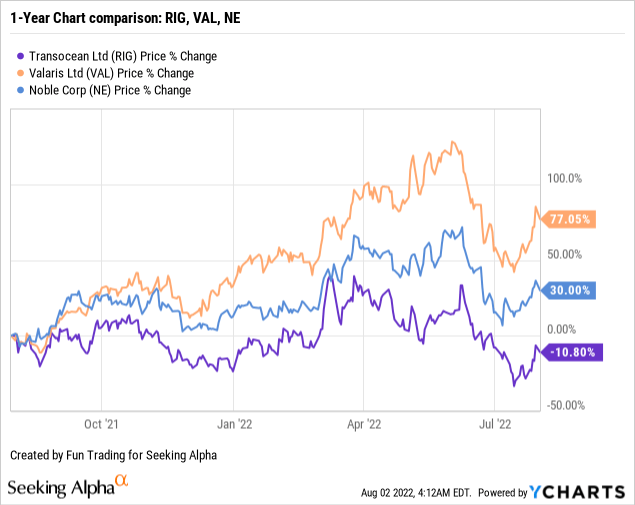
Transocean has significantly underperformed Valaris Ltd. and Noble on a one-year basis. RIG is now down 11% on a one-year basis.
4 – Average day rates and utilization for 2Q22
The first quarter average day rate decreased to $358.1k/d from the year-ago level of $369.4k/d. However, the average daily rate increased significantly sequentially, which is encouraging. Utilization increased from the same quarter a year ago to reach 58.2%.
| Day rates | 2Q21 | 3Q21 | 4Q21 | 1Q22 | 2Q22 |
| The average daily rate is $k/d | 369.4 | 367.1 | 352.5 | 334.5 | 358.1 |
| Average Utilization | 55% | 53% | 53.4% | 52.7% | 58.2% |
Transocean – 2Q22 and Selected Financials History – The Raw Numbers
| Transocean | 2Q21 | 3Q21 | 4Q21 | 1Q22 | 2Q22 |
| Total contract drilling in $ Billion | 0.656 | 0.626 | 0.621 | 0.586 | 0.692 |
| Net Income in $ Million | -103 | -130 | -260 | -175 | -68 |
| EBITDA $ Million | 255 | 249 | 192 | 165 | 245* |
| EPS diluted in $/share | -0.17 | -0.20 | -0.40 | -0.26 | -0.10 |
| Cash from operating activities in $ Million | 153 | 141 | 185 | -1 | 39 |
| Capital Expenditure in $ Million | 41 | 37 | 71 | 106 | 115 |
| Free Cash Flow in $ Million | 112 | 104 | 114 | -107 | -76** |
| Cash and short-term investments $ Billion | 0.988 | 0.900 | 0.976 | 0.911 | 0.729 |
| Long-term debt in $ Billion (including current) | 7.527 | 7.348 | 7.170 | 7.011 | 7.223 |
| Shares outstanding (diluted) in Million | 621 | 653 | 658 | 664 | 692 |
| Backlog | 2Q21 | 3Q21 | 4Q21 | 1Q22 | 2Q22 |
| RIG Backlog in $ billion | 7.3 | 7.1 | 6.5 | 6.1 | 6.2/7.4 |
Source: press release
* Indicated by the company
** Estimated by Fun Trading
Analysis: Revenues, Earnings Details, Free Cash Flow, and Net Debt
1 – The company posted quarterly revenues of $692 million in 2Q22
Note: The total adjusted contract drilling revenues were $722 million, from $615 million in 2Q21.
RIG Quarterly Revenues history (Fun Trading)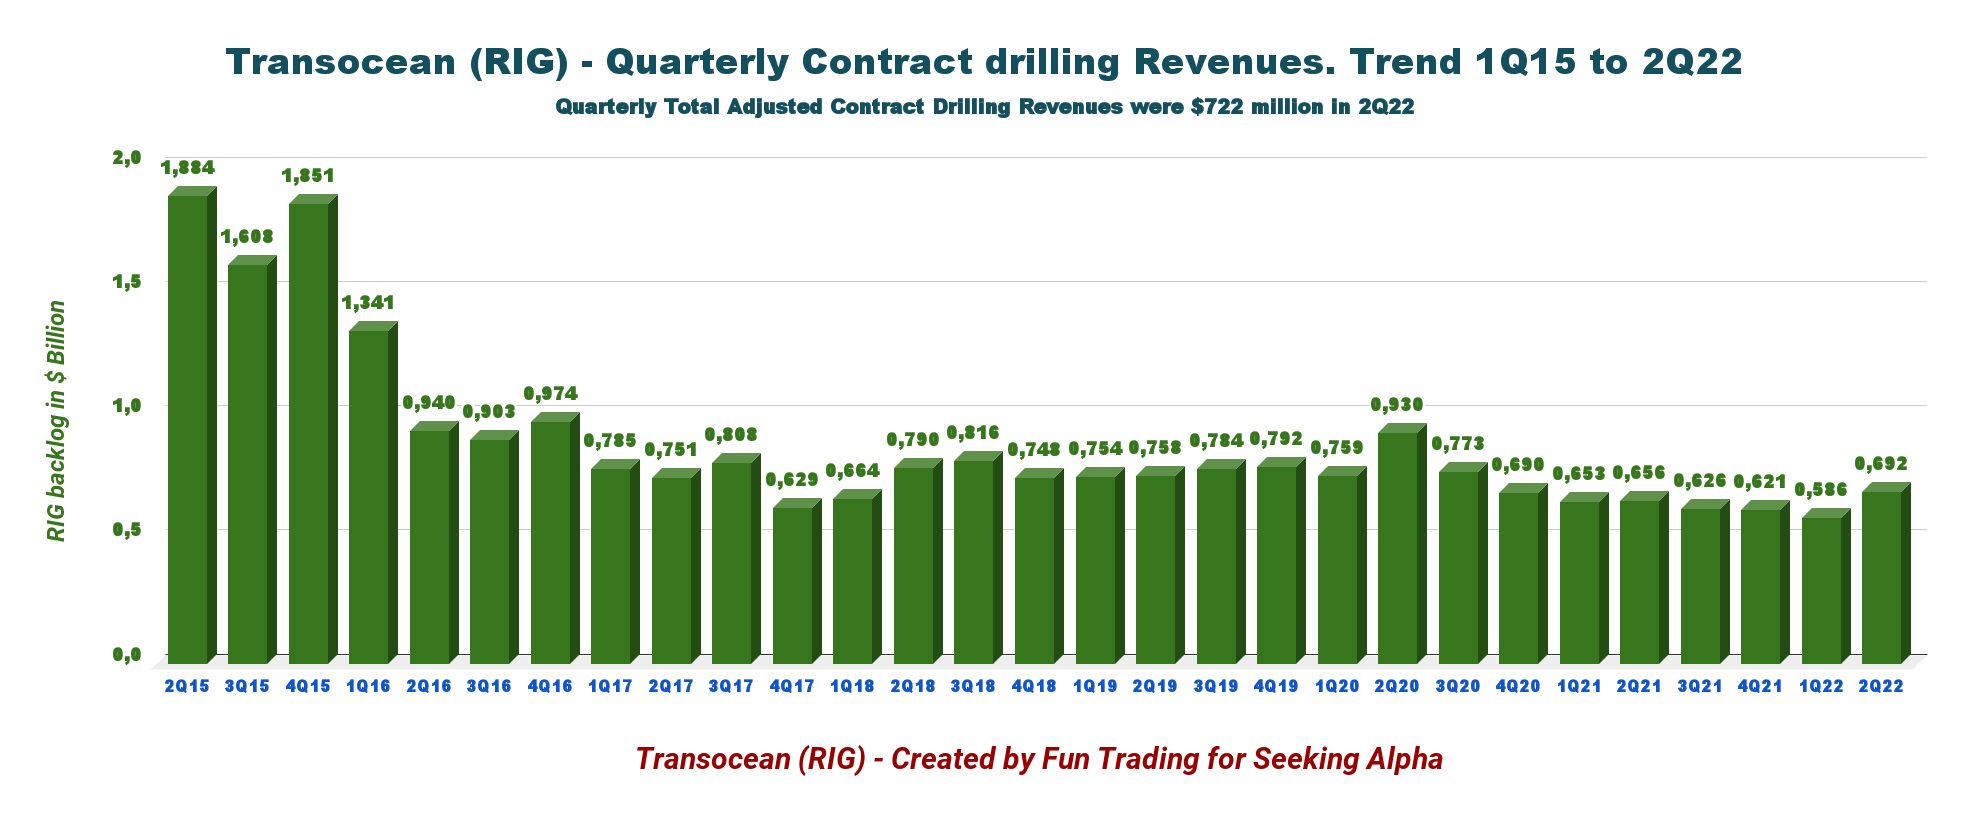
Transocean’s revenues in 2Q22 increased to $692 million from $656 million in 2Q21, an increase of 5.5%. Total adjusted contract drilling revenues were $722 million in 2Q22. Revenue efficiency was high this quarter at 97.8%, compared to 94.9% in the prior quarter.
The net loss in the second quarter of 2022 was $68 million or $0.10 per diluted share.
The adjusted EBITDA was $245 million, compared to $165 million in the prior quarter. The 2Q22 earnings beat analysts’ expectations. In the press release:
Contract drilling revenues for the three months ended June 30, 2022, increased sequentially by $106 million to $692 million, primarily due to three rigs that returned to work after being idle in the prior quarter, increased dayrate for three rigs, higher revenue efficiency and one additional calendar day in the second quarter, partially offset by reduced activity for two rigs that were warm stacked in the second quarter of 2022.
2 – Free cash flow was a loss estimated at $76 million in 2Q22
RIG Quarterly Free cash flow history (Fun Trading)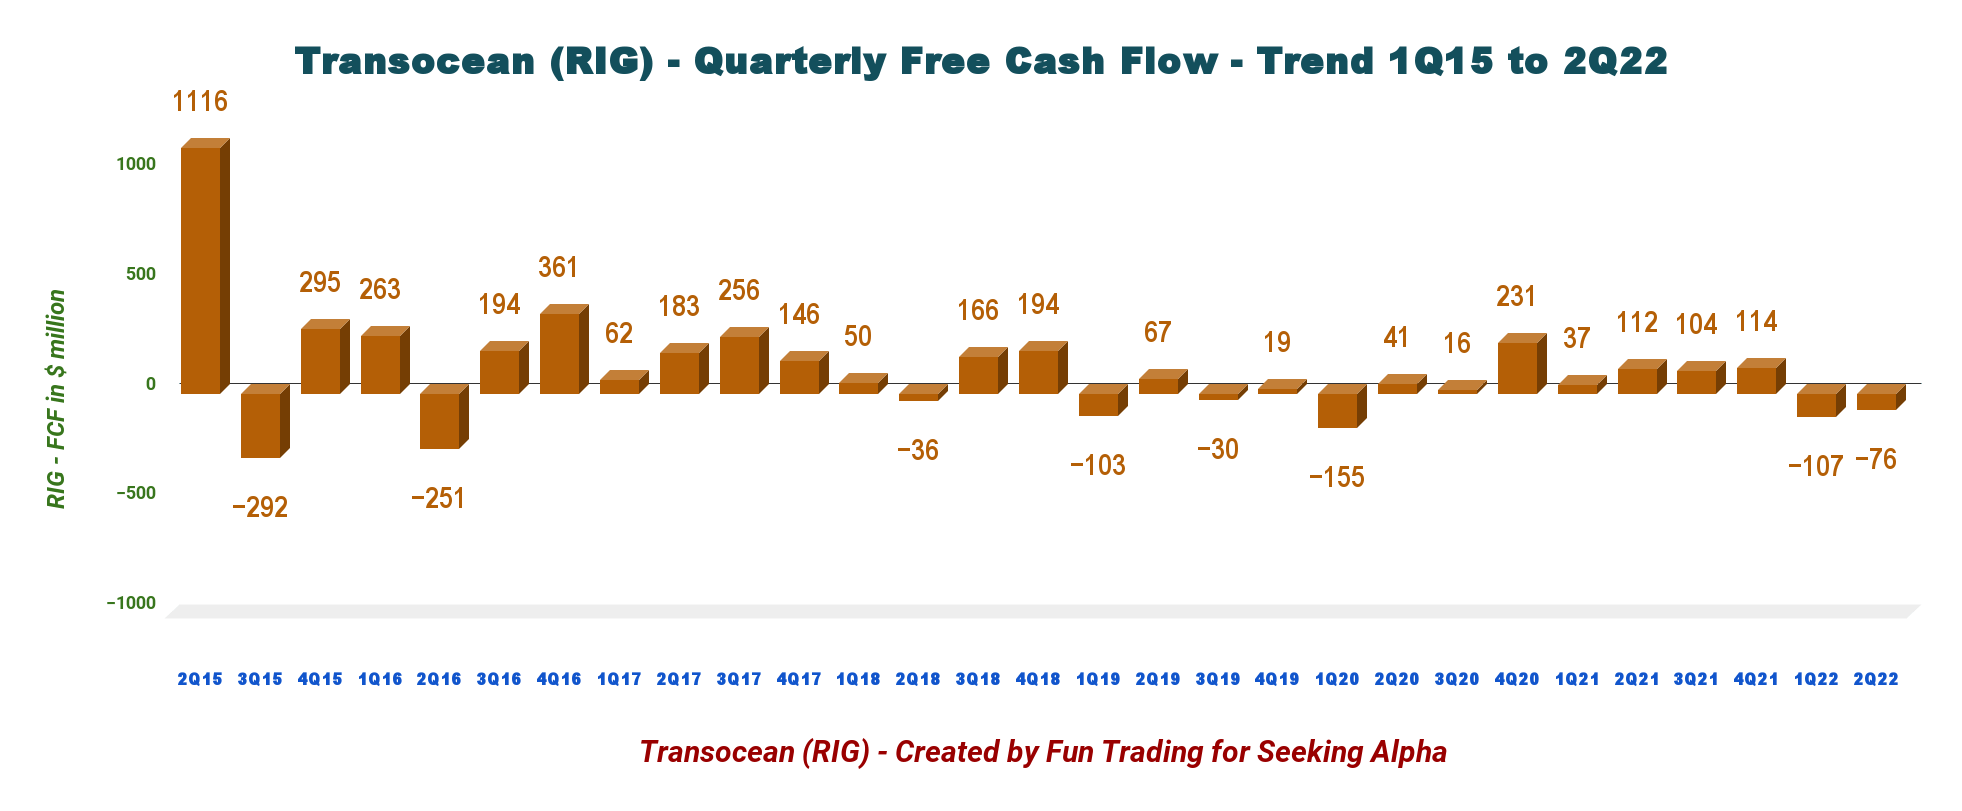
Important Note: The generic free cash flow is the cash from operating activities minus CapEx.
RIG had a free cash flow loss estimated at $76 million in 2Q22. Trailing 12-month free cash flow was $35 million.
3 – Net debt (gross debt minus total cash) increased to $6.5 billion in 2Q22
RIG Quarterly Cash versus Debt history (Fun Trading)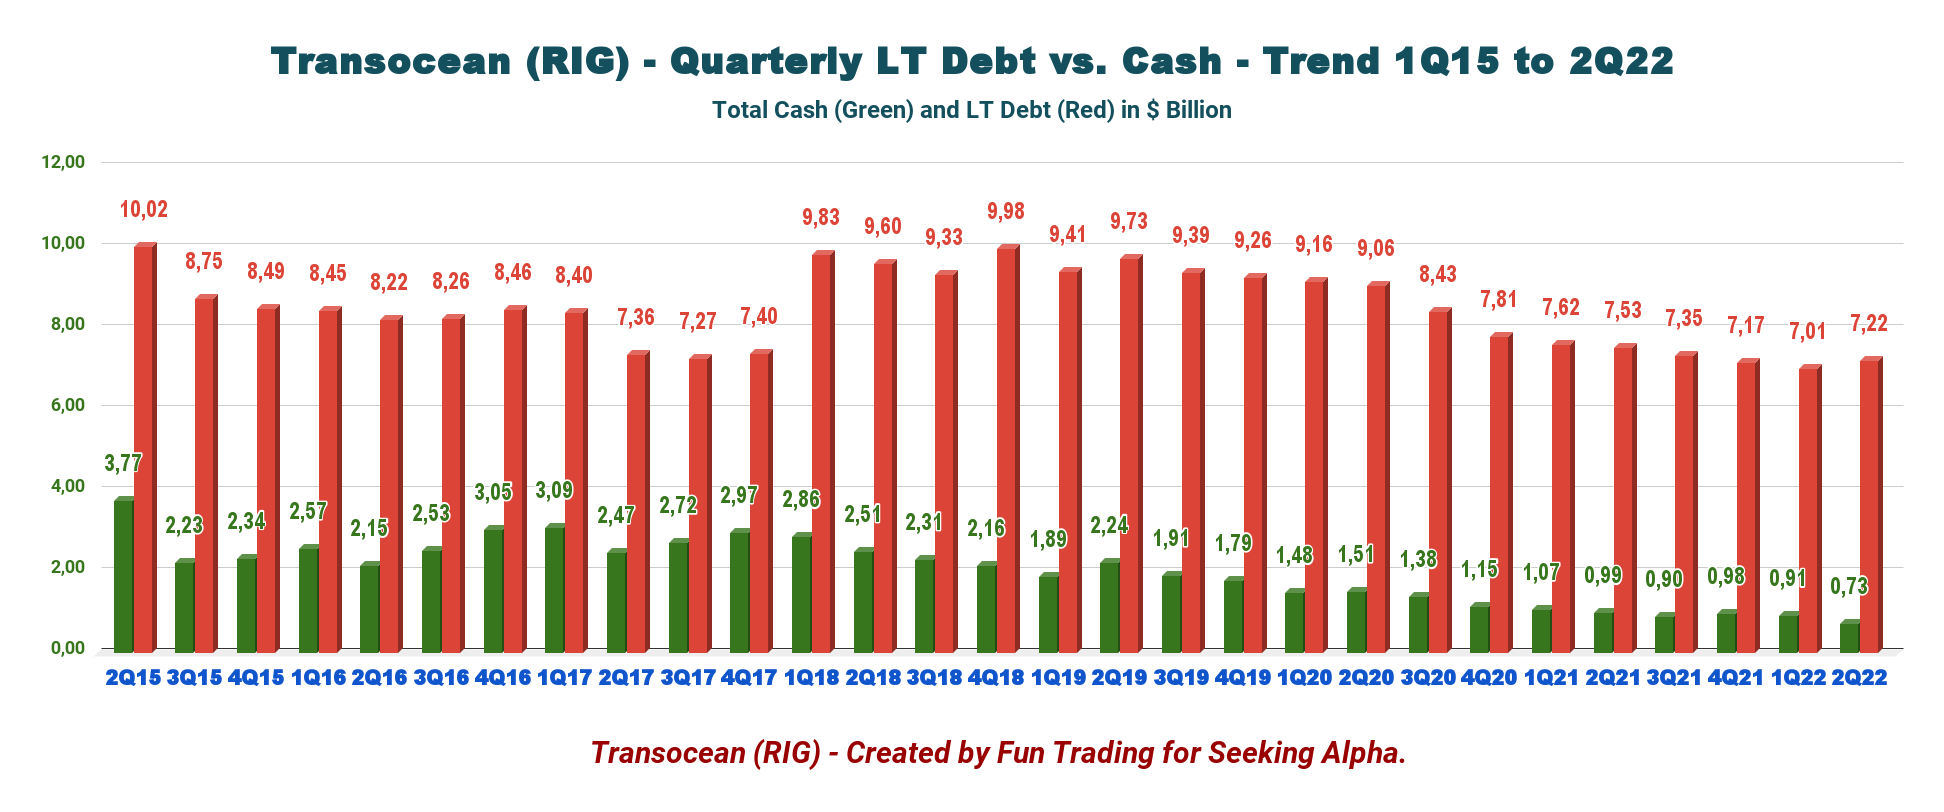
Net debt is about $6.5 billion as of June 30, 2022, compared to $6.54 billion in the same quarter a year ago. Total liabilities increased yearly from $1,303 million to $1,533 million.
However, the total cash was $729 million, down significantly sequentially (please see the chart above). It is probably due to the cash payment of the Deepwater Atlas.
Second quarter 2022 capital expenditures increased to $115 million from $106 million in the prior quarter, primarily due to payments related to the company’s newbuild drillships under construction, including the cash component of the final milestone payment for the delivery of Deepwater Atlas in June 2022.
Transocean’s debt structure is the leading cause for concern, as the company has $7.22 billion in debt (including current) and is still unable to be profitable on a net income basis. RIG has lost about $633 million in the past four quarters.
On July 27, 2022, Transocean amended the bank credit agreement for its Secured Credit Facility to extend the maturity date from June 22, 2023, to June 22, 2025.
The borrowing capacity is $773.5 million through June 22, 2023, and, after that, is $600 million through June 22, 2025.
The amended secured credit facility also permits the company to increase the aggregate amount of commitments by up to $250 million. I believe it was a good move for the company.
However, the negotiations were not painless with the bank, and Transocean had to reduce the borrowing capacity from $1.33 billion to $773.5 million until June 22, 2023, and after that, reduce the borrowing capacity to $600 million until June 22, 2025. The lenders are still not comfortable with the massive debt load.
Technical Analysis and Commentary
RIG TA Chart Short-term (Fun Trading)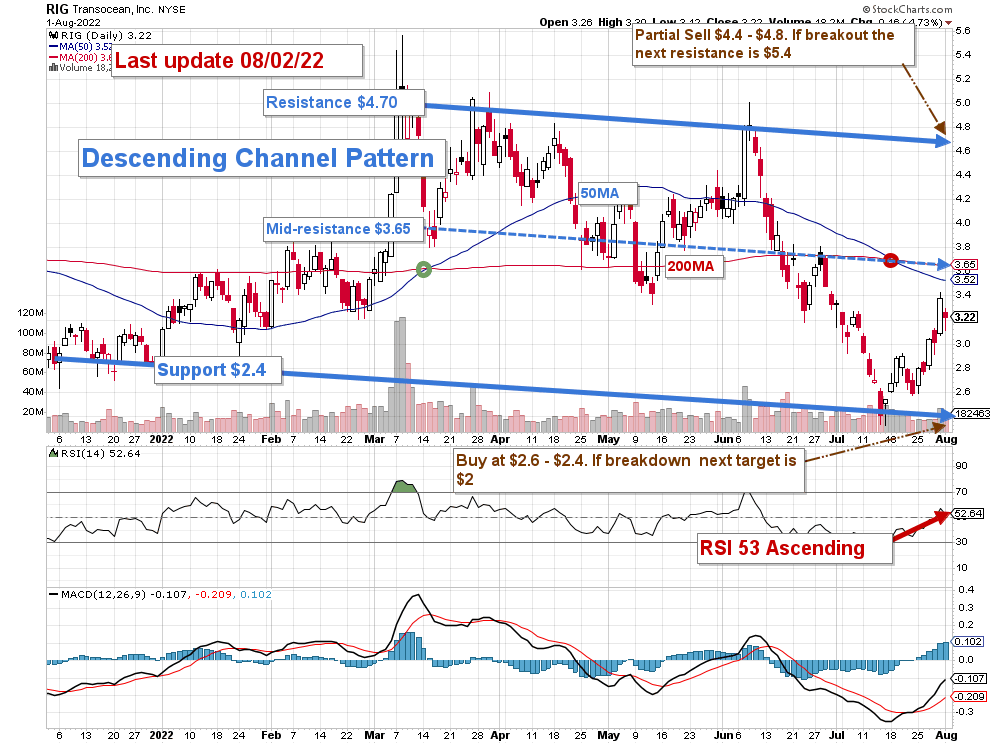
RIG forms a descending channel pattern with resistance at $4.70 and support at $2.40. I see a mid-resistance/support at $3.65 (200MA).
The overall strategy that I suggest in my marketplace, “The Gold And Oil Corner,” is to keep a tiny long-term position and use about 80% to trade LIFO (see note below) while waiting for a higher final price target for your core position between $5 and $6.
The trading strategy is to sell ~20% between $3.55 and $3.65 (200MA) and another 60% above $4.50. I suggest waiting for a retracement between $3.15 and $2.40 to accumulate again.
However, if RIG can successfully cross the mid-resistance at $3.65, it will become support, and it would make sense to start buying at this level, assuming you took profits above $4.50.
RIG will move with the general oil sector and may enter a period of consolidation if oil prices cannot hold their overheated levels. The risk of a recession in 4Q22 is increasing, and oil demand may drop significantly, affecting oil prices and the oil industry.
Note: The LIFO method is prohibited under International Financial Reporting Standards (IFRS), though it is permitted in the United States by Generally Accepted Accounting Principles (GAAP). Therefore, only US traders can apply this method. Those who cannot trade LIFO can use an alternative by setting two different accounts for the same stock, one for the long term and one for short-term trading.
Warning: The TA chart must be updated frequently to be relevant. It is what I am doing in my stock tracker. The chart above has a possible validity of about a week. Remember, the TA chart is a tool only to help you adopt the right strategy. It is not a way to foresee the future. No one and nothing can.
Author’s note: If you find value in this article and would like to encourage such continued efforts, please click the “Like” button below to vote for support. Thanks.
Be the first to comment