

Matthew Lloyd
This article is part of a series that provides an ongoing analysis of the changes made to GMO’s 13F stock portfolio on a quarterly basis. It is based on GMO’s regulatory 13F Form filed on 11/10/2022. Jeremy Grantham’s 13F portfolio value decreased ~6% from $18.46B to $17.33B this quarter. The portfolio is diversified with recent 13F reports showing well over 500 different positions although most of them are very small. There are 45 securities that are significantly large (more than 0.5% of the portfolio each) and they are the focus of this article. The largest five stakes are Microsoft Corporation, UnitedHealth, Johnson & Johnson, Apple, and Wells Fargo. They add up to ~15% of the portfolio. Please visit our Tracking Jeremy Grantham’s GMO Portfolio series to get an idea of their investment philosophy and our last report for the fund’s moves during Q2 2022.
As of September 30, 2022, GMO’s 7-year asset class real return forecast is for US Large Cap asset class to have a positive 0.8% annualized return on one end and Emerging Value asset class to have a positive 10.6% annualized return at the other extreme. The firm currently has ~$65B under management, a far cry from ~$120B that they had at the peak. The assets are distributed among separately managed, institutional, and mutual fund accounts. Their flag ship mutual fund is GMO Benchmark-Free Allocation Fund (MUTF:GBMFX) which was incepted in 2003.
Note 1: It was reported in December 2020 that Jeremy Grantham has a ~4.8M share stake in QuantumScape (QS). The ~$12.5M investment was made 7 years ago as part of a series of bets on early-stage “green technology” companies.
Note 2: Jeremy Grantham has repeatedly said the US stock market is in a bubble since June 2020. The latest was a research note in early August to prepare for an “epic finale” to the deflating of the super bubble.
Stake Increases:
Johnson & Johnson (JNJ): JNJ is a very long-term stake. In their first 13F filing in 2005, the position was at ~170K shares. The sizing peaked at around 26M shares in 2009. The stake was sold down by ~40% in 2014 at prices between $88 and $109. 2016 saw another ~50% selling at prices between $97 and $125. Recent activity follows. H2 2019 saw a 23% stake increase at prices between $127 and $146. There was another one-third increase this quarter at prices between ~$161 and ~$180. The stock currently trades at ~$176 and the stake is at 2.83% of the portfolio.
Oracle Corporation (ORCL): The 1.69% ORCL position is a very long-term stake. The position was already at around 14M shares in 2007. The next two years saw the stake built to a much larger 62M share position at prices between $15.50 and $24.50. Next few years saw selling at higher prices and by 2017 the stake was back at 14M shares. The five quarters thru Q2 2019 saw another ~45% selling at prices between $44 and $57. Q1 2020 also saw a ~18% reduction at prices between ~$40 and ~$56. Last three quarters saw another ~30% selling at prices between ~$64 and ~$104. The stock is currently at $79.73. There was a marginal increase this quarter.
Lam Research (LRCX): The 1.60% LRCX stake was built in Q3 2020 at prices between ~$294 and ~$385 and the stock is now at ~$457. Last few quarters have seen only minor adjustments.
Meta Platforms (META) previously Facebook: META is a 1.41% of the portfolio position purchased in Q1 2018 at prices between ~$160 and ~$190. The stake had seen incremental buying since. There was a ~25% stake increase last quarter at prices between ~$156 and ~$234. That was followed with a ~12% increase this quarter at prices between ~$134 and ~$183. The stock is now well below their purchase price ranges at ~$112.
Intuitive Surgical (ISRG): ISRG is a 0.66% of the portfolio position purchased last quarter at prices between ~$191 and ~$306. The stock currently trades at ~$262. There was a marginal increase this quarter.
Abbott Labs (ABT), Adobe Systems (ADBE), AGCO Corp (AGCO), American Express (AXP), Constellation Brands (STZ), Global Payments (GPN), Kosmos Energy (KOS), Mosaic Company (MOS), Otis Worldwide (OTIS), Salesforce.com (CRM), SolarEdge Technologies (SEDG), Teck Resources (TECK), Taiwan Semiconductor (TSM), and UBS Group AG (UBS): These small (less than ~1.5% of the portfolio each) stakes were increased this quarter.
Stake Decreases:
Microsoft Corporation (MSFT): MSFT is currently the top position in the portfolio at 4.22%. It is a very long-term stake. The 2007-2008 period saw the stake built from ~5.6M shares to over 59M shares at prices between $19 and $35. The position size peaked in 2011 at ~68M shares. The next four years saw the stake sold down by ~80% at prices between $28 and $56. Recent activity follows: the three years through Q3 2020 saw a ~70% selling at prices between ~$88 and ~$232. There was a ~9% trimming in Q4 2021 while last quarter there was a similar increase. The stock currently trades at ~$241. There was minor ~2% trimming this quarter.
UnitedHealth Group (UNH): The top three 3.18% of the portfolio stake in UNH was already a very large ~18M share position in 2005. The position size peaked in 2007 at over 20.5M shares. The five years through 2019 had seen a ~75% selling at prices between $102 and $296. That was followed with a ~25% reduction last quarter at prices between ~$452 and ~$546. The stock is now at ~$530. There was marginal trimming this quarter. They are harvesting gains.
Apple Inc. (AAPL): AAPL is a top five 2.73% long-term stake. It was a large stake in 2005 but was sold down next year. The position was rebuilt in 2007 but was again sold down next year. Similar trading pattern continued over the next several years. The four years through 2019 saw a ~75% reduction at prices between ~$23 and ~$82. Q3 2020 saw another ~30% selling at prices between ~$91 and ~$134. That was followed with a ~20% reduction this quarter at prices between ~$137 and ~$175. The stock is now at ~$151.
Wells Fargo (WFC): The 2.37% WFC position was purchased in Q3 2017 at prices between $49.50 and $56. Q1 2020 saw a ~25% stake increase at prices between ~$25 and ~$49. That was followed with a ~30% stake increase in Q4 2020 at prices between ~$21 and ~$30. There was a ~18% selling over the next two quarters at prices between ~$30 and ~$48. The stock is now at $46.50. Last few quarters have seen only minor adjustments.
US Bancorp (USB): The 2.22% USB stake was purchased in 2017 at prices between $50 and $56 and the stock currently trades well below that range at $43.38. Q1 2020 saw a ~50% stake increase at prices between ~$29 and ~$55. Last several quarters have seen only minor adjustments.
Alphabet Inc. (GOOGL): GOOG is a 2.21% position. The long-term stake was built during the 2007-2014 timeframe at low prices. The position size peaked in 2014. Since then, the stake was reduced at prices between ~$25 and ~$150. The stock currently trades at ~$98. There was a marginal trimming this quarter.
Texas Instruments (TXN): TXN is a 2.08% of the portfolio position. The majority of the stake was purchased in Q3 & Q4 2016 at prices between $63 and $75. There was a ~20% stake increase in Q1 2022 at prices between ~$163 and ~$191. The stock currently trades at ~$175. There was a minor trimming in the last two quarters.
Coca-Cola (KO): KO is a 1.90% of the portfolio stake. The position was already a large 7M share stake in 2005. That original stake was built to 23.7M shares during the 2007-2008 timeframe at price between $20 and $32. The sizing peaked at almost 39M shares in 2012. The next five years saw the position sold down by ~90% to a ~3.7M share stake at prices between $37 and $47. Recent activity follows. Q1 2020 saw a ~75% stake increase at prices between $37.50 and $60. That was followed with a ~37% increase in Q3 2020 at prices between ~$44 and ~$51. Last quarter saw a similar reduction at prices between ~$59 and ~$66. The stock is now at ~$61. There was marginal trimming this quarter.
Elevance Health (ELV): ELV position was first purchased in 2014. The bulk of the current 1.87% portfolio stake was established in 2017 at prices between $144 and $232. There was a roughly one-third selling over the last two quarters at prices between ~$428 and ~$530. The stock currently trades at ~$495. There was a minor ~2% trimming this quarter.
Accenture plc (ACN): ACN became a significant part of the portfolio during the 2013-2014 timeframe when around 3.8M shares were purchased at prices between $69 and $85. The next five years had seen a combined ~50% reduction through minor selling most quarters. The two quarters through Q3 2021 saw another ~24% reduction at prices between ~$295 and ~$415. The stock currently trades at ~$287 and the stake is at 1.81% of the portfolio. There was a ~7% trimming this quarter.
TJX Companies (TJX): TJX is a 1.72% of the portfolio position that has been in the portfolio for well over fifteen years. The position has wavered. Last major activity was a ~25% stake increase in H1 2020 at prices between ~$37 and ~$63. The stock is now at ~$78. There was marginal trimming this quarter.
Merck & Co. (MRK): MRK is a very long-term stake. In 2014, it was sold down to a very small position at prices between $50 and $62. The stake was rebuilt in H1 2018 at prices between $53 and $63. Q1 2020 saw a ~20% selling at prices between ~$66 and ~$92. The seven quarters through Q1 2022 had seen a ~30% stake increase at prices between ~$69 and ~$88. There was a ~20% reduction last quarter at prices between ~$84 and ~$95. The stock currently trades at ~$104, and the stake is at 1.54% of the portfolio. This quarter saw marginal trimming.
Amazon.com (AMZN), Ameresco (AMRC), BP plc (BP), Canadian Solar (CSIQ), Cigna (CI), Cisco Systems (CSCO), Darling Ingredients (DAR), Eli Lilly (LLY), KLA Corp (KLAC), Medtronic Inc. (MDT), Quest Diagnostics (DGX), Sociedad Quimica y Minera (SQM), Sunrun Inc. (RUN), and Visa Inc. (V): These very small (less than ~1.5% of the portfolio each) positions were reduced this quarter.
Below is a spreadsheet that shows the changes to Jeremy Grantham’s GMO Capital 13F portfolio holdings as of Q3 2022:
Jeremy Grantham – GMO Capital’s Q3 2022 13F Report Q/Q Comparison (John Vincent (author))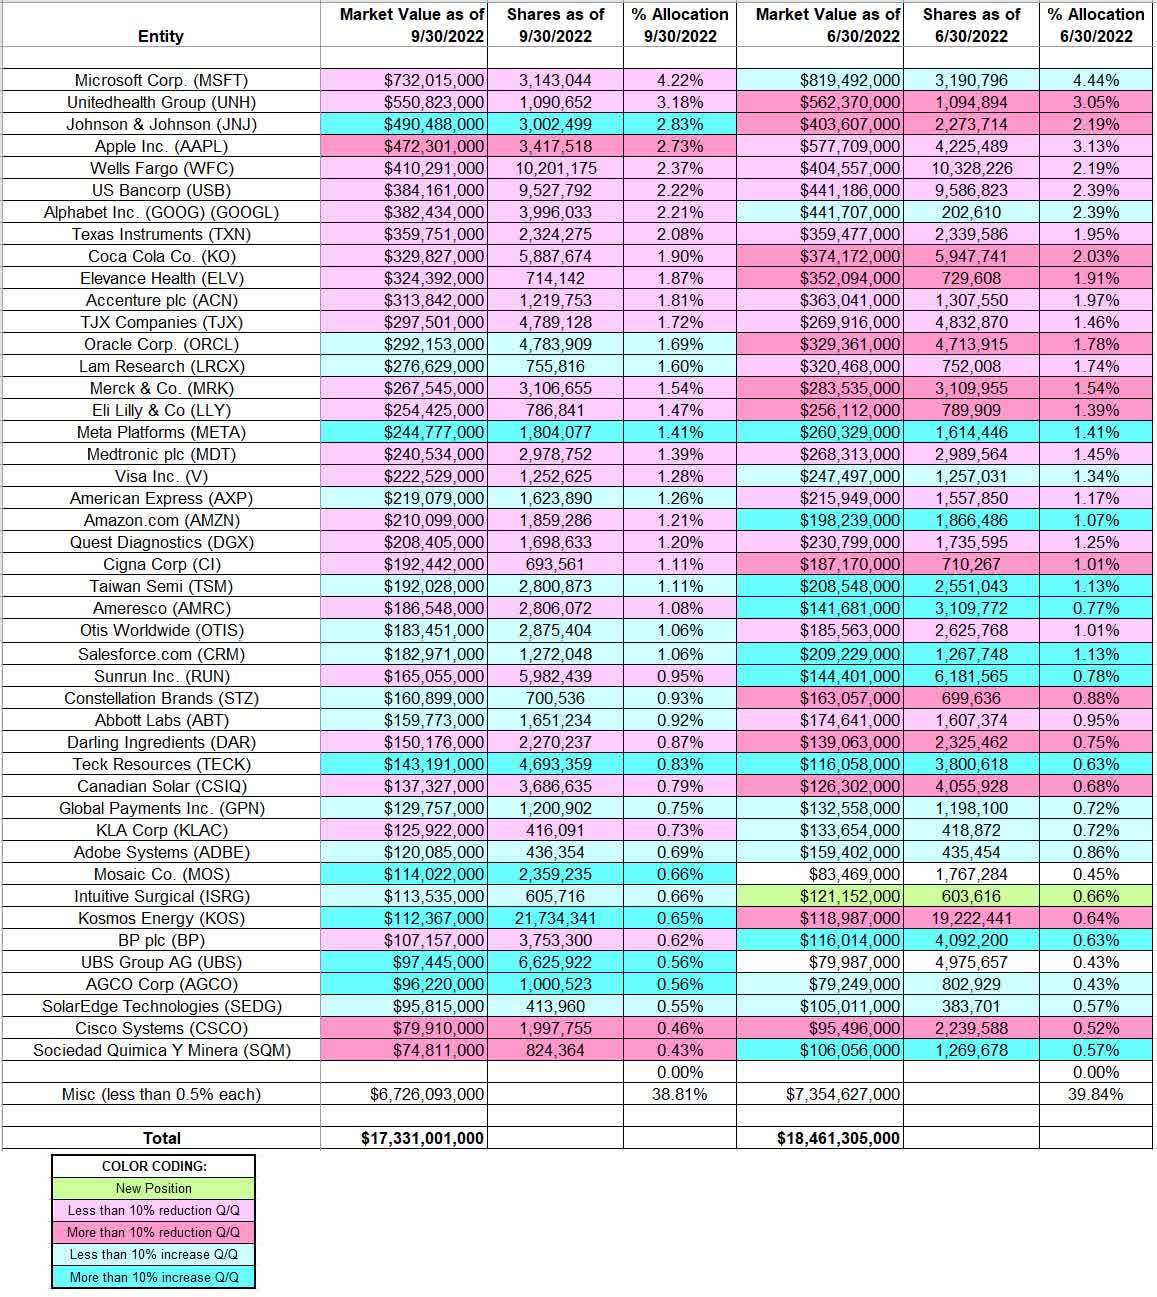
Source: John Vincent. Data constructed from GMO Capital’s 13F filings for Q2 2022 and Q3 2022.
Be the first to comment