

Drew Angerer
This article was coproduced with Dividend Sensei.
Are you feeling whiplash from the market of 2022?
We’ve seen wild plunges, huge rallies, and sentiment swings that are hard to believe.
Ask 10 economists what they think is coming next for the economy, and you’ll get 30 answers, each backed up a reasonable argument.
But the difference between long-term success with investing, and achieving your dreams of a rich retirement, doesn’t hinge on knowing what the economy, interest rates, or stocks will do in the short term.
Warren Buffett is the greatest example of someone who never tries to time the market but focused purely on the fundamentals of successful investing.
-
great companies
-
with strong moats
-
bought at reasonable to attractive valuations
-
held for the long-term
Many investors are familiar with Buffett’s famous quote to “be greedy when others are fearful.” In October 2008, he put this into practice, buying billions worth of US blue-chips as Wall Street fell 16% in a single month.
Buffett wasn’t just “greedy when others were fearful,” he even wrote a NYT op-ed article recommending everyone “Buy American, I Am.”
Guess what happened next?
After stocks had fallen almost 40%, the historical bear market bottom, you might think that the “Oracle of Omaha” must have nailed the bottom, right?
Wrong, stocks fell 31% more over the next six months.
Did Buffett panic?
Did he feel like a fool for buying too early when so many people in hindsight claimed it was “obvious” that stocks had so much further to fall?
No, he kept on buying the entire way down.
And do you know what Buffett and everyone who followed his advice to blue-chip bargain hunt got for their terrible market timing?
480% returns in US stocks over the next 14 years, even with the 31% plunge coming first.
In other words, the wrong question to ask for long-term investors is “what will stocks do next.” The right question is “what will stocks do over the next 10 years?”
If you blue-chip bargain hunt in a bear market, in 10 years, you’ll feel like a stock market genius who bought the bottom.
It’s in that classic Buffett-style of buy great companies at attractive prices that I want to recommend Toronto-Dominion Bank (NYSE:TD). This world-beater is a wonderful 4.2% yielding opportunity to generate generous yield today and potentially life-changing returns in the coming years and decades.
So let me show you the four reasons why I just recommended TD for DK members and why you might also want to buy more of this wonderful company at a wonderful price.
Reason One: Toronto-Dominion Is The Complete Package
Bottom line up front on TD.
-
a Canadian Company: foreign diversification
-
15% tax withholding (not in retirement accounts) – tax credit available to recoup withheld dividend
Reasons To Potentially Buy Toronto-Dominion Today
|
Metric |
Toronto-Dominion Bank |
|
Quality |
88% 13/13 Ultra SWAN |
|
Risk Rating |
Low |
|
DK Master List Quality Ranking (Out Of 500 Companies) |
103 |
|
Quality Percentile |
80% |
|
Dividend Growth Streak (Years) |
11 |
|
Dividend Yield |
4.20% |
|
Dividend Safety Score |
88% Very Safe |
|
Average Recession Dividend Cut Risk |
0.5% |
|
Severe Recession Dividend Cut Risk |
1.3% |
|
S&P Credit Rating |
AA- Stable |
|
30-Year Bankruptcy Risk |
0.55% |
|
Consensus LT Risk-Management Industry Percentile |
79% Good, Bordering on Very Good Risk-Management |
|
Fair Value |
$78.33 |
|
Current Price |
$65.75 |
|
Discount To Fair Value |
16% |
|
DK Rating |
Potentially Strong Buy |
|
P/E |
9.8 |
|
Historical P/E Range |
11.9 to 12.1 |
|
LT Growth Consensus/Management Guidance |
6.9% |
|
PEG Ratio |
1.4 |
|
5-year consensus total return potential |
11% to 16% CAGR |
|
Base Case 5-year consensus return potential |
14% CAGR (2X S&P 500 consensus) |
|
Consensus 12-month total return forecast |
19% |
|
Fundamentally Justified 12-Month Return Potential |
23% |
|
LT Consensus Total Return Potential |
11.1% CAGR |
|
Inflation-Adjusted Consensus LT Return Potential |
8.9% |
|
Consensus 10-Year Inflation-Adjusted Total Return Potential (Ignoring Valuation) |
2.34 |
|
LT Risk-Adjusted Expected Return |
7.73% |
|
LT Risk-And Inflation-Adjusted Return Potential |
5.51% |
|
Conservative Years To Double |
13.07 |
(Source: DK Zen Research Terminal)
According to rating agencies, TD is the safest bank in Canada and the 11th safest non-government-owned bank.
-
Out of 1,460 major global banks
-
99th percentile safety
Growth Outlook Remains Intact Despite Rising Recession Risk
|
Metric |
2021 Growth |
2022 Growth Consensus |
2023 Growth Consensus (Recession Expected) |
2024 Growth Consensus |
|
Sales |
-7% |
-12% |
14% |
13% |
|
Dividend |
7% |
13% |
6% |
6% |
|
Operating Earnings |
48% |
3% |
9% |
12% |
|
Book Value |
5% |
3% |
7% |
10% |
(Source: FAST Graphs, FactSet)
Thanks to a weakening dollar being expected in 2023 and 2024, TD’s earnings growth is actually expected to accelerate during the coming recession.
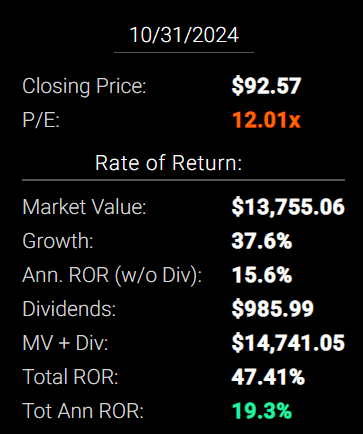
TD 2024 Consensus Total Return Potential
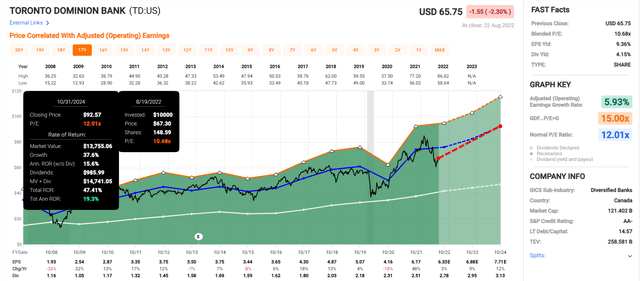
FAST Graphs
FAST Graphs
If TD grows as analysts expect through 2024 and returns to historical fair value, it could deliver 47% total returns or 19% annually.
-
1.7X better than the S&P 500
-
Buffett-like return potential from an Ultra SWAN bargain hiding in plain sight
Now compare that to the S&P 500 consensus.
S&P 2024 Consensus Total Return Potential
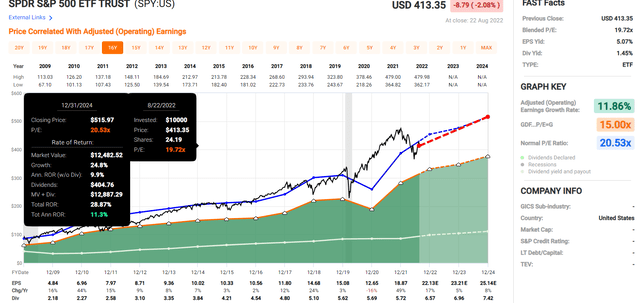
FAST Graphs
FAST Graphs
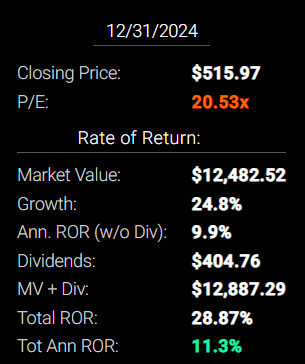
Analysts expect about 29% or 11% annual returns from the S&P 500 over the next 2.5 years.
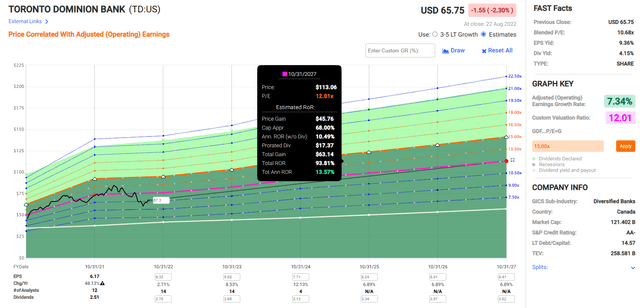
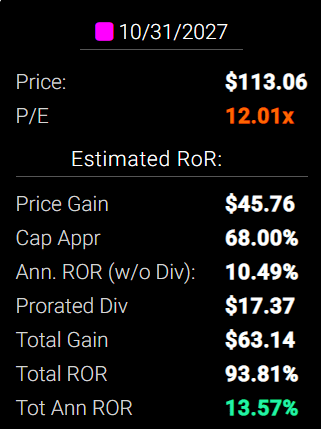
TD 2027 Consensus Total Return Potential
FAST Graphs
FAST Graphs
By 2027, if TD grows as expected and returns to historical mid-range historical fair value, it could deliver 94% or 14% annual returns.
-
2X more than the S&P 500 consensus
S&P 500 2027 Consensus Return Potential
|
Year |
Upside Potential By End of That Year |
Consensus CAGR Return Potential By End of That Year |
Probability-Weighted Return (Annualized) |
Inflation And Risk-Adjusted Expected Returns |
|
2027 |
45.94% |
7.85% |
5.89% |
3.62% |
(Source: DK S&P 500 Valuation And Total Return Tool)
Over the next five years, analysts expect about 46% total returns from the S&P 500, or 8% annually.
TD Long-Term Consensus Total Return Potential
|
Investment Strategy |
Yield |
LT Consensus Growth |
LT Consensus Total Return Potential |
Long-Term Risk-Adjusted Expected Return |
Long-Term Inflation And Risk-Adjusted Expected Returns |
Years To Double Your Inflation & Risk-Adjusted Wealth |
10-Year Inflation And Risk-Adjusted Expected Return |
|
Toronto-Dominion Bank |
4.2% |
6.9% |
11.1% |
7.8% |
5.6% |
13.0 |
1.72 |
|
Schwab US Dividend Equity ETF |
3.6% |
8.20% |
11.8% |
8.3% |
6.0% |
11.9 |
1.80 |
|
Dividend Aristocrats |
2.4% |
8.6% |
11.0% |
7.7% |
5.5% |
13.2 |
1.70 |
|
S&P 500 |
1.6% |
8.5% |
10.1% |
7.1% |
4.9% |
14.8 |
1.61 |
|
Nasdaq |
0.9% |
12.6% |
13.4% |
9.4% |
7.2% |
10.0 |
2.00 |
(Sources: Morningstar, FactSet, YCharts) – ignores valuation, which cancels out over 30+ years
Analysts think TD could outperform almost most popular investment strategy, including the S&P 500 and dividend aristocrats.
It’s expected to slightly underperform SCHD, the gold standard of high-yield ETFs.
TD Total Returns Since September 1996
TD has delivered strong 15% annual returns for 26 years, a 37X bagger.
TD has delivered consistent 13% to 14% annual returns over time, far more than the S&P 500 or JPMorgan, the quality king of US banks.
TD’s inflation-adjusted returns are 20X over 26 years, or almost 4X better than the S&P 500 and JPMorgan.
A Dividend Growth Blue-Chip You Can Trust
How impressive is TD’s dividend track record? Just take a look.
TD Cumulative Dividend Since 1997: $1,000 Initial Investment
|
Metric |
S&P 500 |
JPMorgan |
Toronto-Dominion Bank |
|
Total Dividends |
$1,684 |
$3,020 |
$14,313 |
|
Annualized Income Growth Rate |
7.9% |
11.5% |
10.5% |
|
Total Income/Initial Investment |
1.68 |
3.02 |
14.31 |
|
Inflation-Adjusted Income/Initial Investment |
0.91 |
1.62 |
7.70 |
|
More Inflation-Adjusted Income Than S&P 500 |
NA |
1.79 |
4.74 |
|
Starting Yield |
2.1% |
3.3% |
6.3% |
|
Yield On Cost |
14.2% |
49.8% |
230.6% |
(Source: Portfolio Visualizer Premium)
TD has delivered 11% annual income growth and 14X an investor’s initial investment over the last 25 years.
-
a 231% yield on cost means that number is rising very quickly now
TD has recouped investors’ initial investments almost 5X over since 1997, adjusted for inflation.
-
the fundamental risk of losing 100% of that investment is now effectively zero
TD Consensus Future Income Growth Potential
|
Analyst Consensus Income Growth Forecast |
Risk-Adjusted Expected Income Growth |
Risk And Tax-Adjusted Expected Income Growth |
Risk, Inflation, And Tax-Adjusted Income Growth Consensus |
|
11.5% |
8.1% |
6.9% |
4.7% |
(Source: DK Research Terminal, FactSet)
Analysts think TD could deliver 11% to 12% annual income growth in the future, which, adjusted for the risk of the company not growing as expected, inflation, and taxes, is 4.7% real expected income growth.
Now compare that to what they expect from the S&P 500.
|
Time Frame |
S&P Inflation-Adjusted Dividend Growth |
S&P Inflation-Adjusted Earnings Growth |
|
1871-2021 |
1.6% |
2.1% |
|
1945-2021 |
2.4% |
3.5% |
|
1981-2021 (Modern Falling Rate Era) |
2.8% |
3.8% |
|
2008-2021 (Modern Low Rate Era) |
3.5% |
6.2% |
|
FactSet Future Consensus |
2.0% |
5.2% |
(Sources: S&P, FactSet, Multipl.com)
-
1.7% post-tax inflation-adjusted income growth from the S&P 500
-
S&P 500’s historical post-tax inflation-adjusted income growth rate (current tax code) is 5.8% CAGR
The S&P 500 is now dominated by buyback-friendly companies that prioritize repurchases over fast dividend growth.
What about a 60/40 retirement portfolio?
-
0.5% consensus inflation, risk, and tax-adjusted income growth.
In other words, TD could generate about 3X faster real income growth than the S&P 500 and 9X faster income growth than a 60/40.
-
with an almost 3X higher and safer yield on day one
What inflation-adjusted returns do analysts expect in the future?
Inflation-Adjusted Consensus Return Potential: $1,000 Initial Investment
|
Time Frame (Years) |
7.9% CAGR Inflation And Risk-Adjusted S&P Consensus |
8.9% Inflation-Adjusted Aristocrat Consensus |
8.9% CAGR Inflation-Adjusted TD Consensus |
Difference Between Inflation-Adjusted TD And S&P Consensus |
|
5 |
$1,461.18 |
$1,530.17 |
$1,530.17 |
$68.99 |
|
10 |
$2,135.06 |
$2,341.43 |
$2,341.43 |
$206.37 |
|
15 |
$3,119.71 |
$3,582.79 |
$3,582.79 |
$463.08 |
|
20 |
$4,558.47 |
$5,482.29 |
$5,482.29 |
$923.83 |
|
25 |
$6,660.75 |
$8,388.86 |
$8,388.86 |
$1,728.10 |
|
30 (Retirement Time Frame) |
$9,732.58 |
$12,836.40 |
$12,836.40 |
$3,103.82 |
|
35 |
$14,221.09 |
$19,641.92 |
$19,641.92 |
$5,420.83 |
|
40 |
$20,779.62 |
$30,055.54 |
$30,055.54 |
$9,275.92 |
|
45 |
$30,362.83 |
$45,990.17 |
$45,990.17 |
$15,627.35 |
|
50 |
$44,365.65 |
$70,372.93 |
$70,372.93 |
$26,007.27 |
|
55 |
$64,826.35 |
$107,682.76 |
$107,682.76 |
$42,856.41 |
|
60 (Investing Lifetime) |
$94,723.18 |
$164,773.26 |
$164,773.26 |
$70,050.08 |
(Source: DK Research Terminal, FactSet) – ignoring starting valuation, which cancels out over 30+ years
Over a long enough time period, blue-chip investing can change your life.
-
You don’t need crypto to achieve 100X returns. You just need steady and dependable dividend growers like TD and sufficient time.
|
Time Frame (Years) |
Ratio Aristocrats/S&P Consensus |
Ratio Inflation-Adjusted TD vs. S&P consensus |
|
5 |
1.05 |
1.05 |
|
10 |
1.10 |
1.10 |
|
15 |
1.15 |
1.15 |
|
20 |
1.20 |
1.20 |
|
25 |
1.26 |
1.26 |
|
30 |
1.32 |
1.32 |
|
35 |
1.38 |
1.38 |
|
40 |
1.45 |
1.45 |
|
45 |
1.51 |
1.51 |
|
50 |
1.59 |
1.59 |
|
55 |
1.66 |
1.66 |
|
60 |
1.74 |
1.74 |
(Source: DK Research Terminal, FactSet)
TD and the aristocrats can deliver life-changing returns over a traditional retirement lifetime and longer time frames.
-
But TD yields 2X the very safe yield on day one
TD Investment Decision Score
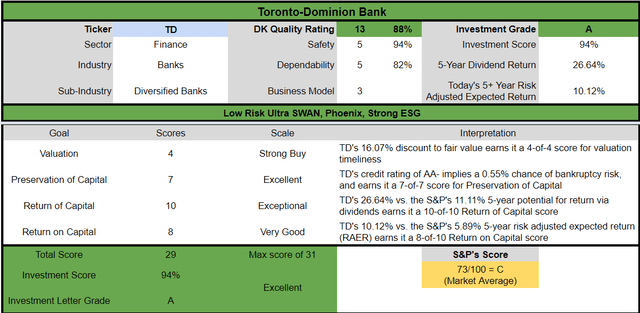
Dividend Kings
TD is a reasonable and prudent high-yield Ultra SWAN for anyone comfortable with its risk profile.
-
16% discount vs. 6% market premium = 24% better valuation
-
4.2% yield vs. 1.6% yield (2.6X higher and safer)
-
10% better consensus long-term return potential
-
2X better risk-adjusted expected return over the next five years
-
2.5X higher 5-year income potential than the S&P 500
Reason Two: One Of The World’s Safest Companies
There are many ways to measure safety and quality, and I factor in pretty much all of them.
The Dividend Kings’ overall quality scores are based on a 269-point model that includes:
-
Dividend safety
-
Balance sheet strength
-
Credit ratings
-
Credit default swap medium-term bankruptcy risk data
-
Short and long-term bankruptcy risk
-
Accounting and corporate fraud risk
-
Profitability and business model
-
Growth consensus estimates
-
Management growth guidance
-
Historical earnings growth rates
-
Historical cash flow growth rates
-
Historical dividend growth rates
-
Historical sales growth rates
-
Cost of capital
-
GF Scores
-
Morningstar business model uncertainty score
-
Long-term risk-management scores from MSCI, Morningstar, FactSet, S&P, Reuters’/Refinitiv, and Just Capital
-
Management quality
-
Dividend-friendly corporate culture/income dependability
-
Long-term total returns (a Ben Graham sign of quality)
-
Analyst consensus long-term return potential
It includes more than 1,000 fundamental metrics, including the 12 rating agencies we use to assess fundamental risk.
-
credit and risk management ratings make up 41% of the DK safety, and quality model
-
dividend/balance sheet/risk ratings make up 82% of the DK safety and quality model
How do we know that our safety and quality model works well?
During the two worst recessions in 75 years, our safety model 87% of blue-chip dividend cuts, the ultimate baptism by fire for any dividend safety model.
How does TD score on our comprehensive safety and quality models.
TD Dividend Safety
|
Rating |
Dividend Kings Safety Score (191 Point Safety Model) |
Approximate Dividend Cut Risk (Average Recession) |
Approximate Dividend Cut Risk In Pandemic Level Recession |
|
1 – unsafe |
0% to 20% |
over 4% |
16+% |
|
2- below average |
21% to 40% |
over 2% |
8% to 16% |
|
3 – average |
41% to 60% |
2% |
4% to 8% |
|
4 – safe |
61% to 80% |
1% |
2% to 4% |
|
5- very safe |
81% to 100% |
0.5% |
1% to 2% |
|
TD |
94% |
0.50% |
1.30% |
|
Risk Rating |
Low-Risk (79th industry percentile risk-management consensus) |
AA- Stable credit rating = 0.55% 30-year bankruptcy risk |
20% OR LESS Max Risk Cap Recommendation |
Long-Term Dependability
|
Company |
DK Long-Term Dependability Score |
Interpretation |
Points |
|
Non-Dependable Companies |
21% or below |
Poor Dependability |
1 |
|
Low Dependability Companies |
22% to 60% |
Below-Average Dependability |
2 |
|
S&P 500/Industry Average |
61% (61% to 70% range) |
Average Dependability |
3 |
|
Above-Average |
71% to 80% |
Very Dependable |
4 |
|
Very Good |
81% or higher |
Exceptional Dependability |
5 |
|
TD |
82% |
Exceptional Dependability |
5 |
Overall Quality
|
TD |
Final Score |
Rating |
|
Safety |
94% |
5/5 Very Safe |
|
Business Model |
60% |
3/3 Wide And Stable Moat |
|
Dependability |
82% |
5/5 exceptional |
|
Total |
88% |
13/13 Ultra SWAN |
|
Risk Rating |
4/5 Low-Risk |
|
|
20% OR LESS Max Risk Cap Rec |
5% Margin of Safety For A Potentially Good Buy |
TD is the 103rd highest quality company on the DK 500 Masterlist.
How significant is this? The DK 500 Master List is one of the world’s best watchlists, including
-
every dividend aristocrat (S&P companies with 25+ year dividend growth streaks)
-
every dividend champion (every company, including foreign, with 25+ year dividend growth streaks)
-
every dividend king (every company with 50+ year dividend growth streaks)
-
every foreign aristocrat (every company with 20+ year dividend growth streaks)
-
every Ultra SWAN (wide moat aristocrats, as close to perfect quality companies as exist)
-
40 of the world’s best growth stocks
In other words, even among the world’s best companies, TD is higher quality than 80% of them, similar in quality to such aristocrats and Ultra SWANs as:
-
Royal Bank of Canada (RY) Ultra SWAN
-
National Bank of Canada (OTCPK:NTIOF): Super SWAN
-
McCormick (MKC): Ultra SWAN dividend aristocrat
-
Illinois Tool Works (ITW): Ultra SWAN dividend king
-
Philip Morris International (PM): Ultra SWAN dividend king
-
Merck (MRK): Ultra SWAN
Why I Trust Toronto-Dominion And So Can You
Toronto-Dominion Bank traces its roots back to 1855 with the founding of the Bank of Toronto.
-
Which began paying dividends in 1857 and hasn’t missed a quarterly payment since
-
The last time it cut its dividend was in WWII at the request of the government
The Great Depression, WWI, WWII, and 5% of humanity being wiped out in the 1918 Great Spanish flu pandemic couldn’t kill TD’s dividend.
-
If TD ever cuts its dividend, it likely means the apocalypse is here, and we’re too dead to care.
In fact, TD has been growing its dividend at 11% CAGR since 1995, one of the most consistent fast-growing dividend of any global bank.
TD is neck and neck with the Royal Bank of Canada for the largest CA bank, and the top six control 90% of the market.
-
a wide moat enshrined by regulations
“Toronto-Dominion has also established a significant presence in the U.S. by having the most branches in the U.S. among Canadian banks, as well as a 13.4% ownership stake in Charles Schwab (after the TD Ameritrade acquisition).
While we like the higher exposure to more growth in the U.S., the segment has lower returns on equity than the Canadian segment, partially because of goodwill but also partially because returns are naturally lower on average.
We also like Toronto-Dominion’s positioning as a major discount brokerage player because we believe this industry is ripe for growth as investors seek lower-cost alternatives. The bank could leverage its industry knowledge for future growth in Canada.
The bank has taken a number of charges (such as integration charges, restructuring charges, and more). Many of these have been related to acquired card portfolios. We expect that as these card relationships mature, the bank should be well positioned in a higher-return business if managed well.
The bank is set to acquire First Horizon, a midsize U.S. regional with a presence in the Southeast, by early 2023. We expect decent growth for TD Ameritrade, stable strength in domestic banking operations, good credit quality management, and continued expense control to drive consistent returns on equity and mid-single-digit earnings growth over the longer term.” – Morningstar
TD has been diversifying into the US and globally because while profitability in Canada is sky-high, growth opportunities are limited.
The company brings its 79th industry percentile risk management to the US and global banking.
-
If anyone can do emerging market banking safely, it’s CA banks
-
62% of sales from Canada
-
33% from the US
-
5% international
TD is focused 95% on North America because the US financial market is over 10X large than Canada’s.
-
effectively an entirely new world to concur, with minimal fundamental risk
TD is the sixth largest bank in North America by assets and the 5th by market cap.
It has 2,216 North America locations and also operates in Europe and Asia.
TD is the largest bank in Canada by deposits, the second biggest by assets, and the fifth biggest in North America by deposits.
Its 93,203 employees make it the largest banking employer in Canada and the 5th biggest in North America.
The bank’s CET1 ratio ended the quarter at 14.7%, reflecting that fortress balance sheet that is why four rating agencies consider TD AA-rated.
TD Credit Ratings
|
Rating Agency |
Credit Rating |
30-Year Default/Bankruptcy Risk |
Chance of Losing 100% Of Your Investment 1 In |
|
S&P |
AA- Stable Outlook |
0.55% |
181.8 |
|
Fitch |
AA- Stable Outlook |
0.55% |
181.8 |
|
Moody’s |
Aa2 Stable (AA equivalent) |
0.55% |
181.8 |
|
DBRS |
AA+ Stable |
0.29% |
344.8 |
|
Consensus |
AA- Stable Outlook |
0.49% |
206.2 |
(Source: S&P, Fitch, Moody’s, DBRS)
According to rating agencies, the risk of losing all your money buying TD today is approximately 0.49% or 1 in 206.
Why?
Because the US regulatory minimum for CET1 ratios (the new gold standard of solvency) for globally systemic important banks or GSIBs like TD is 12%, and 11.5% in Canada.
Total CA banking regulatory requirements are among the strictest on earth, which is why Canada hasn’t had a banking crisis since the 1840s.
TD keeps its capital requirements 19% above regulatory minimums.
TD’s balance sheet is strong that it can withstand a multi-year depression with over 10% unemployment based on the stress tests conducted by CA regulators (and TD internally) during the Pandemic.
-
without having to cut the dividend
TD’s business is:
-
56% Canadian retail banking
-
29% US retail banking (the 8th largest banks in the US)
-
9% wholesale (things like IPO underwriting and M&A advising)
-
6% its 15% stake in Schwab
TD’s expansion in the US began in 2000 and has proceeded with 27 tuck-in acquisitions to date, most recently First Horizon, a Southeast regional bank.
-
A $13.4 billion deal, which is the largest in TD’s history by far
This acquisition, which is expected to close next year, will make TD the 6th largest US bank, operating in 22 states and with $614 billion in US assets.
TD is investing aggressively in digital banking and fintech, which is why it now has 15.6 million digital users.
-
Digital banking has nearly 100% margins because it’s almost infinitely scalable
Economies of scale in physical banking and big investments into digital banking are why analysts expect TD’s efficiency ratio (non-interest expenses/revenue) to fall from a low 55.2% to 52.8%.
-
The average US bank efficiency ratio is 63.2%
TD’s banking is so conservative that its loan loss ratio is 0.22% and has been trending lower for 11 years, including through the Pandemic.
Basically, Canadian Banks have always done banking right, and TD is the safest CA bank of all, according to rating agencies.
Quantitative Analysis: The Math Backing Up CAT’s Investment Thesis
Ben Graham recommended combining qualitative (the story) analysis with quantitative analysis looking at the past, present, and likely future.
Profitability: Wall Street’s Favorite Quality Proxy
TD’s profitability is historically in the top 60% of peers. However, its net margins and returns on equity are sky high.
-
net margins in the top 28% of global banks
-
returns on equity in the top 20%
TD’s high profitability is enshrined in Canadian regulations, and none of the big six are allowed to buy each other or be acquired by foreign banks.
-
a wide moat ensured by regulators
TD Profit Margin Consensus Forecast
|
Year |
EBIT (Operating) Margin |
Net Margin |
|
2021 |
40.1% |
32.9% |
|
2022 |
43.3% |
33.6% |
|
2023 |
43.1% |
31.9% |
|
2024 |
NA |
32.1% |
|
Annualized Growth |
3.75% |
-0.85% |
(Source: FactSet Research Terminal)
Average net margins in banking are 27%, and TD’s are 32% to 33% and stable, with operating margins of 43%.
TD’s profitability has been relatively stable for 30 years, confirming the wide and stable moat.
Reason Three: Strong Growth Prospects For Decades To Come
Toronto-Dominion is the fastest growing of Canada’s five national super banks.
TD Medium-Term Growth Consensus
|
Year |
Sales |
EBIT (Operating Income) |
Net Income |
|
2021 |
$33,289 |
$13,344 |
$10,954 |
|
2022 |
$33,191 |
$14,359 |
$11,143 |
|
2023 |
$37,778 |
$16,299 |
$12,041 |
|
2024 |
$41,145 |
NA |
$13,196 |
|
Annualized Growth |
7.32% |
10.52% |
6.40% |
|
Cumulative Next 2022-2023 |
$70,969 |
$30,658 |
$23,184 |
(Source: FactSet Research Terminal)
Management says it can grow EPS at 7% to 10% over time, and that’s close to what analysts expect in the coming years.
-
even with a potential mild recession looming in 2023
TD Dividend Growth Consensus Forecast
|
Year |
Dividend Consensus |
EPS/Share Consensus |
EPS Payout Ratio |
Retained (Post-Dividend) Earnings |
Buyback Potential |
|
2022 |
$2.67 |
$6.27 |
42.6% |
$6,494 |
5.41% |
|
2023 |
$2.88 |
$6.77 |
42.5% |
$7,018 |
5.85% |
|
2024 |
$3.08 |
$7.46 |
41.3% |
$7,902 |
6.58% |
|
Total 2022 Through 2024 |
$8.63 |
$20.50 |
42.1% |
$21,413.48 |
17.84% |
|
Annualized Rate |
7.4% |
9.1% |
-1.5% |
10.3% |
10.3% |
(Source: FactSet Research Terminal)
Rating agencies consider 50% a safe payout ratio, and TD’s policy is 40% to 50% outside of recessions.
The payout ratio is currently 43% and is expected to drift lower despite 7.4% annual dividend growth through 2024.
TD is expected to retain $21.4 billion in post-dividend earnings over the next three years to potentially buy back as much as 18% of its stock at current valuations.
TD is expected to buy back $749 million in shares this year, but CA banks generally tend to have slowly growing share counts due to issuing shares to make acquisitions.
TD Long-Term Growth Outlook
-
6.7% to 6.9% CAGR growth consensus range from five sources
-
6.9% median consensus from all 15 analysts
-
7% to 10% CAGR is management guidance
How accurate are analysts at forecasting TD’s growth rates?
-
smoothing for outliers, historical analyst margins of error are 20% to the upside and 20% to the downside
-
5% to 10% CAGR margin-of-error adjusted growth consensus range (including management guidance range)
-
70% statistical probability that TD grows at 5% to 10% over time
TD’s historical growth rates are consistent with management’s 7% to 10% growth guidance and the 7% that analysts expect over time.
Reason Four: A Wonderful Company At A Wonderful Price
Since the financial crisis, tens of millions of income investors have paid a very consistent 11.9X to 12.1X earnings for TD.
-
90% statistical probability that this represents the intrinsic value range for TD
|
Metric |
Historical Fair Value Multiples (17-Years) |
2021 |
2022 |
2023 |
2024 |
12-Month Forward Fair Value |
|
13-Year Median Yield |
3.57% |
$70.03 |
$76.52 |
$76.52 |
$87.68 |
|
|
P/E |
12.01 |
$74.22 |
$76.26 |
$82.63 |
$92.60 |
|
|
Average |
$72.06 |
$76.39 |
$79.45 |
$90.07 |
$78.33 |
|
|
Current Price |
$65.75 |
|||||
|
Discount To Fair Value |
8.76% |
13.93% |
17.25% |
27.00% |
16.07% |
|
|
Upside To Fair Value (NOT Including Dividends) |
9.60% |
16.18% |
20.84% |
36.99% |
19.14% (23% including dividend) |
|
|
2022 EPS |
2023 EPS |
2022 Weighted OCF |
2023 Weighted OCF |
12-Month Forward P/E |
12-Month Average Fair Value Forward P/E |
Current Forward P/E |
|
$6.35 |
$6.88 |
$2.32 |
$4.37 |
$6.69 |
11.72 |
9.83 |
I conservatively estimate TD is historically worth 11.7X earnings, and today, it trades at 9.8X.
|
Analyst Median 12-Month Price Target |
Morningstar Fair Value Estimate |
|
$75.36 (11.3 PE) |
$77.00 (11.5 P/E) |
|
Discount To Price Target (Not A Fair Value Estimate) |
Discount To Fair Value |
|
12.75% |
14.61% |
|
Upside To Price Target (Not Including Dividend) |
Upside To Fair Value (Not Including Dividend) |
|
14.62% |
17.11% |
|
12-Month Median Total Return Price (Including Dividend) |
Fair Value + 12-Month Dividend |
|
$78.09 |
$79.73 |
|
Discount To Total Price Target (Not A Fair Value Estimate) |
Discount To Fair Value + 12-Month Dividend |
|
15.80% |
17.54% |
|
Upside To Price Target (Including Dividend) |
Upside To Fair Value + Dividend |
|
18.77% |
21.26% |
Morningstar’s fair value estimate is similar with a P/E of 11.5, and analysts think TD will trade at 11.3X within a year, delivering a 19% total return in 12 months.
I don’t recommend companies based on 12-month forecasts but on the margin of safety and whether or not it sufficiently compensates you for a company’s risk profile.
Margin Of Safety Not 12-Month Price Targets Are How I Make Investment Decisions
|
Rating |
Margin Of Safety For Low-Risk 13/13 Quality Ultra SWANs |
2022 Fair Value Price |
2023 Fair Value Price |
12-Month Forward Fair Value |
|
Potentially Reasonable Buy |
0% |
$76.39 |
$79.45 |
$78.33 |
|
Potentially Good Buy |
5% |
$72.57 |
$75.48 |
$74.42 |
|
Potentially Strong Buy |
15% |
$64.93 |
$67.54 |
$66.58 |
|
Potentially Very Strong Buy |
25% |
$54.43 |
$59.59 |
$58.75 |
|
Potentially Ultra-Value Buy |
35% |
$49.65 |
$51.65 |
$50.92 |
|
Currently |
$65.75 |
13.93% |
17.25% |
16.07% |
|
Upside To Fair Value (Not Including Dividends) |
16.18% |
20.84% |
19.14% |
TD is a potentially strong buy for anyone comfortable with its risk profile.
Risk Profile: Why Toronto-Dominion Isn’t Right For Everyone
There are no risk-free companies, and no company is right for everyone. You have to be comfortable with the fundamental risk profile.
What Could Cause TD’s Investment Thesis To Break
-
safety falls to 40% or less
-
balance sheet collapses (approximately 0.5% or less probability according to rating agencies)
-
a major botched acquisition
-
or a prolonged severe collapse of CA’s housing market
-
growth outlook falls to less than 5.8% for seven years
-
TD’s role in my portfolio is to deliver long-term 10+% returns with minimal fundamental risk
-
8+% total return requirement for defensive sectors (including healthcare)
-
10+% for non-defensive (cyclical) sectors
How long it takes for a company’s investment thesis to break depends on the quality of the company.
|
Quality |
Years For The Thesis To Break Entirely |
|
Below-Average |
1 |
|
Average |
2 |
|
Above-Average |
3 |
|
Blue-Chip |
4 |
|
SWAN |
5 |
|
Super SWAN |
6 |
|
Ultra SWAN |
7 |
|
100% Quality Companies (MSFT, LOW, and MA) |
8 |
These are my rule of thumb for when to sell a stock if the investment thesis has broken. TD is highly unlikely to suffer such catastrophic declines in fundamentals.
TD’s Risk Profile Summary
“The Canadian banks face two primary risks: macroeconomic risks and risks related to future acquisitions. We see macroeconomic risks related to the credit and debt cycle, which are largely out of management’s control and are related to the eventual turning of the housing market.
Canada has some of the highest median housing prices to annual median household income ratios in several of its major housing markets, and mortgage debt levels have consistently increased for more than a decade. While low interest rates have kept debt-servicing ratios more controlled, it does put the economy in a riskier position.
The leverage of the Canadian consumer is also a risk. Once the economic cycle turns, this could result in greater potential for consumer defaults as well as a longer period of decreased economic demand as consumers repair their own finances.
Toronto-Dominion does have a relatively lower exposure to the uninsured domestic real estate market in Canada, putting it in a less risky position in a downturn.
From an ESG perspective, commercial banks are expected to have strong product governance. Predatory or discriminatory lending practices are examples of poor product governance, and this can affect certain banks at times.
We view most product governance and social risks as manageable and incorporate a steady level of operational expenses related to compliance and litigation in our models. Outside of the rare, headline-grabbing scandals, we don’t see social risks as having a material effect on our valuation.
Banks also lend to sectors that can come under more scrutiny at times, like gun manufacturers or energy, for example. Commercial banks don’t directly have a large environmental footprint, and governance practices are in line with those of most companies.
We assign the Canadian banks we cover a medium uncertainty rating, which we think captures the spread between our bull and bear cases relative to our base case.” – Morningstar
TD’s Risk Profile Includes
-
economic cyclicality risk (33% EPS decline in the Great Recession and 18% in the Pandemic)
-
regulatory risk: CA regulators have been raising capital requirements for the last decade, putting CA bank high profitability at risk
-
M&A risk: mostly tuck in acquisitions though First Horizon shows TD might be starting to get more aggressive with acquisitions
-
labor retention risk (tightest job market in over 50 years)
-
currency risk: including for the dividend
30% of TD’s loan book is CA residential mortgages, which are extremely conservatively written, but still represent a potential risk should the CA housing market suffer a significant downturn.
Fortunately, TD has a relatively lower exposure to mortgages than it peers, making it a more conservative choice in the worst-case scenario.
How do we quantify, monitor, and track such a complex risk profile? By doing what big institutions do.
Long-Term Risk Analysis: How Large Institutions Measure Total Risk
-
see the risk section of this video to get an in-depth view (and link to two reports) of how DK and big institutions measure long-term risk management by companies
TD Long-Term Risk-Management Consensus
|
Rating Agency |
Industry Percentile |
Rating Agency Classification |
|
MSCI 37 Metric Model |
96.0% |
AA, Industry Leader, Stable Trend |
|
Morningstar/Sustainalytics 20 Metric Model |
76.0% |
20.9/100 Medium-Risk |
|
Reuters’/Refinitiv 500+ Metric Model |
95.0% |
Above-Average, Stable Trend |
|
S&P 1,000+ Metric Model |
84.0% |
Very Good, Stable Trend |
|
FactSet |
50.0% |
Average, Stable Trend |
|
Morningstar Global Percentile (All 15,000 Rated Companies) |
72.3% |
Good |
|
Consensus |
79% |
Low Risk, Good, Bordering On Very Good Risk-Management, Stable Trend |
(Sources: Morningstar, FactSet, S&P, Reuters, MSCI)
TD’s Long-Term Risk Management Is The 86th Best In The Master List (83rd Percentile)
|
Classification |
Average Consensus LT Risk-Management Industry Percentile |
Risk-Management Rating |
|
S&P Global (SPGI) #1 Risk Management In The Master List |
94 |
Exceptional |
|
Toronto-Dominion Bank |
79 |
Good – Bordering On Very Good |
|
Strong ESG Stocks |
78 |
Good – Bordering On Very Good |
|
Foreign Dividend Stocks |
75 |
Good |
|
Ultra SWANs |
71 |
Good |
|
Low Volatility Stocks |
68 |
Above-Average |
|
Dividend Aristocrats |
67 |
Above-Average |
|
Dividend Kings |
63 |
Above-Average |
|
Master List average |
62 |
Above-Average |
|
Hyper-Growth stocks |
61 |
Above-Average |
|
Monthly Dividend Stocks |
60 |
Above-Average |
|
Dividend Champions |
57 |
Average bordering on above-average |
(Source: DK Research Terminal)
TD’s risk-management consensus is in the top 17% of the world’s highest quality companies and similar to that of such other blue-chips as
-
Bank of Montreal (BMO): Ultra SWAN
-
National Bank of Canada: Super SWAN
-
Canadian Imperial Bank of Commerce (CM): Ultra SWAN
-
Bank of Nova Scotia (BNS): Ultra SWAN
-
Royal Bank of Canada: Ultra SWAN
-
Merck: Ultra SWAN
-
Mastercard (MA): Ultra SWAN
-
Cummins (CMI): Ultra SWAN
-
Lowe’s (LOW): Ultra SWAN dividend king
The bottom line is that all companies have risks, and TD is good, bordering on very good, at managing theirs.
How We Monitor TD’s Risk Profile
-
15 analysts
-
4 credit rating agencies
-
8 total risk rating agencies
-
23 experts who collectively know this business better than anyone other than management.
“When the facts change, I change my mind. What do you do, sir?” – John Maynard Keynes
There are no sacred cows at iREIT or Dividend Kings. Wherever the fundamentals lead, we always follow. That’s the essence of disciplined financial science, the math behind retiring rich and staying rich in retirement.
Bottom Line: Toronto-Dominion Is The Safest Bank You Can Own Right Now
Let me be clear. Ultra SWAN status doesn’t mean a stock can’t fall much in a bear market.
-
Safety and quality have zero to do with short-term price volatility
Fundamentals are all that determine safety and quality and my recommendations.
-
over 30+ years, 97% of stock returns are a function of pure fundamentals, not luck
-
in the short-term; luck is 33X as powerful as fundamentals
-
in the long-term, fundamentals are 33X as powerful as luck
While I can’t predict the market in the short-term here’s what I can tell you about TD.
-
TD is one of the world’s safest, most dependable, and highest-quality companies on earth
-
top 20% of the world’s best blue-chips
-
the 19th safest bank on earth, 99th percentile
-
the safest CA bank according to rating agencies
-
4.2% very safe yield with 7% expected dividend growth through 2024
-
11.1% CAGR long-term total return potential, matching the aristocrats and better than the S&P 500
-
16% historically undervalued, a potentially strong buy
-
9.8X earnings Vs. historical 12.0X
-
93% consensus return potential over the next five years, 14% CAGR, 2X more than the S&P 500
-
2X better risk-adjusted expected returns of the S&P 500 over the next five years.
-
2.6X higher income than the S&P 500 over the next five years
If you want to make your own luck on Wall Street, turn off CNBC.
If you want to safeguard your savings in a bear market, don’t binge-watch Bloomberg.
If you want to know what the stock market is going to do in the next month? Flip a coin.
If you want to retire in safety and splendor? Then you only need to remember six things.
-
the right asset allocation for your goals and risk profile
-
a diversified blue-chip portfolio
-
sufficient SAFE yield for your needs
-
decent growth prospects that meet your goals
-
a reasonable to attractive valuation and margin of safety for your assets
-
the patience to trust your world-class assets to work hard for you
Toronto-Dominion is a world-beater bank that hasn’t missed a dividend payment in 164 years.
When 5% of the world was wiped out by the Spanish flu? It kept on paying dividends.
When the world was twice thrown into existential fights for the future of democracy in WWI and WWII?
It kept on paying dividends.
When inflation hit 22% in 1920?
It kept on paying dividends.
When interest rates hit 20%?
The dividends kept right on coming.
Unless you think the world is about to end, there is one thing I can say with 80% certainty about the safest bank in Canada.
It will be a cold day in hell, and the sun will likely burn out, before TD stops being a sleep-well-at-night high-yield dividend dream stock.
Be the first to comment