

Olemedia
Usually at important stock market bottoms over the last 40 years, interest rates reverse a rising trend and begin to decline rapidly. New money printing, extreme investor bearishness, and higher than average cash levels create a supportive backdrop for equity pricing. Well, we have 2 out of these 3 variables arguing for a constructive 2023. The remaining negative setup is, however, a problem difficult to overcome. Namely, rising interest rates continue to argue investors lighten up or stay only mildly weighted in the U.S. stock market vs. typical settings.
It’s not a forecast position I want to take. I would much prefer to be bullish and estimating returns of 20%+ for 2023. For some history, I have been rating U.S. equity index ETFs with Neutral or Hold settings since May, while expecting rapid swings in price both higher and lower over the next year. Under “normal” economic circumstances, the extreme bearishness and pessimism from investor surveys in late September and early October would almost always turn out to be a great time to purchase stocks. However, coming off record central bank money printing and government borrowing around the world to fight COVID-19 shutdowns, we are not in a normal situation today whatsoever.
CNN Business – Fear & Greed Index, 1 Year AAII Survey, October 2022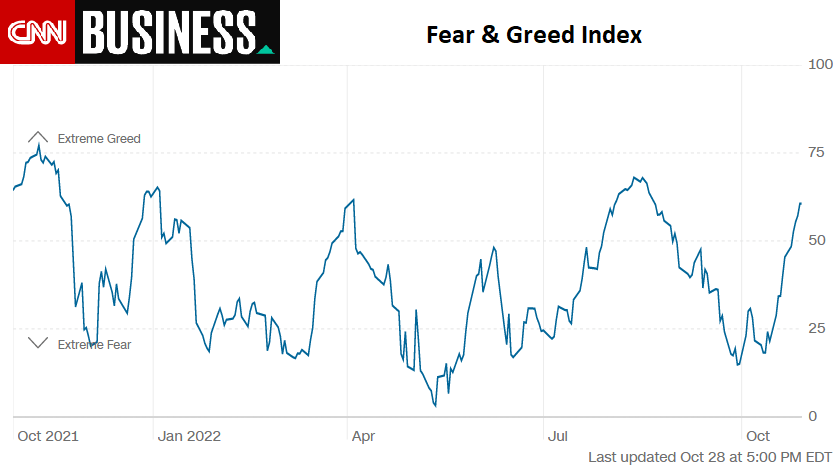
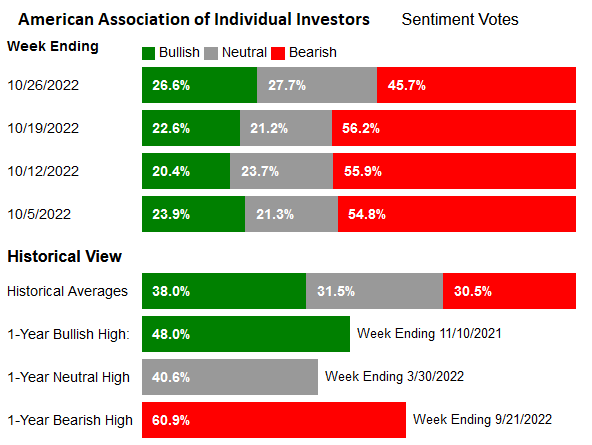
A sobering point to ponder is even record levels of cash on the sidelines (measured from a variety of sources) since June have not been able to jolt the market into a serious uptrend. The reason is climbing interest rates are tightening their grip on economic growth, while acceptable rates for investment returns are pushed ever higher to keep up with 8% CPI inflation.
Rising Interest Rates Hurt Stocks
I know some will argue that rising interest rates are more of a coincidental indicator with economic strength, and generally that’s a fair assumption. Yet, the unique and opposite adjustment to record liquidity in the early days of the pandemic is massive tightening in lending conditions (rising interest rates) in 2022 is the natural counterbalance to get back to a normal economy.
Traditionally, trends in bond and stock prices mimic each other the vast majority of the time. Below is a graph of the almost identical total returns achieved by the iShares 20+ Year Treasury ETF (NASDAQ:TLT) and SPDR S&P 500 ETF (NYSEARCA:SPY) between 2003 and early 2020. In the end, macroeconomic pricing of debt and equity is highly correlated, with the stock market outperforming over time through economic growth and inflation.
YCharts – TLT vs. SPY Total Returns with Author Reference Point, Since March 2003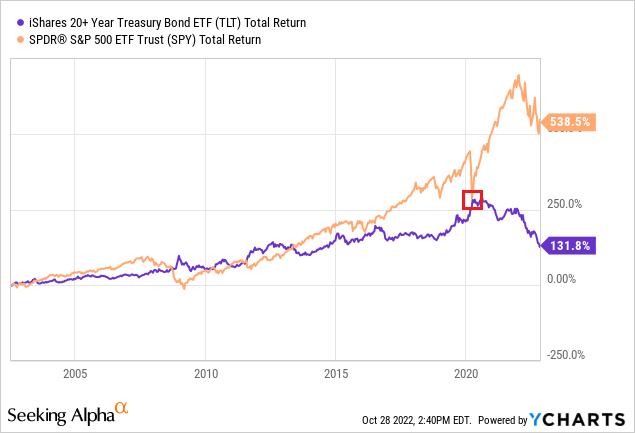
The Fed announcement of “Unlimited QE” or unlimited money printing at the end of March 2020 was a knee-jerk reaction to shutting down the economy (halting the spread of COVID-19), and pinpointed a huge change in asset allocation and investor thinking. Since that date, investor fears of future inflation and the appearance of modern-high inflation rates during 2022 have discouraged bond investment buying. I have boxed in red above this shift in sentiment and performance for bonds. Since late-March 2020, bonds have underperformed stocks by one of the widest margins in the nation’s nearly 250-year political history, pictured below.
YCharts – TLT vs. SPY Total Returns, Since March 2020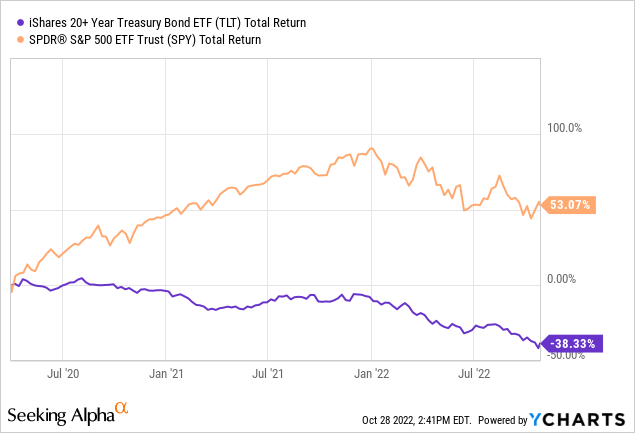
Trading stocks for 36 years, I have experienced a variety of economic backdrops, including the effects of recessions and wars, booms and busts to different degrees. One thing that has remained constant is the stock market and economy generally take 6-12 months to fully react to (digest) outsized bond market fluctuations.
Inverted Yield Curve
Believe it or not, the classic Fed definition of an inverted Treasury yield curve was just reached this past week, where 3-month rates are higher than 10-year yields. I have plotted this inversion below (positive short-term T-Bill yield relative to 10-year debt), alongside other setups since 1982, with recession periods shaded in grey.
YCharts – 3-Month T-Bill Yields vs. 10-Year Bond Yields, Recessions in Grey Shading, Since 1982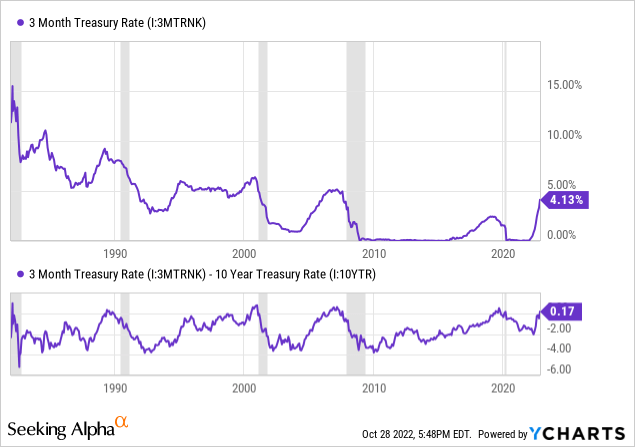
The inverted yield curve of October 2022 is just one more piece of evidence that rising interest rates could torpedo stock prices again. Over the last 40 years, every recession has coincided with a sizable S&P 500 decline. The bad news is yesterday’s GDP report of +2.6% annualized inflation-adjusted growth means an “official” recession has yet to arrive, but may be approaching fast.
YCharts – 3-Month T-Bill Yields vs. S&P 500, Recessions in Grey Shading, Since 1982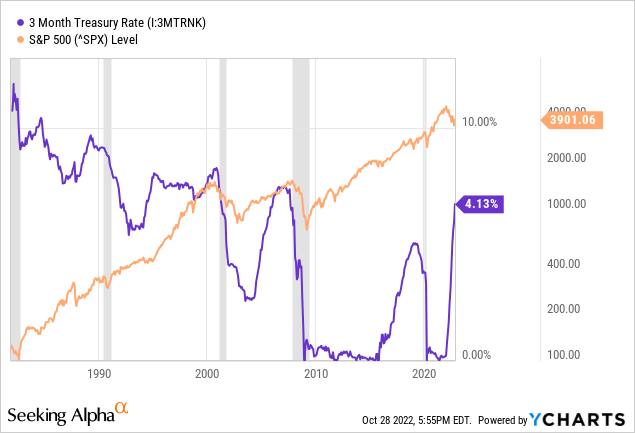
Weak Bonds as an Equity Bear Predictor?
My biggest fear for investors going into November is the once-in-a-lifetime drop in long bond values since March 2020 has not been entirely discounted in stock worth. That’s right, I am saying the 25%-35% tank in U.S. market averages during 2022 may amount to only the early stage of the downer, when it has enough time to completely play out. Evidence of this forecast is major bond changes lead the economy and equity market by at least 6-12 months. So, the new bond lows in October may not be fully impacted and priced into stocks until late 2023 (hopefully sooner)!
Below is a graph comparing 1-year trailing price returns on TLT bonds vs. SPY stocks. I have pointed with arrows to peaks in rolling percentage equity gains when bonds are at lows for returns since 2003. A combination of the inverted yield curve and the largest bond losses in modern history over the last year are hard to wrap my mind around. Considering the record overvaluation of U.S. stocks as we entered 2022, a total economic bust during 2023 is something we should all worry about and prepare for. Don’t take my word for it. Respected business giants from the largest U.S. bank, JPMorgan Chase (JPM) CEO Jamie Dimon to America’s biggest retailer, Amazon (AMZN) founder Jeff Bezos have been warning for months a severe recession could be starting.
YCharts – SPY & TLT, Trailing 1-Year Returns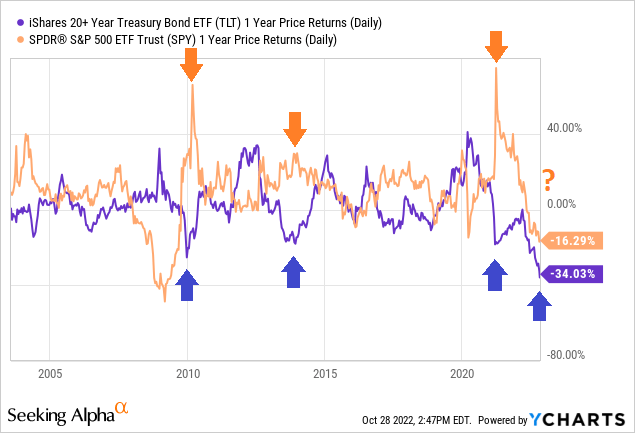
Technical Chart Patterns
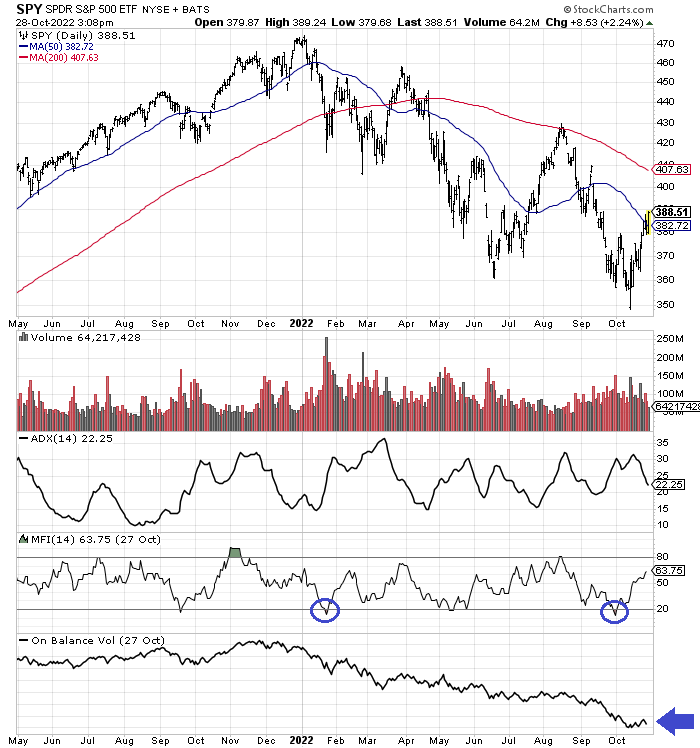
To be honest, both TLT and SPY have ugly charts with little buying I can discern. On the 18-month charts below you can review the anemic On Balance Volume advances outlined over the last week in each ETF product (marked with blue arrows). Continued underperformance by long U.S. Treasury bonds vs. equity market pricing has yet to reverse (circled in red). And, our October rebound in the S&P 500 may prove only a fleeting bounce from oversold trading and sentiment similar to several 2022 backfilling, false starts that a bottom has been reached (14-day Money Flow Index lows are circled in blue).
StockCharts.com – TLT with Author Reference Points, 18 Months of Daily Changes StockCharts.com – SPY with Author Reference Points, 18 Months of Daily Changes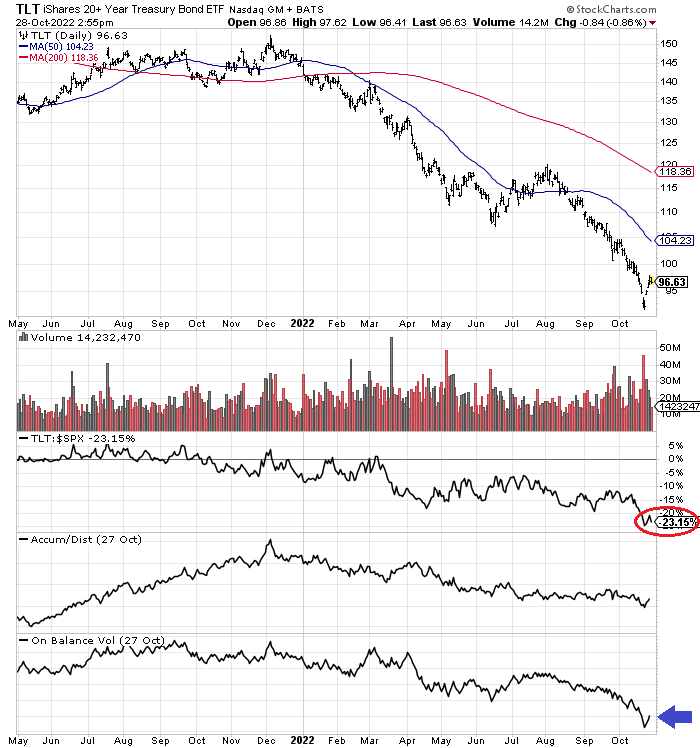
Final Thoughts
I have written 4 bearish articles on TLT since the end of 2020, explaining a wicked drop in bond prices was all but assured after the effects of record money printing worked through the economy. I count this view as one my accurate bullseye calls for the year.
Seeking Alpha – Paul Franke, January 17th, 2022 Article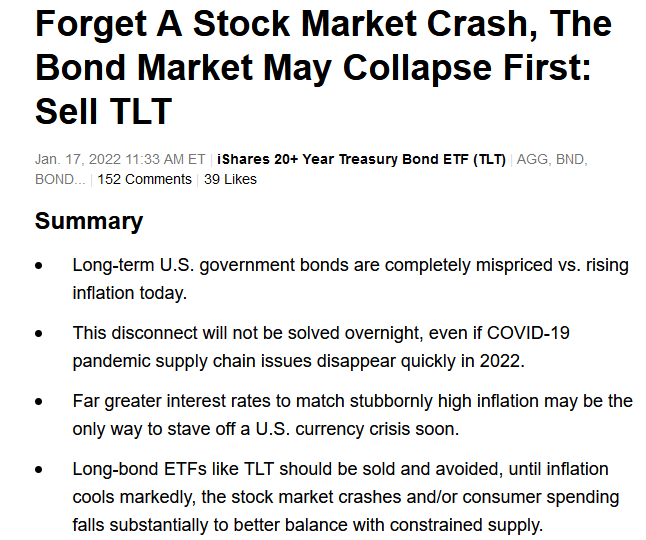
The monster decline in long bonds could easily lead to (cause) a recession into next year. While I was slightly more bullish on stocks a month ago on extreme sentiment readings, the inverted yield curve of late October and lack of volume buying interest in equities has switched my short-term market views and portfolio positioning into a clearly defensive posture.
I continue to forecast precious metals will turn higher first, before the final stock market lows are outlined (as precursor to a Fed pivot in rates to combat a recession). I explained this gold/silver turn idea in a July article here. The lack of substantial gains in gold, silver, platinum/palladium during October is further evidence another round of equity selling could be near.
My main portfolio is now positioned as 10% stocks, 20% precious metals (mostly gold/silver vehicles), and 70% cash. I have sold a portfolio net 10% in stock exposure over recent days (bought in late September). I believe the “safety” of cash with 3% to 4% in annual yield now available makes better sense than taking on greater price risk in long bonds, especially for an investor trying to get back into stocks.
One outlier risk that could send the market plummeting again in November would be a contested midterm election. Confusion, uncertainty and even violence could be America’s immediate future. Mix in other worries like (1) the potential for negative geopolitical outcomes in the Ukraine/Russia conflict or escalating China/Taiwan tensions, (2) a colder than usual winter in the Northern Hemisphere may cause global oil/gas shortages with higher inflation soon, and/or (3) the strong likelihood a weaker economy in the 4th quarter will increase unemployment and tank business income, and it’s very logical to be more chicken than bull. I would note, I am not explicitly betting on a market collapse or lower stock quotes with my money currently. Expensive put option hedge choices, rising margin expense for large scale shorting, plus extremes in investor sentiment and cash holdings argue against a net short position today.
Lastly, the argument that bonds perform better than stocks during and shortly after recessions has been a rallying cry for debt owners all year. I will say this idea has more credence today on the Treasury yield curve inversion, with decent odds total returns (price change plus dividends) in bonds will “beat” stocks during 2023. Shifting some of your capital into intermediate and long-term bonds holds basic logic, although I remain unconvinced owning bonds for 10 or 20 years, paying 4% annually, will be able to beat future elevated inflation and tax rates. (Again I prefer cash, with an eye toward increasing equity exposure on price weakness.)
Consequently, I am upgrading my official Seeking Alpha TLT bond rating to Hold from Sell. For SPY stocks, I am keeping the same Hold rating for now. It is entirely possible wild Wall Street swings lower over the next 3-6 months will reverse later next year to get us back to a 12-month unchanged area. At least, that’s my preferred zigzag prediction for U.S. stock market indexes. For sure, any coming price drop caused by a recessionary economy could be quite scary, especially if you have not experienced a bust like the 2008-09 Great Recession. Happy Halloween 2022!
Thanks for reading. Please consider this article a first step in your due diligence process. Consulting with a registered and experienced investment advisor is recommended before making any trade.
Be the first to comment