

RainStar
Investing in turnaround prospects can be incredibly risky. But at the same time, it can also be very rewarding. A great example of a turnaround that has so far proven to be a good play is Kennametal (NYSE:KMT). As a company focused on metal-cutting tooling and other products, as well as on the production of various infrastructure products, you may not think that this is an appealing place to play. But with strong performance on both its top and bottom lines, shares have performed well recently. Of course, a big question is whether this performance will continue or not. In the coming days, management is expected to report financial results covering the first quarter of the company’s 2023 fiscal year. Although revenue growth is expected to continue, profitability is slated to worsen some. Even if this does come to pass, shares might still offer further upside moving forward. But obviously, investors should be cautious given the broader economic environment.
Nice results and mixed expectations
The last time I wrote an article about Kennametal was in early July of this year. In that article, I talked about how the company suffered significantly because of the COVID-19 pandemic. However, I also discussed the strong recovery that management achieved and I found myself impressed by how cheap shares were. I even went so far as to call the company an attractive turnaround play. At the end of the day, these findings led me to rate the company a ‘buy’, reflecting my belief that shares should significantly outperform the broader market for the foreseeable future. Since then, things have gone quite well. While the S&P 500 is up by just 2.9%, shares of Kennametal have generated a return for investors of 17.7%.
Author – SEC EDGAR Data
When I last wrote about the company, we only had data covering through the third quarter of its 2022 fiscal year. Today, we now have data covering the final quarter as well. During that quarter, sales came in at $530 million. That represents an improvement of 2.7% over the $35.1 million generated the same time one year earlier. Had it not been for foreign currency fluctuations, upside would have been even greater. I say this because organic growth for the company came in strong at 7%. When it comes to specific segments, the greatest weakness came under the metal-cutting operations of the company, with revenue climbing only 1%. Infrastructure-related sales, meanwhile, came in strong at 5%, rising from around $204 million to $214 million, with organic revenue growth there of 7%.
This increase in revenue brought with it improved profits. Net income, for starters, rose from $35.1 million in the fourth quarter of 2021 to $41.7 million the same time this year. Other profitability metrics followed suit, with EBITDA inching up from $100.4 million to $102.1 million. Operating cash flow, unfortunately, did take a beating, dropping from $96.5 million in the final quarter of 2021 to $88.4 million the same time this year. But if we were to adjust for changes in working capital, we would have seen the metric climb from $72.5 million to $89.2 million.
Author – SEC EDGAR Data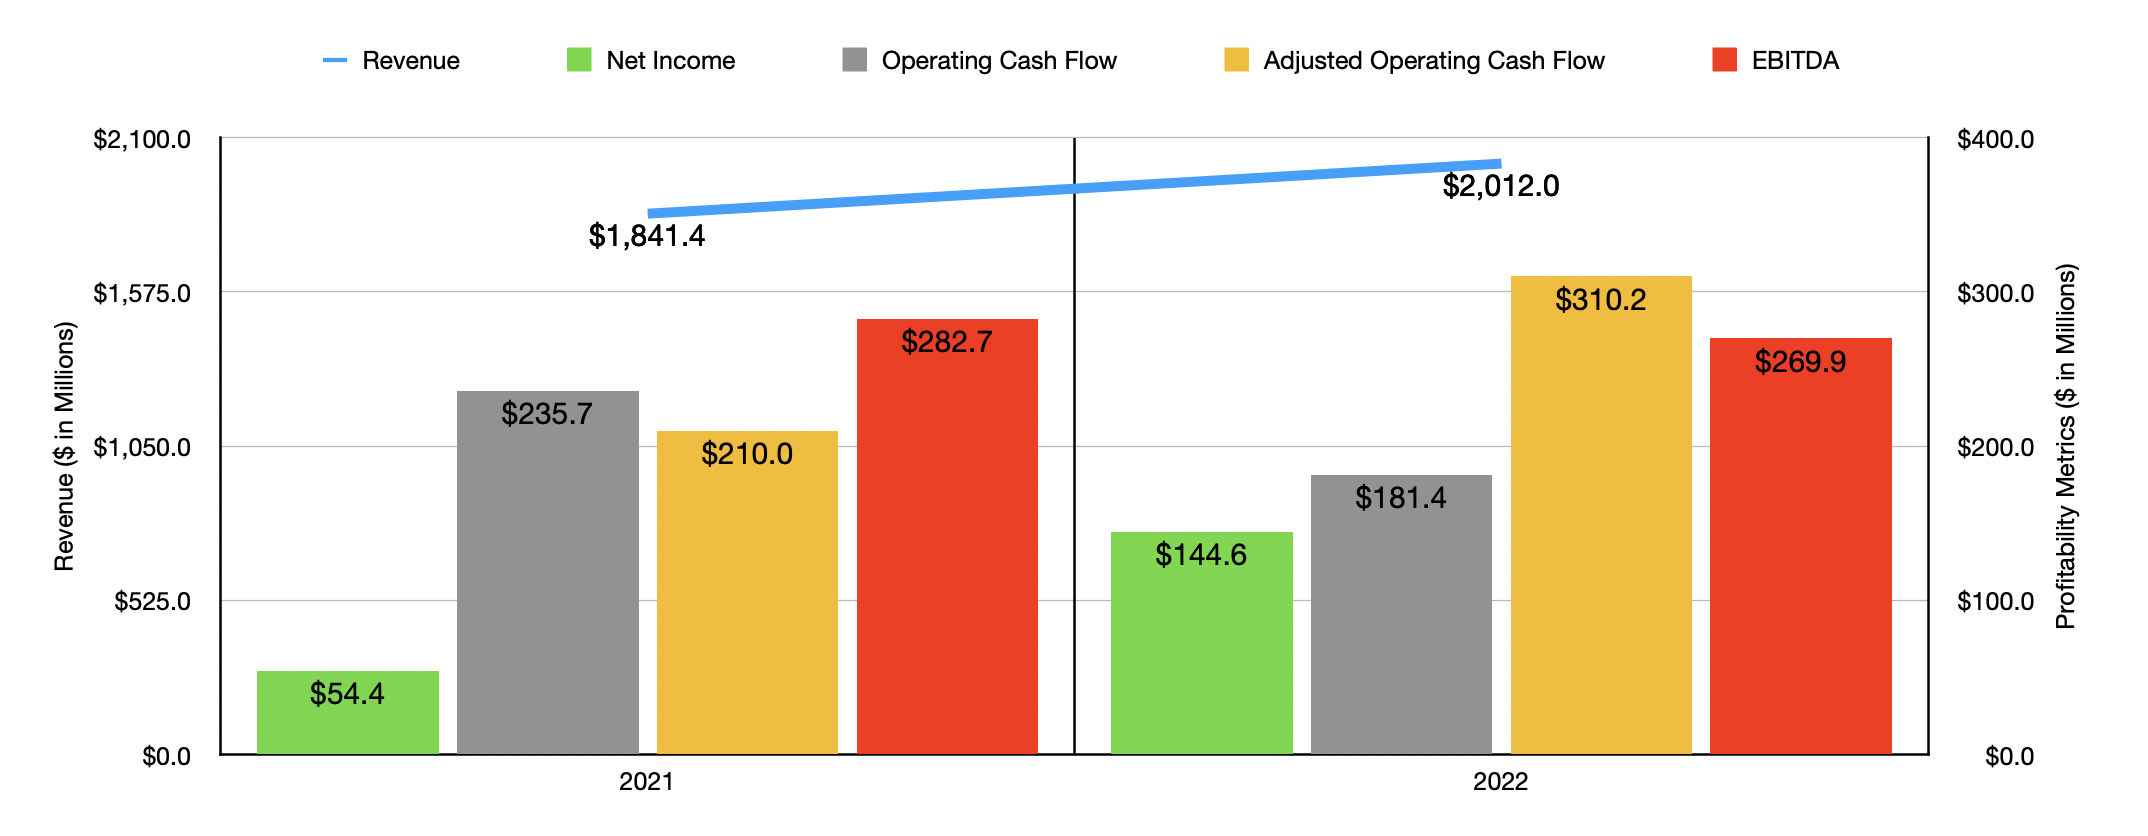
As a result of this performance on both the top and bottom lines, the company ended 2022 fairly strong. Revenue of $2.01 billion came in above the $1.84 billion generated only one year earlier. But of course, sales have not recovered fully when you consider that revenue back in 2019 totaled $2.38 billion. Bottom line results for the company also improved. Net income, as an example, rose from $54.4 million in 2021 to $144.6 million last year. Operating cash flow dropped from $235.7 million down to $181.4 million. But if we were to adjust for changes in working capital, it would have risen from $210 million to $310.2 million. And over that same window of time, we also saw an improvement when it came to EBITDA. That metric ultimately rose from $282.7 million to $369.9 million.
Author – SEC EDGAR Data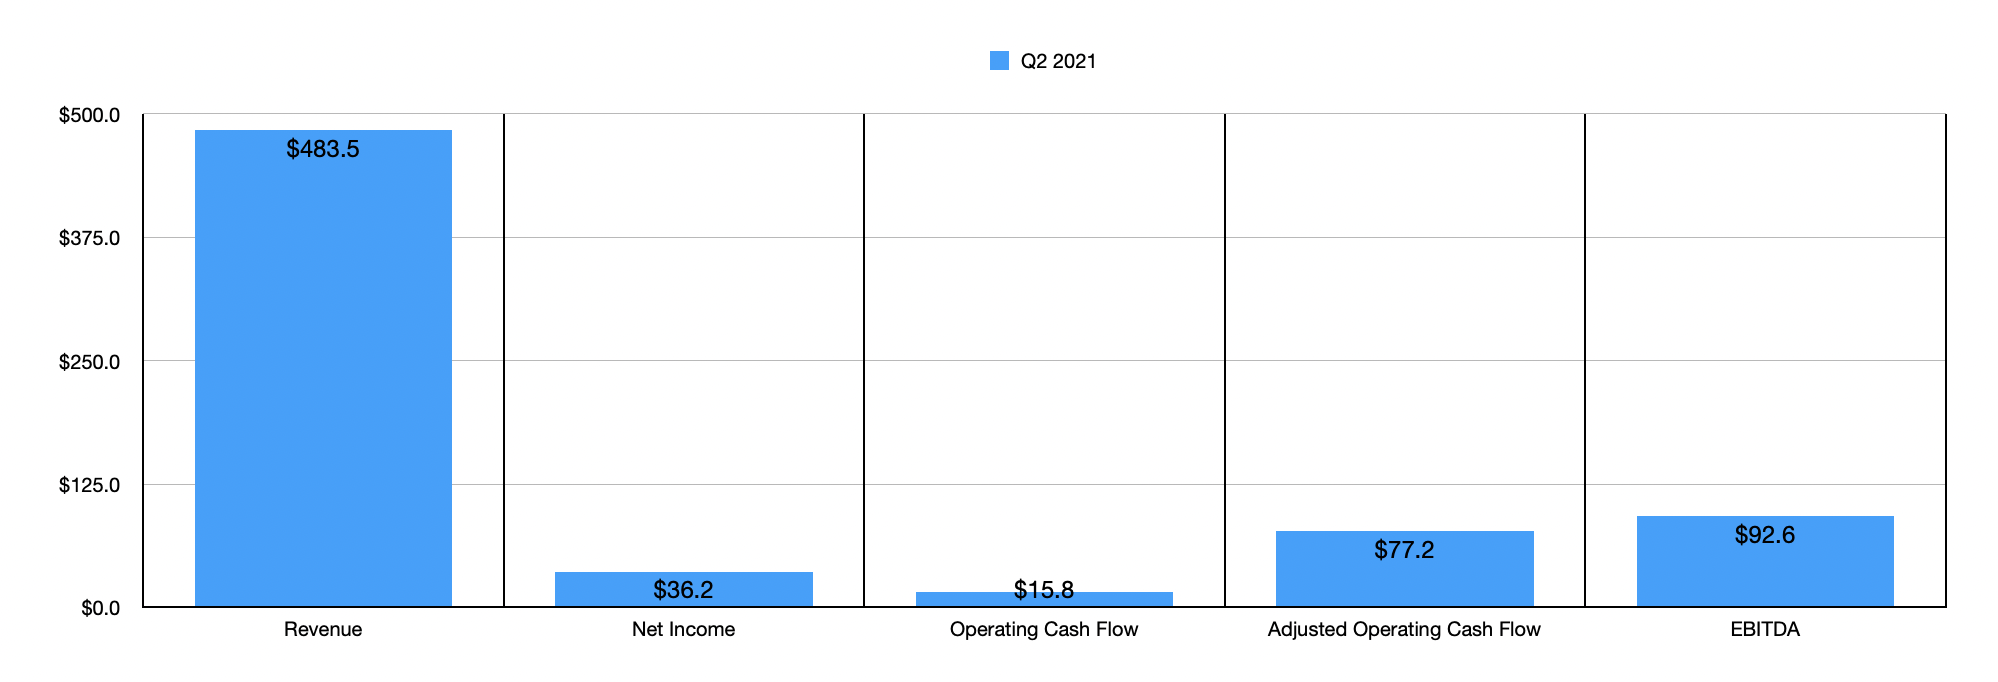
When it comes to the 2022 fiscal year in its entirety, management has been a little vague when it comes to guidance. They did say that pricing actions are expected to offset raw material costs, wage inflation, and other inflationary pressures. And they also said that free operating cash flow should be around 100% of adjusted net income. The company has, however, provided data for the first quarter. They currently anticipate revenue of between $480 million and $500 million. And that should come in spite of a headwind of between $25 million and $30 million associated with foreign currency fluctuations. By comparison, in the first quarter of last year, the company generated revenue of $483.5 million. And today, analysts are currently forecasting sales of $488.1 million. Management has not been as helpful when it comes to profitability, only giving guidance for adjusted operating income. But for the quarter, analysts expect the company to generate profits per share of $0.36. That would be down from the $0.43 per share generated the same quarter last year. On an absolute dollar basis, this would imply a decline from $36.2 million to $30.2 million. More likely than not, this decline would also translate to a drop in cash flow. But no real guidance has been given on that front.
Author – SEC EDGAR Data
But really beyond that, shareholders are left in the dark. Instead of forecasting what the future might hold, I instead decided to rely on the data provided from 2022. Using data from 2022, I calculated that the company is trading at a price-to-earnings multiple of 14.4, at a price to adjusted operating cash flow multiple of 6.7, and at an EV to EBITDA multiple of 7.2. These members compare favorably against the data from 2021, with metrics of 38.2, 9.9, and 9.4, respectively. As part of my analysis, I also compared the company to five similar businesses. On a price to operating cash flow basis, four of the five companies had positive results, with multiples of between 14.4 and 33.9. And using the EV to EBITDA approach, the range was between 10.4 and 16.1. In both cases, Kennametal was the cheapest of the group.
| Company | Price / Operating Cash Flow | EV / EBITDA |
| Kennametal | 6.7 | 7.2 |
| Mueller Water Products (MWA) | 33.9 | 10.8 |
| Hillman Solutions (HLMN) | N/A | 16.1 |
| Kadant (KAI) | 14.4 | 11.4 |
| Helios Technologies (HLIO) | 17.0 | 10.4 |
| ESCO Technologies (ESE) | 24.6 | 16.0 |
Takeaway
Truth be told, I do believe that the easy money has been made when it comes to Kennametal. Having said that, I do also think that shares are cheap enough still to warrant some upside potential. In addition to being cheap on an absolute basis, shares also look attractively priced compared to many other firms. Add in the expectation of further sales growth and put in some padding to account for a potential decline in profits year over year, and I do think the company makes for a soft ‘buy’ from this point.
Be the first to comment