Andrii Yalanskyi
2022 bear market
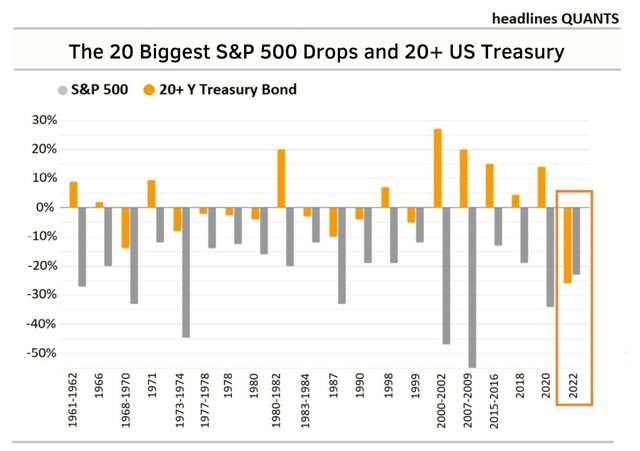
The essence of the 2022 bear market is that there is no safe haven. Absolutely all assets, both stocks and bonds, fell by 20%+. What’s more, the world’s most trusted defensive asset, U.S. Treasuries, has fallen more than the S&P 500 index.
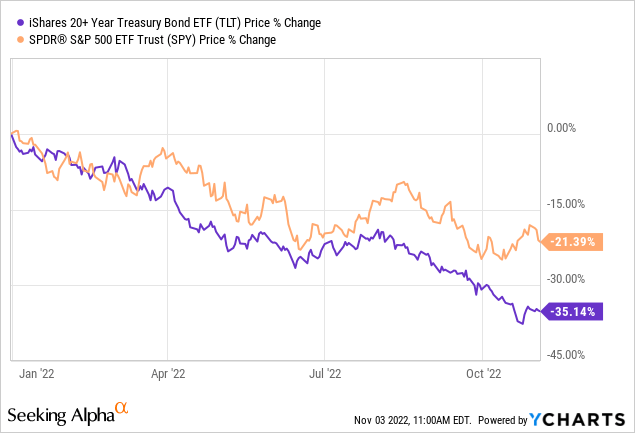
The chart below shows the biggest historical declines in the S&P 500 and the performance of 20+ Y Treasury bonds. In none of these cases, when the index fell to extreme values, were risk-free assets worse than stocks, except for 2022. The current situation is absolutely unique.
Do you know what’s even crazier? This: junk bonds have had a more stable year than treasuries.
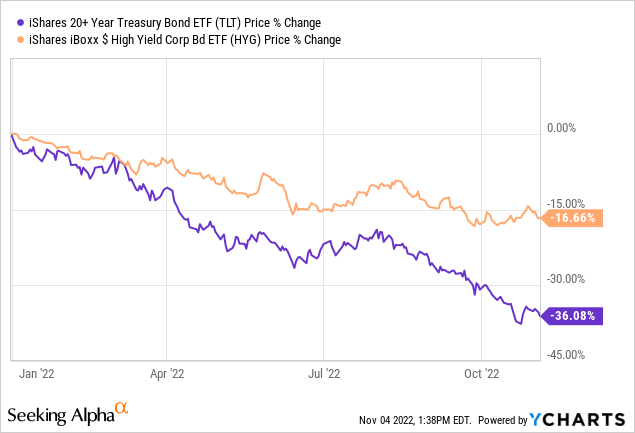
Looking at this instability, the obvious question arises: is everything so bad? Actually yes. The Fed continues to hit the debt market with its rate hikes. However, the situation may improve faster than many expect.
In this article, I will compare iShares 20+ Year Treasury Bond ETF (NASDAQ:TLT) and SPDR S&P 500 Trust ETF (NYSEARCA:SPY) in 6 different scenarios for the global economy in 2023.
Scenario 1: Recession
This is a baseline scenario for the next year. Economists expect a recession that will last from 5 to 12 months. More and more indicators hint at the inevitability of this event.
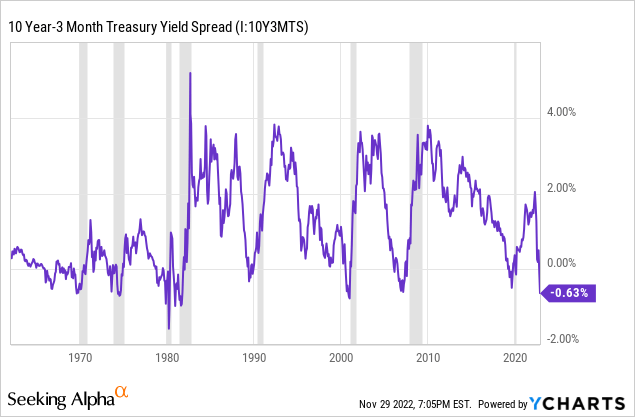
Recently, the most powerful of these indicators have come into play. The spread between 3-month and 10-year bonds has gone into negative territory, which has led to recessions throughout U.S. history.
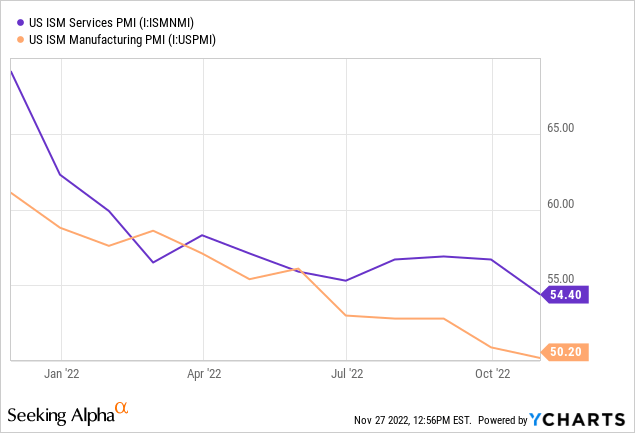
Another great indicator is Manufacturing and Services PMIs, which are now near the 50 mark.
At the moment, the strong labor market is the main thing that keeps hopes of a soft landing alive.
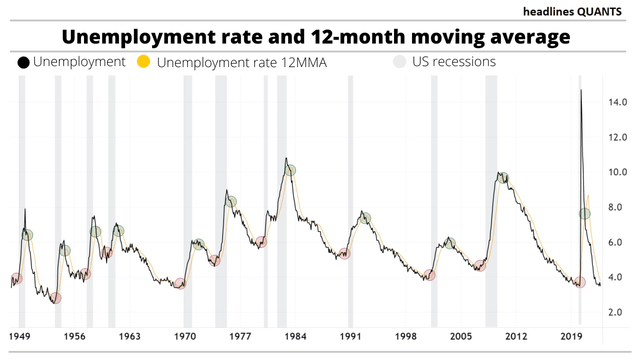
The chart below shows the U.S. unemployment rate and the 12-month moving average since 1948. The red circles highlight the moments when the unemployment rate crossed the moving average from the bottom up, and the green circles – from the top down. Gray lines represent periods of recession. Historically, the crossings marked in red have always been followed by a recession.
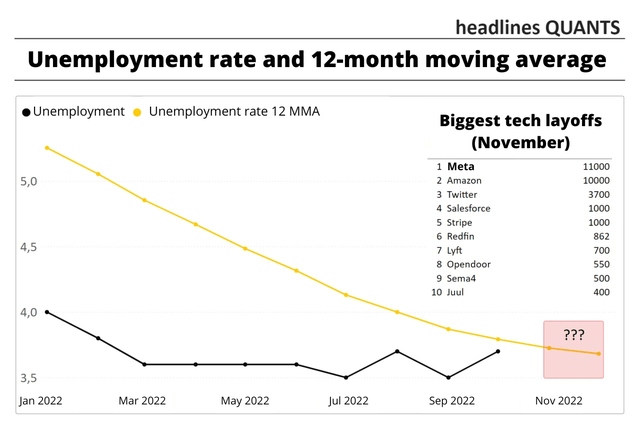
To date, there has been no intersection of unemployment and its moving average, but their values are approaching this.
The U.S. recession is the event that will destroy inflation and put an end to the Fed’s tight monetary policy. When inflation hits zero, if not negative territory, due to falling consumer demand, bonds will become attractive again as their real yields rise significantly. Stocks, however, are likely to remain flat or to fall even deeper, as corporations would report poorer results during that period.
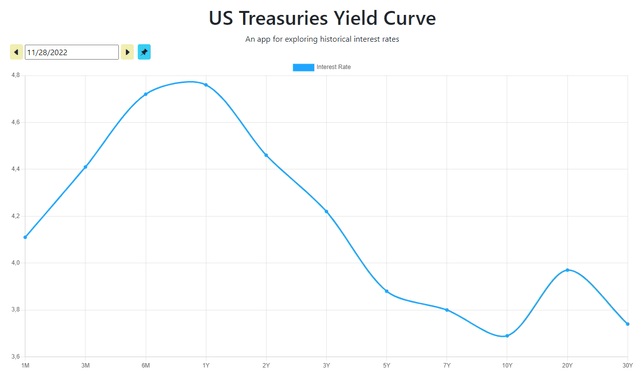
And that is why I bet on the far end of the curve. The yield curve looks like this right now.
The debt market is incredibly smart and already understands that high rates will not last long – they will simply put huge pressure on the economy. This will end soon and will not affect the situation on the horizon for 20+ years.
As usual, bonds are perceived by the market as the best defensive asset in any recession. Treasury securities are the safest in the world and, as has been the case throughout history, bond prices will rise rapidly when the recession hits.
I don’t know exactly for how long the Fed will keep interest rates high, but I understand that it won’t be for long. Next year, we should see a full rate cut. Investors will buy out the far end of the curve first.
Scenario 2: Stagflation
This one is trickier. First of all, the chances of stagflation happening are pretty low. If everything is reduced to the labor market and inflation, then stagflation is a situation in which inflation rises along with unemployment. There might be two reasons for this:
- Cost-push inflation. Producers can’t reduce prices due to high production costs. In the current situation, surging energy prices is the thing that can trigger inflation to go higher.
- The Fed is injecting liquidity into the markets, but the government is putting pressure on companies. In such a situation, there is a lot of money in the economy, but companies cannot produce enough goods and hire employees to expand production.
Concerning the first reason, at the moment, the price of oil is at a fairly high level, but already well below $100. Supply disruptions from Russia, concerted OPEC+ action, and a lack of spare capacity, as well as the reduction of U.S. oil reserves, have faded into the background as recession risks have emerged. This shows that the oil market is not so unstable as to lead to runaway inflation. Now it is difficult to imagine what must happen for Brent oil to get back to the June values of $120+. The same thing happens in gas prices in Europe: while there are still a lot of problems on the supply side, the recession factor is unbeatable. We will look into the Fed printing scenario a bit later.
Crude oil price (Macrotrends)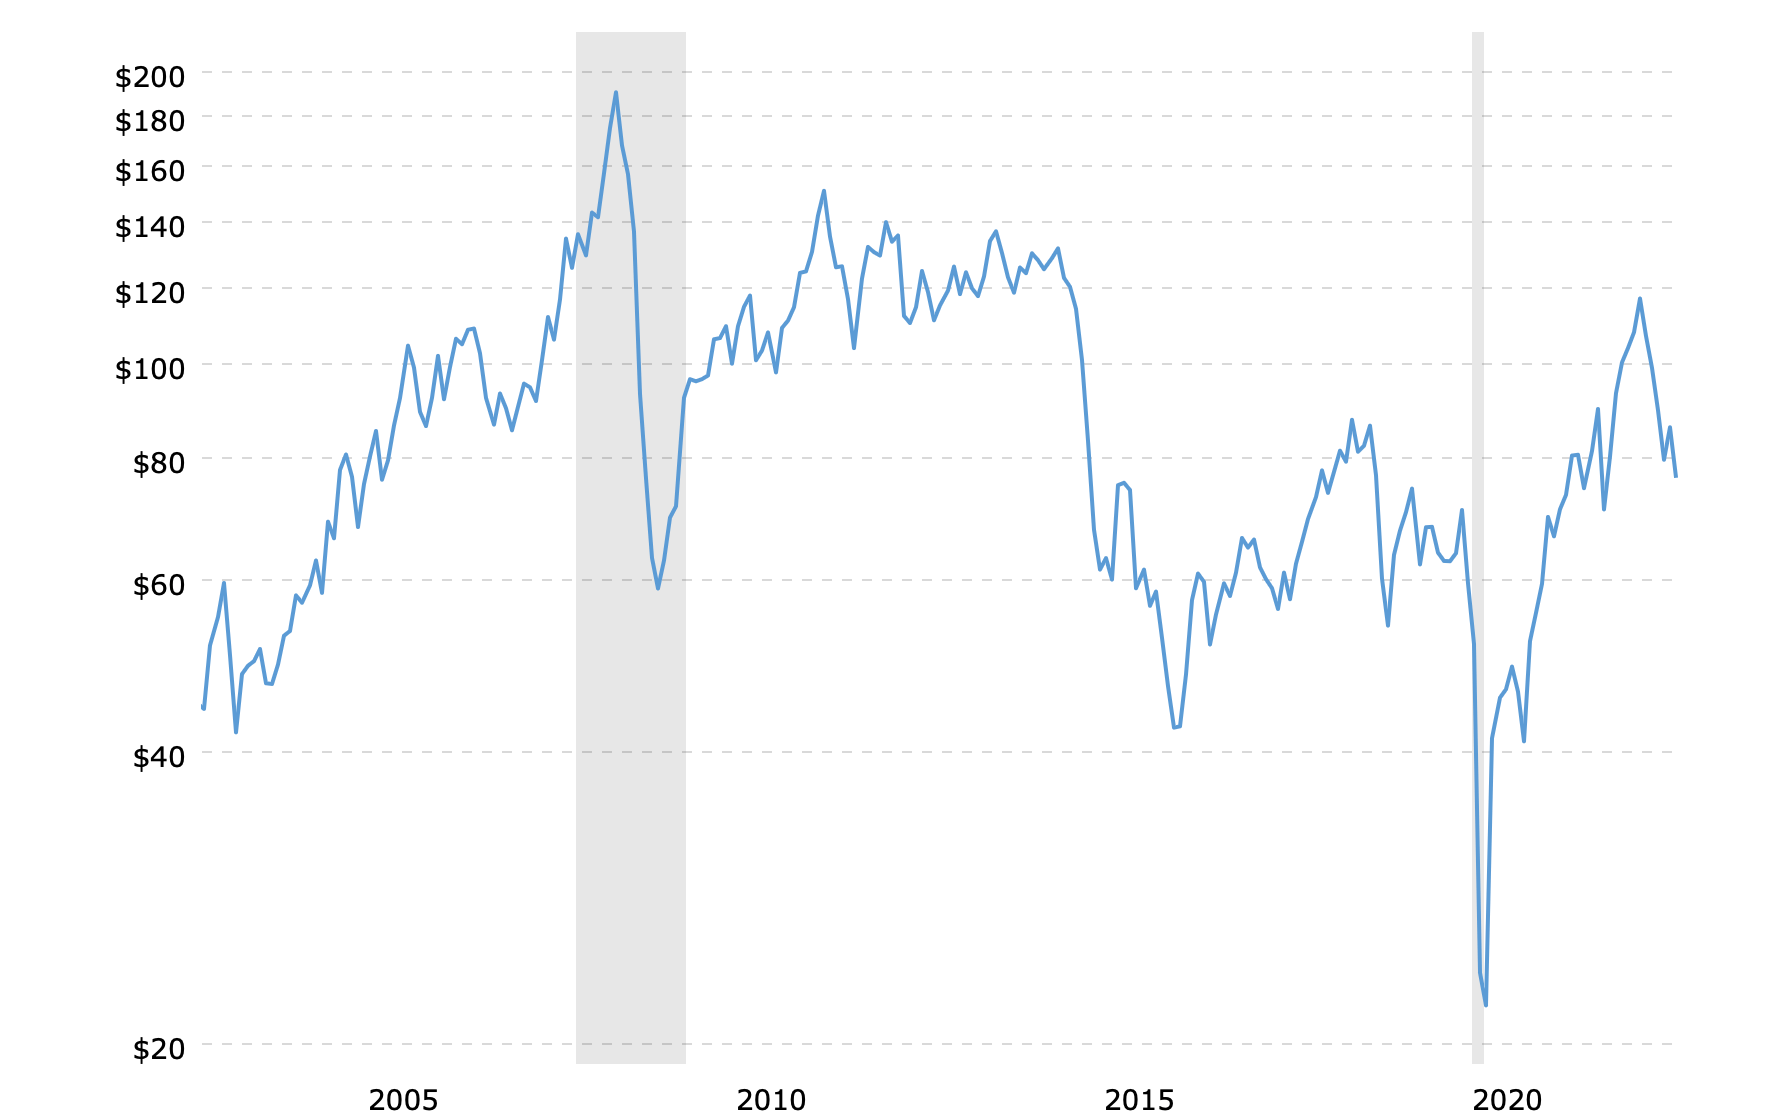
In times of stagflation, both bonds and stocks don’t perform well. Companies can’t handle inflation by passing on costs to consumers as the economy is not growing. On the other hand, bonds tend to fall, too, as the real yield becomes miserable when high inflation hits.
At the same time, 2023 stagflation would be a period when no one will look for yield, since the instability will force investors and financial institutions around the world to simply look for a place to place their funds even if the real yield would be close to zero. Thus, I believe that TLT will outperform SPY in the stagflation scenario.
Scenario 3: Soft landing
Never put off the table positive scenarios. The Fed, as well as the current administration, prays for a soft landing, as the mid-term outlook is not so positive after all.
The task is rather difficult – to cool demand enough to bring prices under control, but not so much that the economy falls into a recession. There have been 11 Fed tightening cycles since 1965, and 8 of them have ended in recessions of various sizes. Jerome Powell said there were soft landings in 1965, 1984, and 1994. However, those three times the Fed was only trying to contain inflation, and now it needs to be brought down sharply in real terms.
At the same time, it is still possible, as the strong labor market acts as the Fed’s helping hand right now. However, the regulators need to be one step ahead of everything. The talk that rates should continue to be raised and kept high just because historical data warns against policy easing should stop. And here we come to the fact that although the Fed will fight the economic slowdown with rate drops and a QT pause, it is okay with the fact of a recession happening. In 2023, Powell will fight not with inflation, but with a drop in confidence in the regulator. They just don’t want to allow the massive economic collapse that could happen due to several different factors. That is why I would not hope for a soft landing.
Nevertheless, a soft landing would require federal funds rates to be lower than they are now because the 4%+ rate hits the economy with a sledgehammer. This can be seen in the slowdown in home sales. It would also need a QT pause. So, I still believe that TLT has a pretty big growth room in the soft landing scenario. I also believe that TLT would have a much greater upside than SPY since TLT underperformed SPY in 2022.
Scenario 4: Debt crisis
Where in the world could another debt crisis break out? Well, of course, in Europe.
At the dawn of the history of the EU, there were strict requirements for member states and candidates, including a low budget deficit and public debt, as well as low inflation. However, with the rapid expansion of the European Union, all this began to turn a blind eye. Trying to match the socially oriented economies of Germany and France, the newcomers to the EU have significantly increased public debt. The apotheosis was the debt crisis of 2010, which began with Greece and Ireland, and then spread to other countries. Then we saw the fragility of the monetary union.
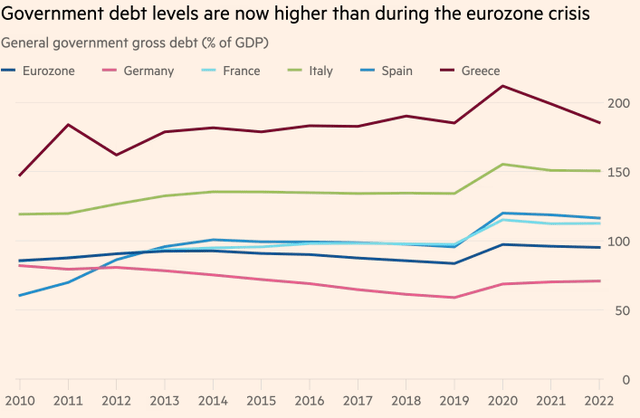
During the pandemic, EU countries have significantly increased the level of public debt. In Greece, it almost exceeds 200% of the GDP. Italy, Belgium, France, and Spain have more than 100%. The ECB’s quantitative easing policy has reduced the cost of borrowing to almost 0% even for once-troubled debtors, like Greece.
Last time the debts of troubled countries were restructured. However, the debts of Italy, Spain, and Greece cannot be restructured right now, as the regulator can’t turn another massive QE on as inflation hits new highs. To combat inflation, the ECB began to aggressively raise the key rate, but because of this, countries are beginning to feel the increased interest payments on their debts. Add to that an energy crisis and an economic downturn and you have the perfect storm.
But the most important thing for us is the aftermath of this instability. Troubles in the Eurozone are great news for TLT. The inflow of capital into the U.S., which has already begun, will accelerate. The treasuries will be the only real protective asset in the world. This, in turn, will naturally lead to a fall in government bond yields. At the same time, instability anywhere in the world is bad news for SPY. Thus, I expect TLT to outperform SPY if the EU debt crisis will gain momentum.
Scenario 5: Saving the system
Given the super-aggressive rate hike, the question begins to arise – will this not undermine the economic system as such? And if it will, then what are the Fed’s next steps? It is important to understand that if federal funds rates rise well above 5%, then some of the structurally important institutions of the economy will begin to shake. Pension funds, which hold onto the insane amount of Treasury securities and investment-grade bonds, will be the first to feel the blow, and some banks might also feel the pressure. And who knows what will happen next?
Therefore, if something goes wrong, we will hear the loudest “stop!” throughout the history of the Fed. First, the rates would be cut, then the QT would be abandoned. The regulators would simply give up on inflation and start saving the system. How? This is to be found out. Most likely, the standard QE. Then you can forget about single-digit inflation. And while the likelihood of things going this far is incredibly low, it’s worth keeping this scenario in mind, as the aftermath of this will be felt well decades later.
And yes, TLT would outperform SPY in this one since the debt market will be supported by the regulators, not the consumer. The positive on the stock market should last for a maximum of a quarter until market participants begin to consider the negative consequences.
Historical performance
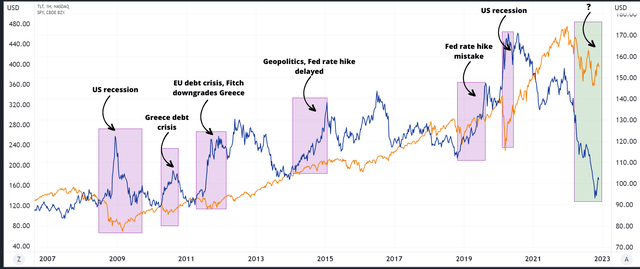
The chart below shows the historical performance of SPY and TLT in different scenarios.
Conclusion
As we can see, in all five scenarios above, TLT will overperform SPY for various reasons. It all comes down to the fact that interest rates should not last at these levels for very long. I think that in 2023 the situation will develop as rapidly as before. Therefore, I see a large upside in TLT on the horizon of the year.


Be the first to comment