

Michael M. Santiago/Getty Images News
Editor’s note: Seeking Alpha is proud to welcome Natural Born Value Seeker as a new contributor. It’s easy to become a Seeking Alpha contributor and earn money for your best investment ideas. Active contributors also get free access to SA Premium. Click here to find out more »
Citigroup Inc. (NYSE:C), one of the big U.S. money center banks, is up for grabs. After doing some legwork, we’ve concluded that Citi is a strong buy. Based on the assumptions made in our analysis, Citi’s stock is undervalued by 50%.
Citi shares have been hammered this year, falling more than 25% YTD. Compared to its peers, the current price of Citi seems reasonable as its current return on equity (ROE) and payout ratio are not that impressive. If we dig a little deeper and look for value, we can identify some reasons for this decline, and we’ll see the situation isn’t as bleak as it appears.
The current economic environment has a clear negative impact on Citi’s high-return and capital-light banking and market segments, resulting in a decline in Citi’s ROE. The unimpressive payout ratio is the result of Citi’s efforts to fortify its balance sheet, preparing for an uncertain future. Since Wall Street is usually more focused on the next quarter than the next year, we are presented with the opportunity to load up on this high-quality, long-term compounder.
Citi and Its Peer Group
The Financial Stability Board puts together a list of Global Systemically Important Banks (G-SIB). We’ll define our peer group by focusing on the eight U.S. banks on the list. We’ll rank the firms by their size, using net income as reference. Additionally, we’ll compare the Common Equity Tier 1 capital (CET1) ratios, the price to tangible book value (PTBV), and ROE. The numbers are computed using the numbers from the trailing 12 months.
Since cash flows within a financial services firm cannot be easily estimated (because items like capital expenditures, working capital, and debt are not clearly defined), we’ll focus only on observable cash flows: dividends and buybacks.
|
Name |
Net Income | CET1 (mrq) | Div. Payout Ratio |
Total Payout Ratio |
PTBV (mrq) | ROE |
|
JPMorgan (JPM) |
$37,067.00 | 12.50% | 36.49% | 56.14% | 185.61% | 12.87% |
| Bank of America Corporation (BAC) | $27,409.00 | 11.00% | 29.12% | 71.47% |
169.47% |
10.17% |
| Wells Fargo & Company (WFC) | $16,068.00 | 10.30% | 29.61% | 110.31% | 135.57% | 9.01% |
| Citigroup | $15,505.00 | 12.20% | 30.66% | 48.05% |
57.24% |
7.79% |
| The Goldman Sachs Group, Inc. (GS) | $13,870.00 | 14.60% | 25.21% | 43.24% | 113.55% | 11.66% |
| Morgan Stanley (MS) | $12,489.00 | 14.80% | 32.53% | 118.13% | 208.93% | 12.17% |
| The Bank of New York Mellon Corporation (BK) | $2.893.00 | 10.00% | 46.60% |
64.06% |
219.03% | 7.25% |
| State Street Corporation (STT) | $2.738.00 | 13.20% | 33.38% | 35.17% | 185.58% | 10.68% |
| Average | $16.004.88 | 12.33% | 32.95% | 68.32% | 159.37% | 10.20% |
Citi’s net income of ~$15.5 billion puts it right in the middle of its peer group. As of October 2022, Citi’s regulatory capital requirement is 11.50%. In January 2023, regulatory requirements will climb to 12% because of an increase in Citi’s G-SIB surcharge. Its current (Q3 2022) CET1 capital ratio is 12.20%, giving Citi some room to breathe heading into 2023.
On average, Citi is returning less cash to its shareholders than its peers, making it less attractive. Longer term, retaining a higher percentage of cash to fortify the balance sheet looks like a smart move. Increasing regulatory requirements could be imminent if the economy continues its downward trend with GDP in the U.S. for Q1 2022 and Q2 2022, decreasing 1.6% and 0.6%, respectively. According to comments from the CEO during the Q3 2022 earnings call, Citi is expecting a “mild” recession by mid-2023. It seems like Citi is preparing for an uncertain future and is willing to inflict some short-term pain on its shareholders. This might be one reason some of them have bailed on the stock, pushing down its price.
Looking at the PTBV, we notice that Citi trades way below its tangible book value. The tangible book value is the price that accountants think they can get for liquidating the company. Normally, a company trades near its tangible book value, or at a premium if investors think they will get an attractive return on their investment. Conversely, Citi’s peers are trading at a big premium to their tangible book value.
Several reasons could explain Citi’s massive discount: a higher growth rate in Citi’s operating expenses (+8% YoY) compared to the growth in their total revenues (+6% YoY); a net allowance for credit losses (ACL) build-up of $370 million in the current quarter, vs. an ACL release of $1.162 million in Q3 2021; a slight uptick (+4.35%) in the net credit loss from Q2 2022 to Q3 2022; and Citi’s current ROE is way below the average of its peer group – according to my calculations (shown below), its ROE is also below its cost of equity (7.79% compared to 11.57%).
Show Me the Money
Next, we review the information released on Oct. 14, 2022, in Citi’s Q3 2022 report. We examine the revenue-generating business segments and assess how they are impacted by rising interest rates, the current global slowdown, and Jane Fraser’s strategy of making Citi a less complex business. I don’t want to waste your time, so if you’ve already read the report, you can jump to the “Intrinsic Valuation” section of this article.
Citigroup Third Quarter 2022 Press Release (Citigroup.com)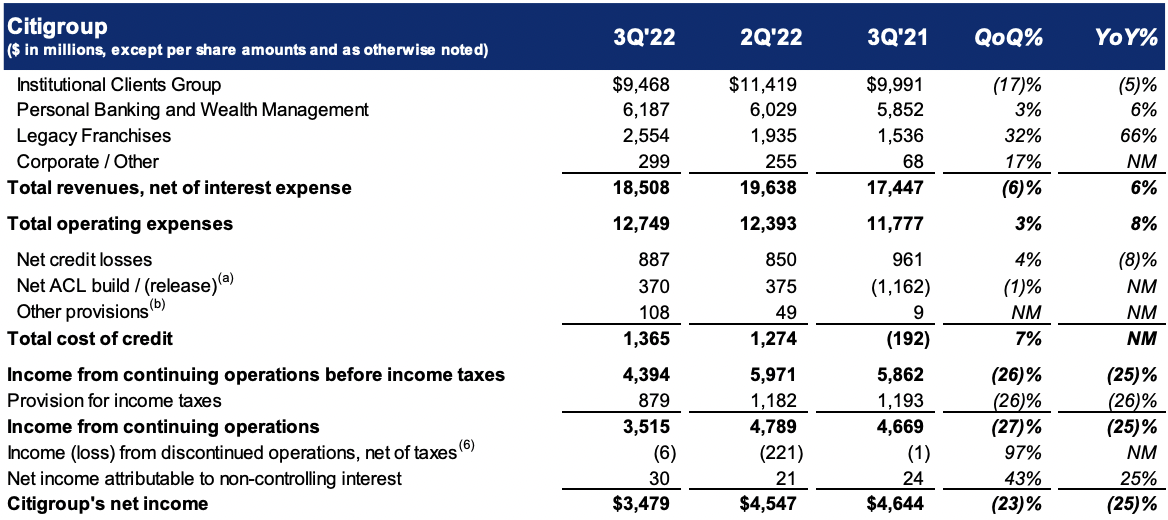
First, the Institutional Clients Group (ICG) consists of:
-
Services revenues
-
Markets revenues
-
Banking revenues
In Q3 2022, the ICG made up the bulk (51.15%) of Citi’s revenues at $9.468 billion. The main drivers in this segment are services revenues (+33% YoY), which are the heart of Citi’s global network. Leading the services revenues are security services (+15% YoY) and treasury and trade solutions (TTS) (+40% YoY). Security services and TTS profit from the higher interest rate environment and generate incredibly sticky relationships with strong, fee-based returns.
Conversely, not only have market revenues decreased (-7% YoY), but the biggest blow comes from a decrease (-49% YoY) in banking revenues. This hefty decrease is the result of slowed client activity due to heightened macroeconomic uncertainty and volatility (e.g., investment banking activity (-64% YoY) and corporate lending (-11% YoY)). In this segment, Citi feels the pain significantly, as the banking segment represents their high-returning and capital-light business segment.
While revenues in the ICG business segment have decreased (-5% YoY) the operating expenses in this segment have increased (+10% YoY), resulting in a 30% decrease in ICG net income. This is largely driven by the costs that occur from Jane Fraser’s strategy – for example, the transformation of investments results in higher operating expenses.
Next, personal banking and wealth management (PBWM) consists of:
-
U.S. personal banking revenues
-
Global wealth management revenues
PBWM accounted for 33.42% of Citi’s revenues during this quarter at $6.187 billion. U.S. personal banking serves ~72 million customers. U.S personal banking revenues saw its revenues increase (+10% YoY), coming from strong, double-digit growth in branded cards (+10% YoY) and retail services (+12% YoY), both profiting off rising interest rates. Despite facing high inflation (8.2%), the U.S consumer remains resilient as consumer spending increased by 0.6% in September.
Global wealth management revenues faced a decrease (-2% YoY) as investment fee headwinds, particularly in Asia, more than offset net interest income growth from the higher interest rates. While total revenues of PBWM increased (+6% YoY), the operating expenses rose at a higher rate (+13% YoY), primarily driven by the transformation of investments and risk and control initiatives. Again, this is in line with Jane Fraser’s strategy.
The decline in PBWM net income (-58% YoY) is largely driven by the net ACL release of $843 million in third quarter 2021, vs. a net ACL build of $379 million in the current quarter.
Legacy Franchises
Legacy franchises accounted for roughly 13.79% in Q3 2022 at $2.554 billion. The sale of Citi’s consumer business in the Philippines is a reflection of the CEO’s mission to simplify Citi’s core businesses. This sale, and the absence of the Australia consumer business loss on sale in the prior year period, led to the substantial increase in legacy franchise revenues (+66% YoY).
The result of those actions is a net income in this segment of $316 million compared to a net loss of $200 million in the same period in the previous year.
Corporate/Other Revenues
Corporate/other revenues accounted for $299 million and make up roughly 1.64% of Citi’s revenues. Corporate/other income rose to $22 million from a loss of $141 million in the prior year period, reflecting the higher revenues and the lower expenses.
Intrinsic Valuation
To estimate the intrinsic value of Citi, we use an excess return model. Given that debt for a bank is like flour for a baker – namely, raw materials – we’re focusing solely on equity.
Most assets of financial services firms are financial assets that are mark-to-market; hence, we can use the book value of those assets to measure the equity capital currently invested in the firm. Financial services firms need capital to grow and to fulfill their regulatory requirements; therefore, they retain earnings to fulfill these needs. Implicitly, we assume that even mature companies cannot pay out their entire earnings in the form of dividends and buybacks.
Since we’re focusing only on the equity part, we multiply the equity invested in the company by the return on that equity to get to the net income. For the cost of equity, we use the current risk-free rate (10- year U.S. Treasury bond), a bottom-up beta (an average beta of the eight U.S, banks), and an implied equity risk premium (ERP).
-
Value of Equity = Equity Capital Invested Currently + Present Value of Expected Excess Return to Equity Investors
-
Excess Equity Return = (Return on equity – Cost of Equity) * Equity Capital Invested
-
Beginning BV of Equity (t+1) = Beginning BV of Equity (T) + Retained Earnings (T)
-
Net Income (T) = Beginning BV of Equity (T) * ROE (T)
-
Cost of Equity = Risk Free Rate + (Beta * ERP) = 4.04% + (1.31 * 5.75%) = 11.57%
Excess Return Model
Excess Return Model (Google Sheets)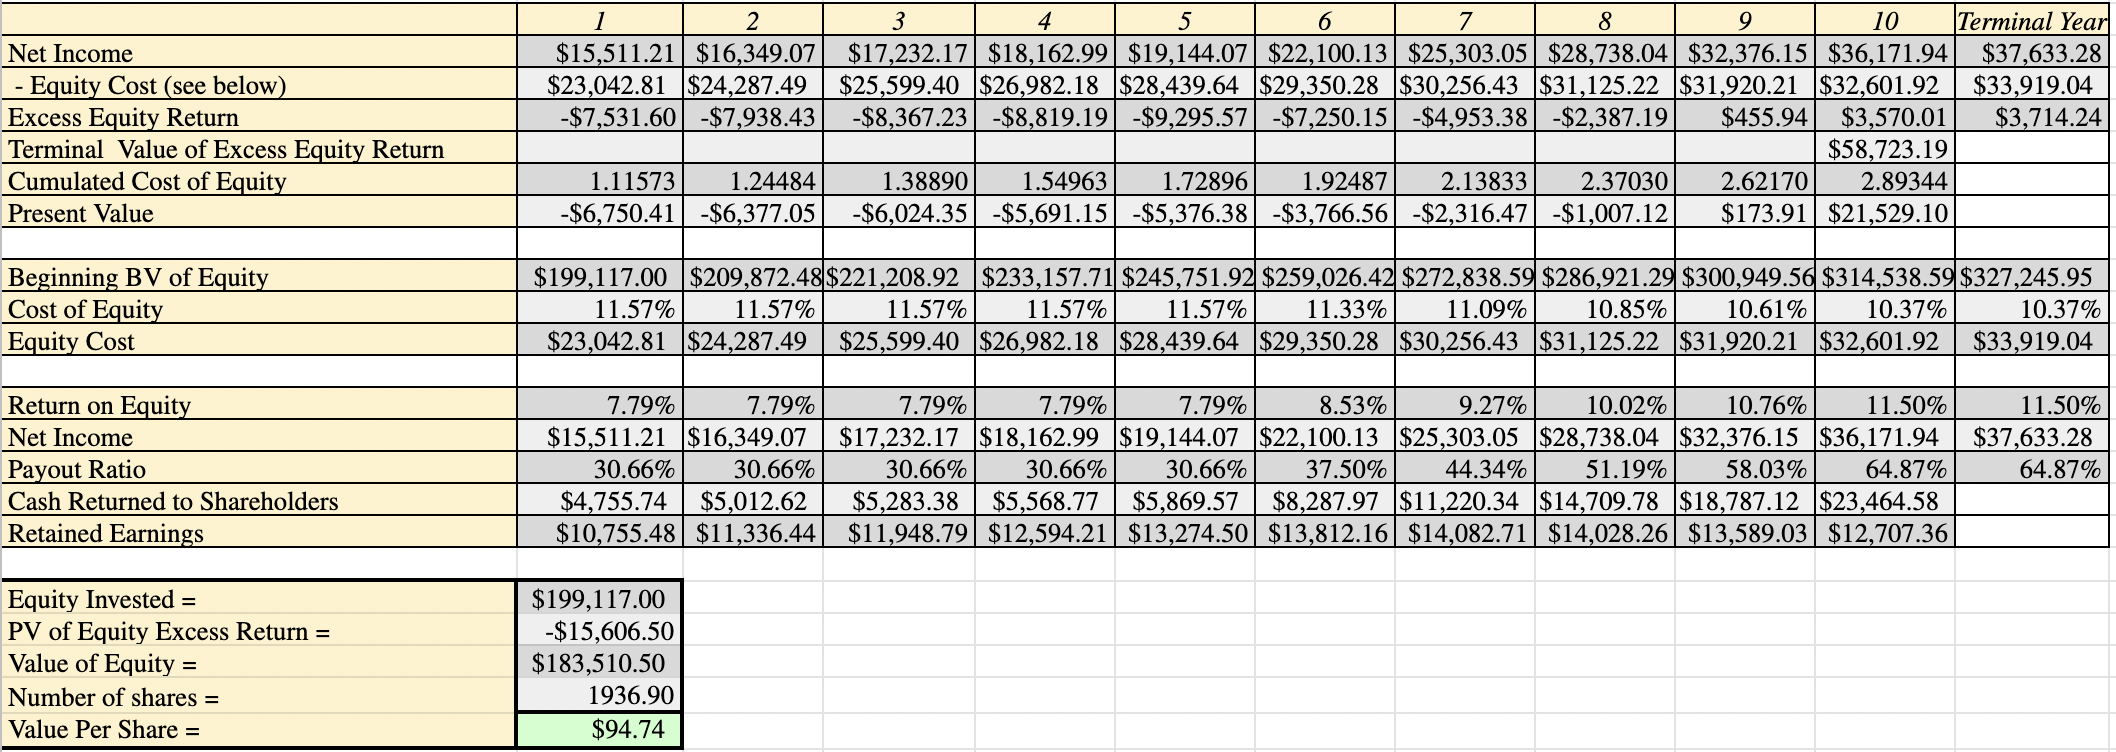
We start in year one with 7.79% ROE (computed using LTM numbers), and hold it constant for the first five years. This number reflects the current economic slowdown and the decrease in Citi’s banking and market revenues, which represent its high-returning and capital-light businesses. In year six, the ROE begins to climb, reflecting the comeback of those beaten-down segments. Implicitly, we assume that the economic turmoil won’t last longer than five years. In the terminal year, the ROE will reach 11.50%, which falls in the middle of the target numbers (11% to 12%) provided in Citi’s investor day presentation 2022.
In the first five years, which represent Citi’s growth phase, we start with a payout ratio of 30.66% (LTM dividend payout ratio, Citi has stopped its buybacks in Q3 2022). During this time, Citi retains a big portion of its earnings to keep building up its CET1 capital to fortify its balance sheet. This is a conservative statement, but due to the uncertain economic environment (potential increase in non-performing loans or a full-on recession), and the potential need for future capital requirements, we chose this approach. In year six, Citi starts to mature, slowly moving toward a stable growth period. As a consequence, the cost of capital will slowly decrease, reaching 10.37% in the terminal year.
In years six through 10, Citi will focus more and more on returning cash to its shareholders. The payout ratio will increase, reflecting the ameliorating economic conditions and the increase in returns, driven by the return of Citi’s banking and market revenues. This increased amount of cash that Citi returns to its shareholders will not only consist of dividends, but we also expect the return of buybacks. In the terminal year, Citi will be a mature bank with a stable growth rate of 4.04% (U.S. 10-year Treasury bond rate as of Nov. 2, 2022). In stable growth, Citi will only retain the earnings that are needed to grow at its stable rate and to meet its regulatory requirements. The remaining (the majority) will be returned in the form of dividends and buybacks to its shareholders. The payout ratio is calculated by rearranging the fundamental stable growth rate formula:
-
Growth Rate in Stable Growth = (1 – Payout Ratio in Stable Growth) * ROE in stable Growth
-
Payout Ratio in Stable Growth = 1 – (Growth Rate in Stable Growth / ROE in Stable Growth) = 1 – (4.04% / 11.50%) = 64.87%
Under these assumptions, the amount of cash Citi returns to its shareholders will increase from $4.76 billion in year one to $5.87 billion in year five and to $23.46 billion in year 10. During this period, Citi’s net income and its payout ratio will also more than double. Since we expect Citi to be a mature firm that grows, approximately, at the rate of the economy, Citi doesn’t need to retain a lot of cash. Thus, the majority will be returned to its shareholders.
Finally, even though we assume that the bank will at some point start buying back its own shares, we leave the number of shares outstanding unchanged, as assumptions over the future share count are too unpredictable. Using all of these assumptions, we come up with a current per share value of ~$95.
Risks
Like every firm in the market, Citi is not free from risks. Most of those risks come from macroeconomic, geopolitical, and other global uncertainties – black swans, meaning they are unpredictable. Who could have known back in January that Russia was about to invade Ukraine? Nobody knows how long China’s COVID-19 lockdowns will drag on, or how inflation rates will look in three, six, or nine months.
Worst case, the quantitative tightening, and the interest rate hikes by the Fed put us in a full-on recession. In that scenario, Citi will have to substantially increase its regulatory capital, due to a hefty increase in nonperforming loans, resulting in a lower-than-assumed payout ratio. On the earnings side, Citi’s ROE will probably be lower than our assumptions as the banking and market revenues won’t come back as fast as estimated.
Other risks can include operational risks that result from mistakes caused by employees, systems, or processes; liquidity risks, meaning the inability to provide cash in a timely manner to customers, which can result in a snowball effect and end up in a bank run; the risk that Jane Fraser’s strategy doesn’t play out as planned and results in higher than expected operational costs, etc.
There are plenty of unknown risks, making it important to keep the feedback loop open and constantly revisit assumptions made in our valuation model, making changes if necessary.
Conclusion
CEO Jane Fraser shows us that she is highly focused on her long-term strategy to make Citi a less complex and more focused bank. This can be seen in the reduction of Citi’s exposure to Russia and the sale of the Philippines’ consumer business to UnionBank of the Philippines. In the short term, those changes come with some pain in the form of higher operating expenses. In the long term, Citi’s operating expenses should fall back to a lower level and grow at a lower rate than their operating revenues.
Looking at the big picture for Citi, we spot some dangers and some opportunities. As banks reflect on the current uncertain economic environment led by the aftereffects of the pandemic, the war in Ukraine, and the turmoil in the financial markets, it’s clearly inflicting some pain on Citi’s core businesses.
The pain – mainly driven by a slowdown in client activity, interest rate hikes, reduced deal flows, and a lower appetite for M&A – is especially felt in Citi’s capital-light, high-return market, and banking revenues. Investment banking (-64% YoY) and corporate lending (-11% YoY) are suffering the most. On the bright side, the current financial turmoil will hopefully not last forever. Over the long term, Citi’s beaten-down business segments will come back and feed into their potential for higher ROE.
But it’s not all bad. Interest rate hikes, in Citi’s case, work like a double-edged sword. Some business segments suffer while others profit, namely their TTS revenues (+33% YoY) and their security services (+15% YoY). Moreover, in their fixed-income segment, Citi matched last year’s showing through their strength in FX.
Looking at the excess return model, if our assumptions play out, Citi could be worth around $95. Citi’s current share price sits around $46 – Mr. Market offers us a 50% discount. To make money, the gap between the price and the value of the firm must close. Catalysts for this could be the slowing down and drop in inflation, the end of the war in Ukraine, less tensions between the U.S. and China, relaxation of COVID lockdowns, buybacks, and a general change of market sentiment. All of those factors could push the price of the stock toward its value.
Finally, it’s possible that all of my assumptions are wrong, but the goal of the game is not being right – the goal is being less wrong than everyone else.
Be the first to comment