

JHVEPhoto
Investment Thesis
The long-term investment thesis I articulated in my previous article on Ross Stores, Inc. (NASDAQ:ROST) is that:
- Ross provides good quality apparel and home products at 20-60% below the prices of mainstream department stores to cost-sensitive, middle and lower-income consumers who worry less about being seen in the latest fashions and need to make their dollars go further. The company does so by buying, packing away, and re-selling close-out inventory, cancelled orders, and production over-runs from suppliers as well as from over-orders and aging inventory from other retailers.
- Ross is among the largest and best-run discount apparel retailers. It has the scale, efficiency, a sophisticated buying operation, and wide distribution that has enabled it to generate the highest profit margins compared to its peers.
- It has captured market share over the years through strong organic sales (same store sales) growth and increasing store count by opening new stores.
- The company should be relatively recession-resistant as consumers often trade down to cheaper apparel when money gets tighter. Furthermore, it is well-positioned to take share from mom-and-pop competitors that lack the scale advantages and financial stability to withstand a sharp economic recession.
- Ross’s revenue was hit hard by the COVID-19 lockdowns and the shift towards lower margin casual apparel due to the work-from-home trend during the epidemic. However, it has rebounded as COVID-19 fears recede and people restock their wardrobes to return to the office, even on a part-time basis.
Key long-term elements of the thesis continue to hold
After the precipitous drop in 2020 resulting from the COVID-19 lockdowns, Ross’s sales store sales have rebounded sharply, though it has pulled back over the last two quarters as it faces tough year-ago comparisons that were in part driven by customers’ spending of government stimulus checks (figure 1).
Figure 1: Comp store sales
Created by author using publicly available financial data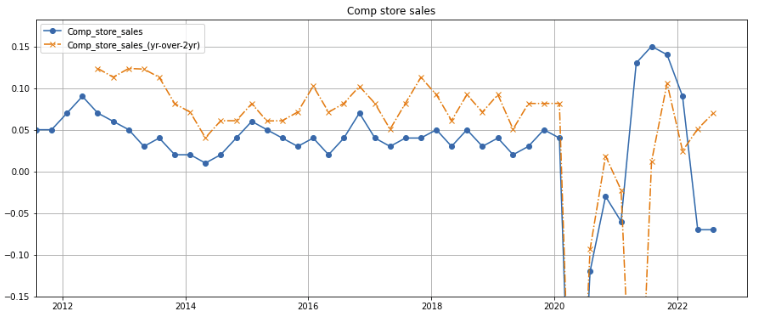
As sales stability returned following the COVID outbreak, the company has continued to open new stores (figure 2, left axis), and its year-over-year store count growth is ticking back up towards the 5% level (right axis). The company has asserted in its quarterly earnings calls that there is still plenty of room for growth before it saturates its markets.
Figure 2: Store count (left axis) and year-over-year change (right axis)
Created by author using publicly available financial data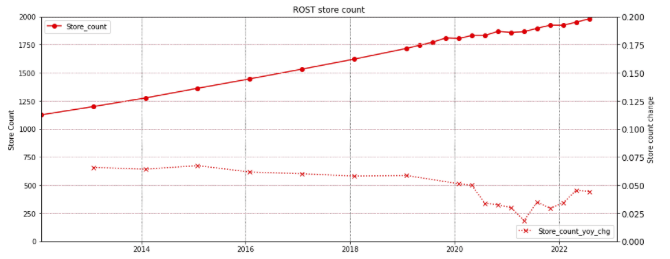
Outlook guidance revised downwards
Aside from 2020 during the COVID-19 pandemic when Ross decline to give guidance, this is the first time in the last eight years that the company has revised its fiscal year earnings guidance downwards (figure 3).
Figure 3: History of fiscal year guidance
Created by author using publicly available financial data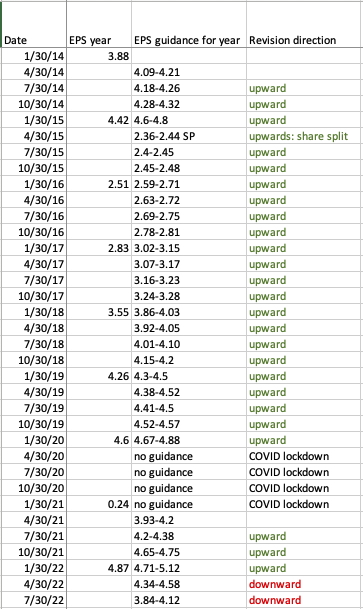
Uncharacteristically, Ross has also under-performed its same store sales guidance (figure 4).
Figure 4: Same store sales guidance and actual results
Created by author using publicly available financial data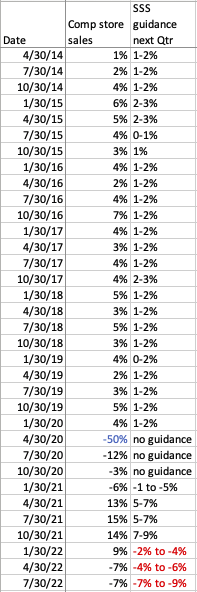
Stock price has pulled back
As a result, the stock price has pulled back sharply from its 52-week highs (figure 5, green line).
Figure 5: Stock price
Created by author using publicly available stock price data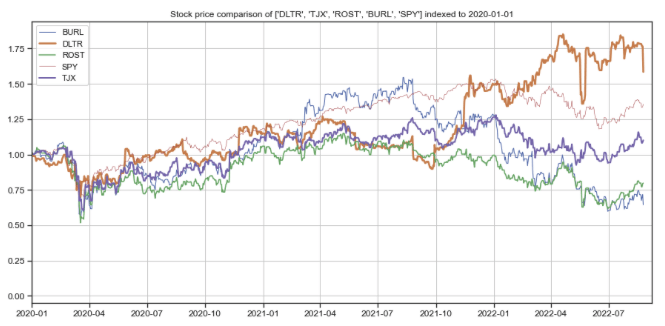
In this article, I analyze the causes of the stock price pullback and examine whether this weakness creates a buy opportunity.
Financial analysis
Revenue growth
The trailing twelve-month (TTM) revenue of Ross and its discount retailer peers, Burlington Stores (BURL) and TJ Maxx (TJX), have plateaued or pulled back in the most recent quarter (figure 6, green, blue, and red lines). Dollar Tree’s (DLTR) TTM revenues have continued to grow, likely due to the nature of its essential food and grocery products, very low price points, and the strategies put in place by Mantle Ridge, a very long-term oriented activist hedge fund.
Figure 6: TTM revenues
Created by author using publicly available financial data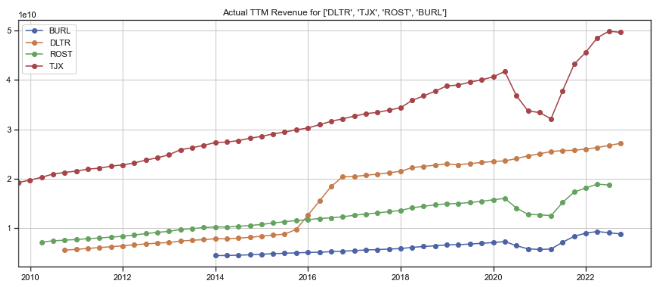
TJ Maxx’s per-share revenues have grown slightly as its share count shrinks due to stock repurchases.
Figure 7: Per-share TTM revenues
Created by author using publicly available financial data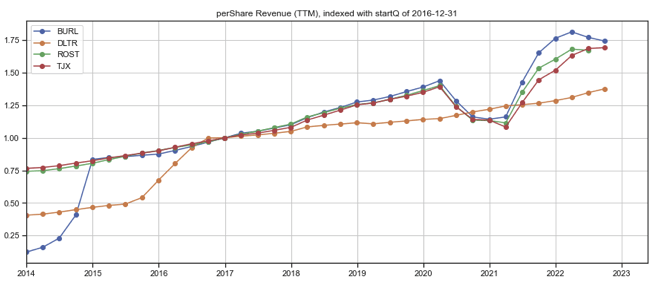
EBITDA margins
The TTM EBITDA margins for these four companies have also dropped to five-year lows.
Figure 8: TTM EBITDA margin
Created by author using publicly available financial data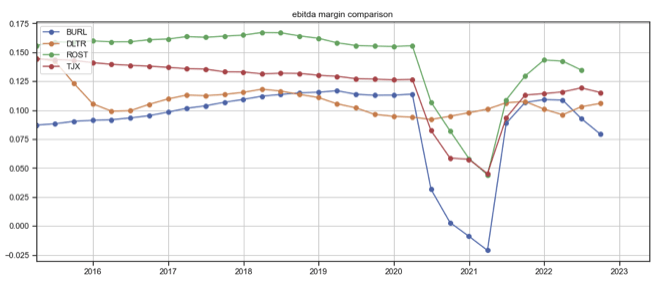
Quarterly numbers
Ross’s quarterly per-share revenues, which have, besides the pullback in 2020 due to the COVID-19 lockdowns, climbed steadily since 2016, stalled this year (figure 9, pink bar), while its quarterly per-share EBITDA has begun stalling since Q4 2021 (figure 10).
Figure 9: Ross quarterly per-share revenues
Created by author using publicly available financial data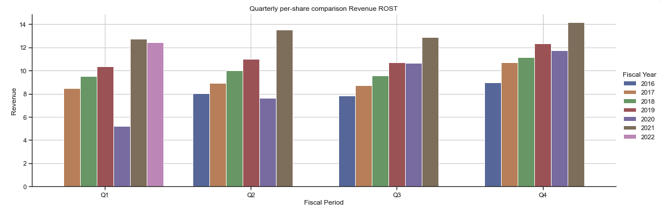
Figure 10: Ross quarterly per-share EBITDA
Created by author using publicly available financial data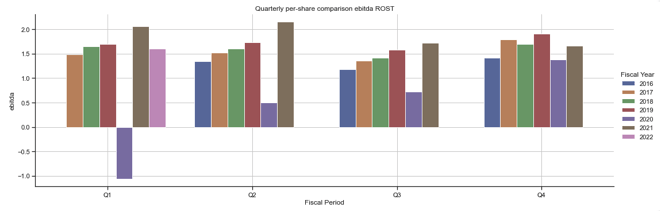
Analysis of recent revenue and margin weakness
Revenues
Ross management attributes the weak revenue growth to:
(1) Tough year-ago comparisons, which benefited from government stimulus checks, and
(2) Slowing consumer demand resulting from escalating inflation of essentials like food and fuel, which have forced customers to cut back on discretionary and semi-discretionary purchases like apparel and home goods–an explanation corroborated by management of Ross’s peers. In its Q3 2021 earnings call, management noted that it is not fully confident in its ability to raise pricing to combat freight pressure–it stated that “in some cases, it’s been absolutely fine, not quite fine in other cases.”
Unfortunately, it has turned shifted in the “not quite fine” direction. Ross’s DD Stores segment, which serves lower income customers, has felt a stronger impact of the spending cutbacks. A September 4, 2022, CNN article, titled I left that $25 backpack for my pre-schooler at the checkout, sums up well the challenges consumers face.
Interestingly, the price of apparel, as measured by the consumer price index of apparel, has remained remarkably stable since 2012 (figure 11, green dashed line). Unlike food, general goods, home improvement and other retailers, Ross’s revenues have benefited very little from price inflation (blue vs orange line).
Figure 11: Revenues, nominal and CPI-adjusted
Created by author using publicly available financial data; CPI apparel data from St. Louis Federal Reserve FRED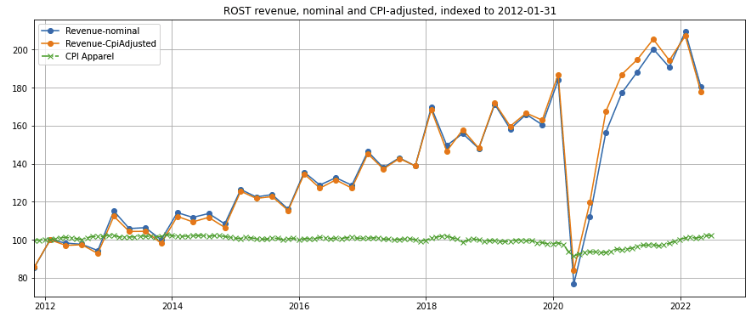
The Federal Reserve’s recent aggressive rate increases (figure 12) are likely to cause more pain in the near term but also are expected to stem inflation and relieve pressure on consumers in the medium term.
Figure 12: The Federal Funds effective rate
St. Louis Federal Reserve FRED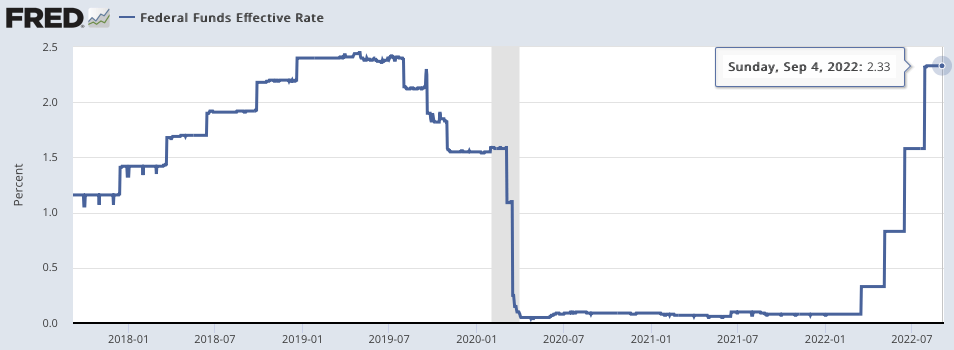
Management noted in the Q2 2022 earnings call that it has not seen indications of trade downs, but I believe it will happen if inflationary pressures persist–while consumers can defer apparel purchases in the short term, they are unlikely to put off apparel purchases over the longer term and will gravitate towards lower cost retailers like Ross and its DD segment if necessary.
Margins
In data provided by Ross management, the main areas of cost pressures causing margin compression are summarized in figure 13:
(1) Merchandise margins: driven down by soaring ocean freight costs and now price markdowns
- Ocean freight costs have pulled back, and
- Price markdowns due to pressure from other retailers likely to abate as competitors work through their excess inventory
(2) Domestic freight costs
- Pressure has abated as its impact on margins have declined from 125 basis points in Q3 2021 to 35 basis points in Q2 2022
(3) Distribution costs
- Management attributed the increase to wages and costs of its new Brookshire, Texas distribution center. This new distribution center should benefit from operating leverage as the number of stores it services grows
(4) SGA
- There was a big step up in wage costs during the Q4 2021 holiday season as Ross struggled to hire and retain labor, but this appears to have stabilized
(5) COVID expenses
- Accounted for 35bp of margin pressure in Q3 and Q4 of 2022, but has declined with the severity of the pandemic and is no longer reported as a separate item.
Figure 13: Areas of margin pressure
Created by author using publicly available financial data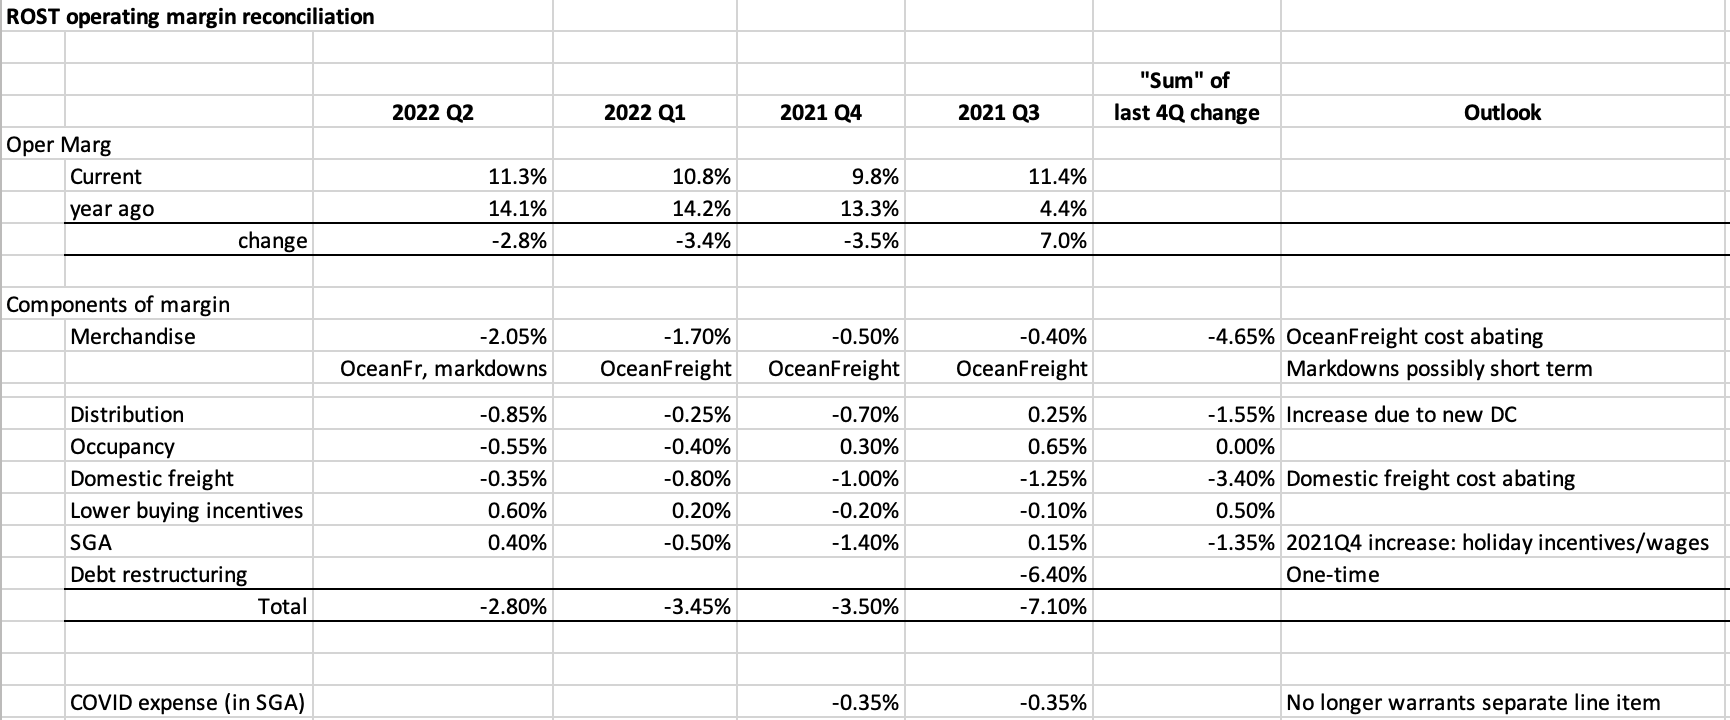
I will elaborate on major drivers of the margin squeeze:
Merchandise margin pressured by ocean freight costs
Ocean freight costs has dropped significantly from the peak. The Freightos Baltic Index (FBX) ocean container spot rate from Asia to the US West Coast has declined by over 50% from its peak (figure 14, dark blue line) and the Drewry World Container Index (WCI) – Shanghai to Los Angeles container rate has dropped by over 60% (figure 15). While the latter remains 3.5x pre-pandemic levels of $1,600, the pace of the rate declines are encouraging.
Figure 14: FBX Ocean container spot rates
Freightos Baltic Index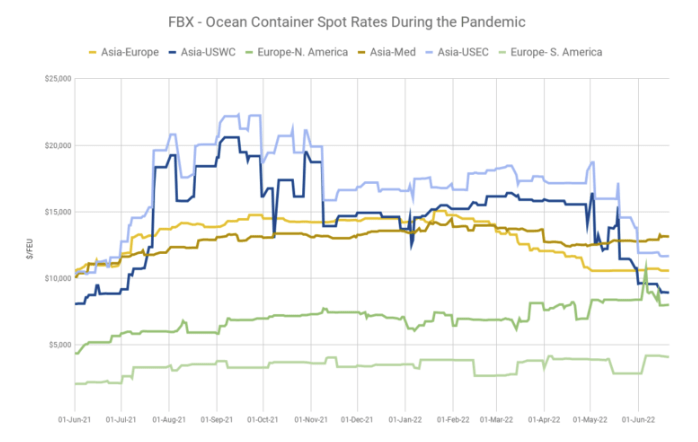
Figure 15: WCI – Shanghai to Los Angeles container index
Drewry World Container Index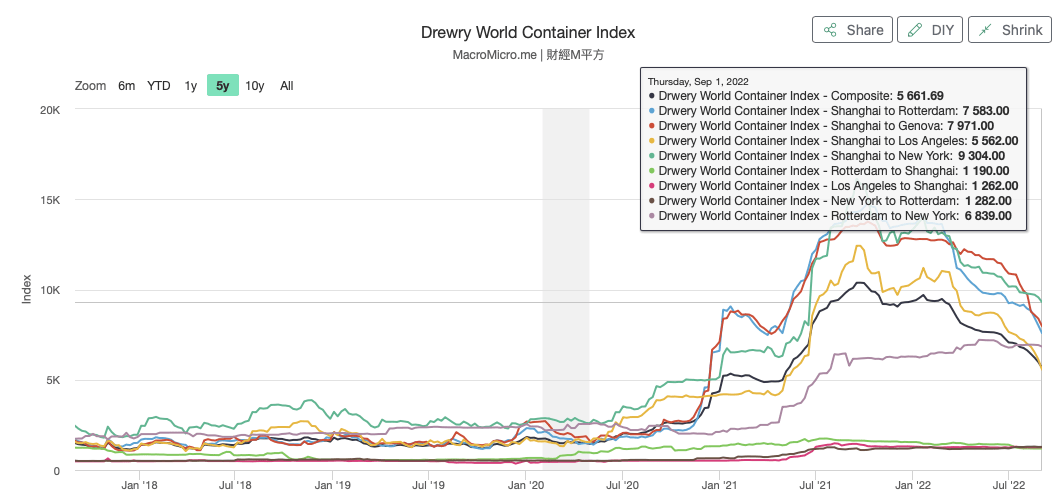
Merchandise margin squeezed by price markdowns
Retailers, both large and small, which amassed extra inventory because they expected sustained demand and supply-chain problems, now have too much inventory and are forced to mark down prices and offer additional promotions to work through unwanted inventory. This has forced competitors like Ross to match prices, which have pressured both their revenues and profit. I am optimistic that prices will stabilize once its competitor retailers work through their excess inventory.
Domestic freight, occupancy, and employee cost inflation
Domestic freight costs have risen the most since the onset of the COVID-19 pandemic but has peaked (figure 16, orange line). Wages have increased steadily and is likely to continue (blue line). However, retail real estate gross rents, which have also grown significantly over the last five years, appear to be moderating (green line).
Figure 16: Relevant inflationary price indices
St. Louis Federal Reserve Fred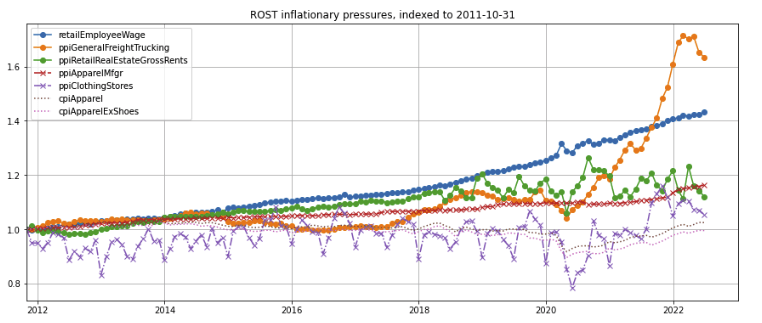
Inventory levels
To determine if the company has, like some other retailers, a problem with excess inventory, I examined Ross’s number of days of inventory held, (defined as inventory/quarterly cost of revenue * 90). I observe that both the nominal inventory (figure 17, blue line) and “real” inventory (inventory divided by the producer price index of clothing stores, admittedly not the best measure but the best I have data for) are high by historical Q2 standards.
Management offers a reasonable explanation on its Q2 2022 earnings call:
Supply chain congestions continue to ease during the second quarter resulting in above plan early receipts of merchandise that we stored in packaways and will flow the store throughout the fall season. Looking ahead, we expect these early receipts to wage and to have the appropriate inventory levels in the fourth quarter.
All this notwithstanding, the relatively stable price of apparel (figure 16 above, brown and pink dotted lines) lessens the risk of large inventory mark-to-market volatility.
Figure 17: Inventory days
Created by author using publicly available financial data, PPI data from St. Louis Federal Reserve Fred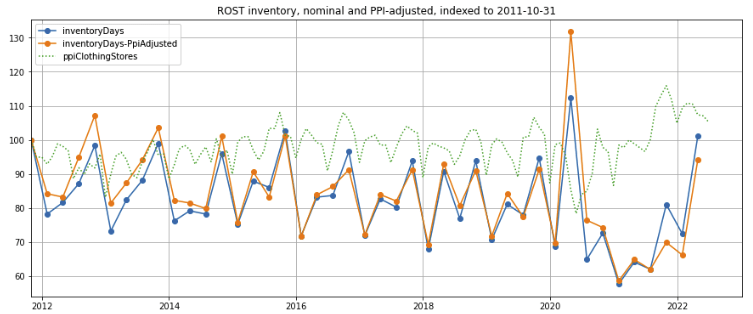
Valuation
Investors have rightly been concerned with the slowdown in same store sale and multiple downward revisions in earnings guidance, which have driven Ross’s earnings yield (the reciprocal of the price-earnings ratio) back to around 5% (figure 18, green line). If the company achieves earnings per share in the middle of its guidance range provided on its Q2 2022 earnings call, the earnings yield will drop to ~4.3%. While Ross stock is not a “pound the table” value at these levels, I believe this may be an opportunity for investors who subscribe to my long-term investment thesis to add to their Ross shares for less.
Figure 18: Valuations
Created by author using publicly available financial and stock price data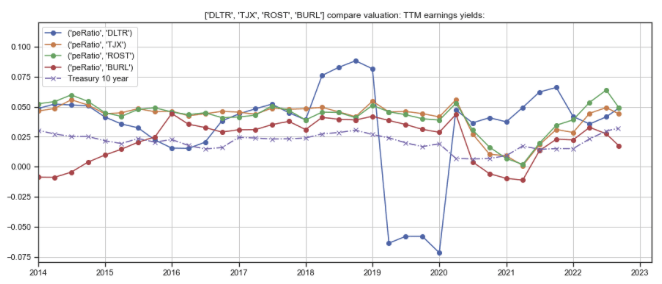
Concerns
(1) Continued downward revision of earnings?
I admittedly have not been as focused on quantifying cost pressures as I should have be, but the exogenous factors seem to be abating. Management has historically under-promised and over-delivered, but we are in times of extraordinary inflation. Will the other shoe drop?
(2) Little pricing power (discussed above) and minimal pricing inflation (of apparel make Ross vulnerable to continued inflationary pressures.
Summary
- Ross is a leading and well-run discount apparel retailer with the scale, efficiency, sophisticated buyers, and distribution that enable it to provide high quality apparel at low prices
- Ross has captured market share over the long term through organic sales growth, increasing store count, and from mom-and-pop competitors that lack the sophistication and financial stability to withstand sharp economic recessions.
- Sales are recovering from the COVID-19 pandemic as customers shift towards higher margin work apparel as they return to the office. However, rising freight, wage, and occupancy costs are pressuring margins. Furthermore, high food and fuel inflation is reducing consumers’ discretionary spending on apparel.
- There are signs that elevated freight costs and inflationary pressures are beginning to abate, which will put the company back on its long-term growth trajectory.
- At current valuations, Ross is not a “pound the table” buy, but this may be a good opportunity for long term-oriented investors to increase their positions.
Be the first to comment