

Aajan
3Q22 Quarterly Report
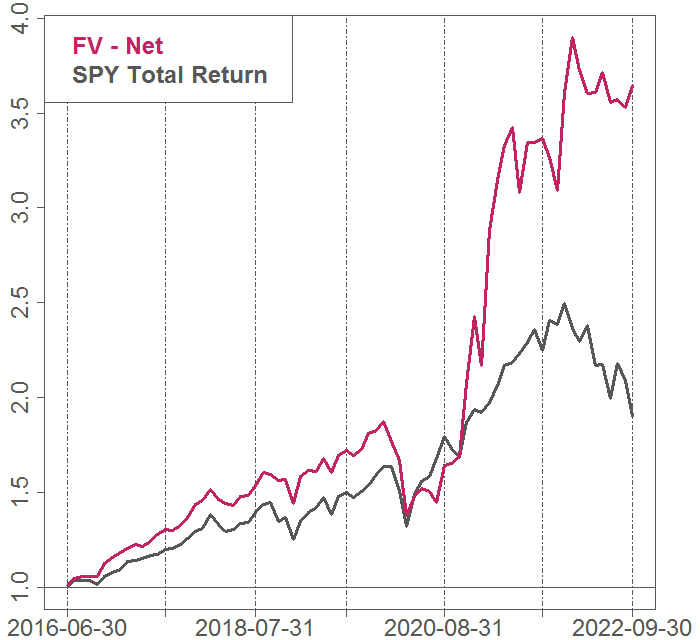
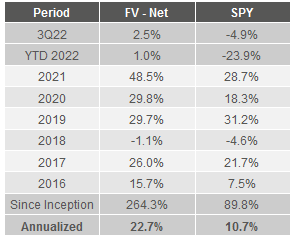
In Q3, Fundamental Value outperformed the market significantly, up 2.5% net of fees versus -4.9% for the S&P 500. On a YTD basis, this puts the strategy up 1.0% net versus the market at -23.9%. Since inception, FV has returned 22.7% net annually, outperforming the S&P by 12.0% a year.1
Market commentary
It’s been just over a year since we finished our “Everything Bubble” series with Part III: Apex of a Bubble in September 2021. We said that investors would find real returns to most asset classes to be severely disappointing — and likely negative — for many years to come. And we predicted an imminent top and a proximate cause:
We believe inflation is likely to be the catalyst that ultimately pops the everything bubble. If we are correct, eventually the Fed will have to reverse course, tightening policy and raising interest rates. When this happens, investors who have speculated in low or no-yielding assets like SPACs, high-flying growth stocks, and NFTs may find their portfolios permanently impaired.
We said in April that these “predictions had already largely come true,” yet “the main equity indices have been eerily resilient”:
Investors seem increasingly in denial of what is an unequivocally disastrous fact pattern for an equity market that is still trading near all-time high valuations. And despite all the bad news that has come in since September, the worst is yet to come… Investors are poised with their fingers over the sell button. This creates the conditions for a crash. Caveat emptor.
And we said in August that we did not believe the bottom for stocks was in:
First of all, we find it hard to believe that a bottom is in when some of the most speculative securities, like AMC, GameStop, and MicroStrategy, still trade at transparently irrational prices. Capitulation in these retail favorites is a likely prerequisite for a durable bottom… Second, we expect equities to be pressured by falling corporate profitability… Finally, we expect it will be harder to rein in rampant inflation than the Fed and the market currently believe.
For more details, we encourage you to check out those previous letters, because honestly, there’s not much we would add or change today. Despite the pervasive feeling of carnage in the markets, the S&P 500 continues to be eerily resilient.
Since we wrote “Apex of a Bubble,” core CPI has risen from 4.0% to 6.7% YoY, the highest inflation rate of our lifetimes. As the Fed rushes to catch up, the fed funds rate has shot up from effectively zero to nearly 4%, the fastest YoY change in over 40 years. The 10-year Treasury yield has soared from 1.3% to 4.1%.And, perhaps most crucially, real yields have skyrocketed. The 10-year Treasury Inflation-Protected Securities (TIPS) has soared by 2.6%, by far the largest year-over-year increase on record.
The yield last September was at -1%, an all-time low that — as we pointed out at the time — was obviously inducing unhinged speculation in markets in general, and in the most speculative “assets” such as meme stocks and cryptocurrencies in particular. The rise into positive territory has put a welcome damper on some of the most egregious speculative behavior.
Yet despite this dramatic tightening of financial conditions, the S&P is down less than -10% since last September. Economic pain has been limited thus far, and investors seem to believe it will continue to be limited.
However, there is no evidence to suggest that the Fed’s actions thus far have tamped down inflation. We believe much more economic pain is coming because it is likely that tightening still has a long way to run.
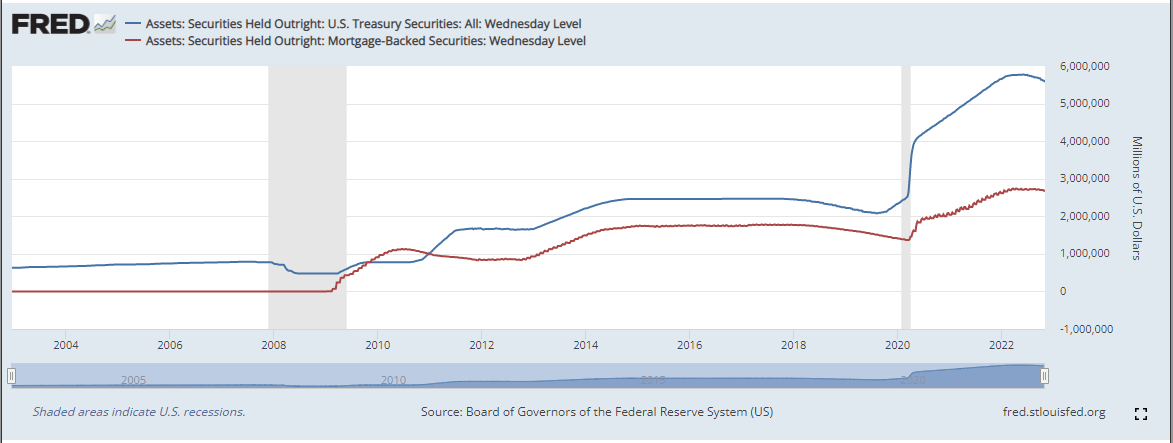
A Fed funds rate under 4% is not a sufficient brake on an overheated economy with core inflation running over 6% YoY and still rising. And while quantitative tightening has begun, the Fed’s balance sheet is engorged from over a decade of unprecedented asset purchases. The negligible decline thus far is barely visible on a chart.
While the 10-year TIPS yield no longer indicates irresponsibly loose financial conditions like it did at -1% last September, today’s 1.6% real yield is not particularly restrictive either. During the run-up to the financial crisis — a period in no way associated with tight conditions — the real yield averaged over 2%. Therefore real yields may well need to rise further to be restrictive enough to tamp down raging inflation.
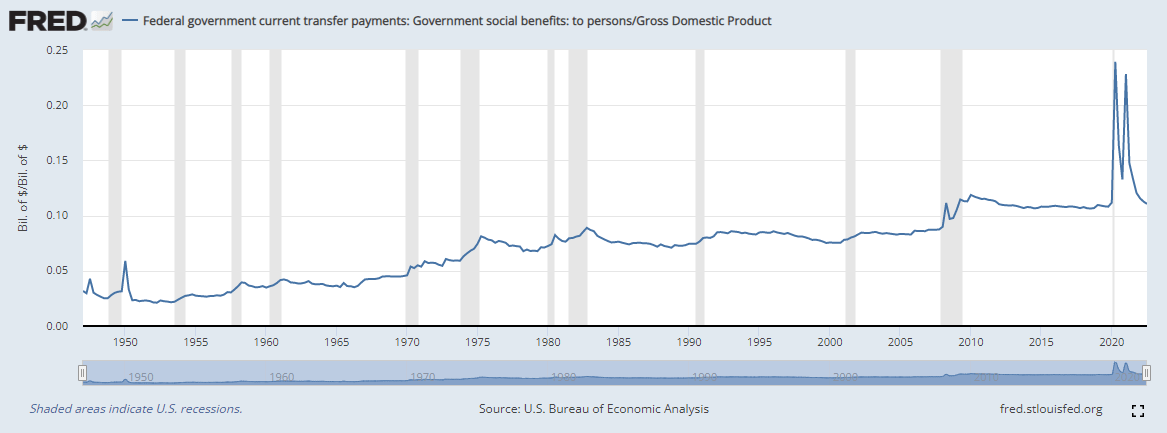
The consumer is still extremely strong. Unemployment remains near record lows. Fiscal stimulus is still unsustainably high: transfer payments as a percentage of GDP were higher in the third quarter than any other quarter since data begins in 1948, excepting the pandemic.
Social Security recipients will receive an 8.7% increase in payments next year thanks to the highest cost-of-living adjustment in 40 years.
These trends are unsustainable. Economic pain will be necessary to reduce demand. However, the Fed still expects inflation to subside while real GDP growth remains healthy and unemployment remains under 4.5%. Last quarter, we called this belief “comically optimistic.”
Earnings estimates also seem unrealistic to us. Corporate earnings have already been weak in 2022. For the third quarter, S&P 500 earnings excluding the energy sector are currently coming in at -5.1% YoY, the second straight quarter of declines. And these declines are even more dire when adjusted for raging inflation.
Yet according to Bloomberg, S&P earnings estimates for 2023 are 15% higher than 2021 earnings. This expected annual earnings growth of 7.2% from 2021 to 2023 is above the average historical earnings growth rate of 6.5%, totally incompatible with a weakening economic environment, higher interest expense, and inflationary pressure on margins.
What accounts for the dramatic disconnect between economic reality and stock prices?
We are in our late 30s. In our entire lifetime, when there’s been a recession or falling stock market, the Fed has always stepped in to ease financial conditions and support the market. This virtuous cycle has induced a reflexive buy-the-dip mentality among investors — and rightfully so, as investors were rewarded for taking risk every time the market fell.
Now, for the first time in our lives, that dynamic is reversed. Until inflation is broken, the Fed will need to crush any signs of market optimism that threaten to undo the financial tightening it is trying to cause. Rather than easing at the first sign of economic weakness, the Fed will be tightening at the first sign of economic strength.
We already saw this over the summer, when equities soared nearly 20% and the 10-year Treasury yield plummeted nearly 1%. At the annual Jackson Hole speech in August, Fed chair Jerome Powell poured cold water on the rally with a short and sharp speech that immediately tempered optimism that a pivot to lower interest rates was around the corner.
Forty years of the infamous “Fed put” has left a legacy of moral hazard. Investors assume their risk is limited because they believe the Fed has provided them free insurance: the Fed will always step in to bail out investors should the market decline steeply, cutting rates to juice the economy, corporate earnings and stock prices.
But the Fed put is now a Fed call: rather than a limit to how much investors can lose, there is a limit to how much they can make.
We caution investors that the Pavlovian response to buy the dip will not necessarily lead to the same rewards as it has in the past. Unfortunately, we suspect this lesson, acquired over careers and lifetimes, will be hard to unlearn for most investors. A more appropriate maxim for the foreseeable future might be “sell the rally” instead of “buy the dip.”
Despite significant headwinds, Bireme clients have weathered the storm well thus far, and we believe they are positioned to continue to do so. There are still many transparently overvalued securities in the marketplace, and so we expect our short book to continue to be a large positive contributor. Furthermore, we expect our long book to fare much better than the market in the short term and appreciate significantly in the medium term.
It’s not too late to get on board. Please reach out.
Portfolio commentary
The best performing stock in the portfolio during the third quarter was RCI Hospitality (RICK), a nightclub and restaurant company, which gained 35%. Even after this strong performance, RICK trades at only 14x earnings — a reasonable valuation for a company which we expect will continue to grow rapidly in the years ahead. The nightclub business is performing extremely well, with T12 revenues at June quarter-end up 72% YoY, benefiting from a sizable acquisition completed in late 2021. T12 operating income in the segment was $67m, up 81% vs last year and 35% above the peak level pre-COVID.
The restaurant segment, which consists of the military-themed “Bombshells” restaurants, did $60m of sales and $12m of operating income over the past year. The concept has significant growth potential, with only eleven locations open and four more already under development.
Netflix (NFLX) also had a great quarter, with shares appreciating more than 30%. The stock had simply gotten too cheap during Q2, with shares trading for about 16x trailing earnings. This was by far the lowest multiple on the stock in a decade. This below-market valuation was irrational for the world’s dominant streaming platform.
Despite being near saturation in some markets, Netflix continues to grow. After two consecutive small declines in subscribers that spooked investors, Q3 brought growth of 2.4m subs and a guide of more than 4m in Q4. Excluding currency impacts, revenue grew 13% in the third quarter, driven by revenue per member growth of about 8%. While dollar strength remains a headwind, we see several large positives for Netflix going forward.
- Further price increases. We remain confident that Netflix, at least in the US, is under-monetized relative to its usage. We think the company will continue to grow revenue per user in the ad-free tier.
- Rightsizing of expenses. Netflix, and the streaming industry more generally, spent money like drunken sailors for the past five years. For Netflix, this meant billions in cash outflows; for their peers, it meant billions in operating losses. But this era is ending, with Netflix saying in their Q2 letter that they’ve “adjusted their cost structure for the current rate of revenue growth.” Competitors are cutting expenses as well.
- Advertising rollout. Netflix recently announced the rollout of an ad-supported tier ($6.99 in the US) starting in November of this year. As we put it in Q1: Advertising is a large portion of Hulu’s business, with eMarketer estimating that Hulu generated $3.1b in advertising revenue in 2021. The advertising business at Netflix has the potential to be multiples of this size as Netflix averages more than twice Hulu’s share of total US TV time. We suspect that given their technical chops, ability to recruit talent, and the TAM of the opportunity, Netflix will be able to build out a world-class programmatic advertising business in short order that will bring in substantial additional subscribers and revenue. At long last, Netflix will be directly compensated — at least in the ad-supported tier — for the gigantic amount of time its subscribers spend using the service, which amounts to 7-8% of total TV viewing in the US and UK. We expect the ad-supported tier to generate tens of millions of new subscribers over the next few years and drive billions of profits.
With its best-in-class management, infrastructure, scale and content, we believe that Netflix will continue growing revenue and margins for the foreseeable future.
We made a few material trades in the quarter. First, we sold our stake in Tencent Music Entertainment (TME), which we wrote about in our “CIO Corner” newsletter.
We sold our stake primarily because of the massive underperformance of TME’s “Social Entertainment” segment. That portion of the business, which operates primarily through a group karaoke app called WeSing, lost 27% of its users during the year that we owned the stock. This seems to have been caused primarily by competition from other streaming platforms, such as TikTok (Douyin in China), a risk which we underestimated. Since this segment produces essentially all of TME’s profits, the loss of users had a dramatic impact on our valuation of the business.
Secondarily, we had expected growth of Average Revenue Per User (ARPU) in their music subscription business, in which TME has 70% share in China. Despite this near monopoly, competition from upstart NetEase (NTES) Cloud Music has been fierce. Over the last year, NetEase gained material market share by offering discounts of 15-20% off the standard 8 RMB monthly price. TME has been forced to respond in kind, and TME’s ARPU fell 11% YoY in the second quarter.
With users falling dramatically in Social Entertainment and ARPU growth in question in Online Music, there was simply nothing left to support our original bullish stance on the stock. Even the fall from $6 at the end of 2021 to $4 per share in July was not enough to compensate for this change in our assessed value, so we sold our position.
We also added materially to our Twitter (TWTR) position during Q3, as we became more confident in the company’s legal case against Elon Musk. We updated subscribers on our thoughts in early September with a long blog post.
Positive data piled up throughout the third quarter. For example:
- The Chancellor’s rulings. The presiding judge went out of her way on several occasions to show disdain for Musk’s arguments in her pre-trial rulings. Her remark during one hearing that “damages would not suffice” as a remedy spoke volumes, as it implied that she would force Musk to buy the company if he lost at trial.
- An utter lack of supporting evidence for Musk’s core bot misrepresentation claim. In fact, during discovery it was revealed that Musk’s own experts estimated that roughly 5% of monetizable daily active users were bots — the same number used by Twitter — directly contradicting the claims Musk made in his countersuit.
- Signs of evidence destruction by Musk. During discovery it was revealed that Musk used disappearing messages on the messaging app Signal to discuss the Twitter deal, contradicting his earlier statements.
We followed these developments closely, and our increasing confidence eventually led us to take Twitter to a 20% position at cost. This was the largest bet we have ever made.
Meanwhile, time counted down until Musk’s deposition when he’d finally be forced to answer numerous difficult questions about the Twitter deal. In his career, Musk has gotten away with making many claims that, interpreted charitably, were hopelessly optimistic — and interpreted uncharitably, were self-serving lies.
But a deposition is not the place for such behavior. Likely looking to avoid answering questions for which he’d have no good answer, first Musk delayed, feigning COVID-related concerns to put off the first deposition date. Then, the day before the rescheduled deposition, he sent a letter to the Twitter board. In this letter, he implicitly capitulated on all of his purported reasons to terminate the deal, telling the company that he was prepared to close in a very short period of time. He then pitched this timeline to Chancellor McCormick, who agreed to stay the trial until October 28th.
As most people know by now, the deal closed on original terms late on October 27th, and Musk is now “Chief Twit.” Our clients enjoyed a nearly 50% return from our average purchase price of ~$37 in less than six months. We look forward to reinvesting Elon’s money into our other portfolio holdings.
We are grateful for your business and your trust, and a special thank you to those who have referred friends and family. There is no greater compliment.
Bireme Capital
| 1 Net calculations assume a 1.75% management fee. Fee structures and returns vary between clients. FV inception was 6/6/2016. |
|
The performance in the charts is the performance of the securities in all Bireme accounts (“Bireme Master Account”) and the strategies that make up the account holdings from inception through 9/30/2022. The performance in the tables is the performance from inception and from 7/1/2022 through 9/30/2022. Past performance is not indicative of future results. It is not possible to invest directly in an index. Index performance does not reflect charges and expenses and is not based on actual advisory client assets. Index performance does include the reinvestment of dividends and other distributions. The performance in the Bireme Master Account is shown as net of 1.75% advisory fees. Some clients may receive services at a lower advisory fee with a performance fee based on the gains in the account. Returns are shown net of fees at the account level, and gross of fees at the individual strategy level. For current performance information, please contact us at (813) 603-2615. Sources: Bloomberg Finance LP, Interactive Brokers LLC, S&P Compustat, Bireme Capital LLC. |
Editor’s Note: The summary bullets for this article were chosen by Seeking Alpha editors.
Be the first to comment