

pkline
Thesis
Lumen Technologies (NYSE:LUMN) currently provides a dividend yield of 10.22%. To say such a yield is attractive is a major understatement. Yields from the overall market (about 1.5%) or treasury bonds (about 3%) are simply not comparable here. And even compared to the telecom sector, a sector famous for its generous dividend, a 10%+ yield still easily stands out. The median dividend yield from the entire sector is 3.18% currently, which is only about 1/3 of what LUMN provides. And as you can see from the following chart, compared to the dividend yield of 6.2% from Verizon (NYSE:VZ), the blue-chip stock in the sector, LUMN’s dividend yield is 1.6x higher. By the way, for readers who are not familiar with LUMN, it is formerly known as CenturyLink. And it is currently one of the largest telephone companies in the U.S. It provides broadband, voice, and wireless services, hence directly competing with VZ (and AT&T (T) too).
Even compared to its own historical track record, its current dividend yield also stands out. As you can see below, historically it has been yielding an average of 8.94% over the past decade. Therefore, its current yield of 10.22% yield is almost 15% above its historical average.
All told, I’m guessing a lot of potential investors are intrigued and at the same time somewhat concerned because of all of the above seems a bit too good to be true. After all, in investing (or life in general), when things look too good to be true, usually, they are.
And such concern leads to the thesis for today. In the remainder of this article, you will see that there are indeed caveats hidden behind the 10%+ yield. These caveats include the misleading nature of the common payout ratios, LUMN’s much higher leveraged financial positions, and its structural underinvestment and hence lack of growth prospects. And as usual, these issues are best illustrated through comparison and contrast. And I will use VZ as the target.
Before diving in, although the article is focused on LUMN through a comparison against VZ, I hope the method and results are helpful for readers to sniff out issues underlying other high-yielding stocks too.
Source: Seeking Alpha
Why is past performance likely to continue?
Let’s first start with a historical perspective, as shown in the next chart. The chart compares the price returns and total returns in the past 10 years from LUMN and VZ. A few key observations as you can clearly see from the data. First, LUMN lagged VZ miserably (and to make it worse, VZ itself lagged the overall market miserably). VZ delivered a negative 6% of price return, while the overall market went through a strong bull run and delivered about 175% price appreciation. LUMN suffered a price loss of 76%, both lagging VZ and the overall market by an enormous margin. Second, the dividends played a large role in these telecom stocks. As you can see from the bottom panel, when dividends are adjusted for, VZ returned a positive 47%, still nowhere near the overall market, but healthy enough for most income-oriented investors. In contrast, LUMN’s return remains in the red, despite its much higher dividends.
Source: Seeking Alpha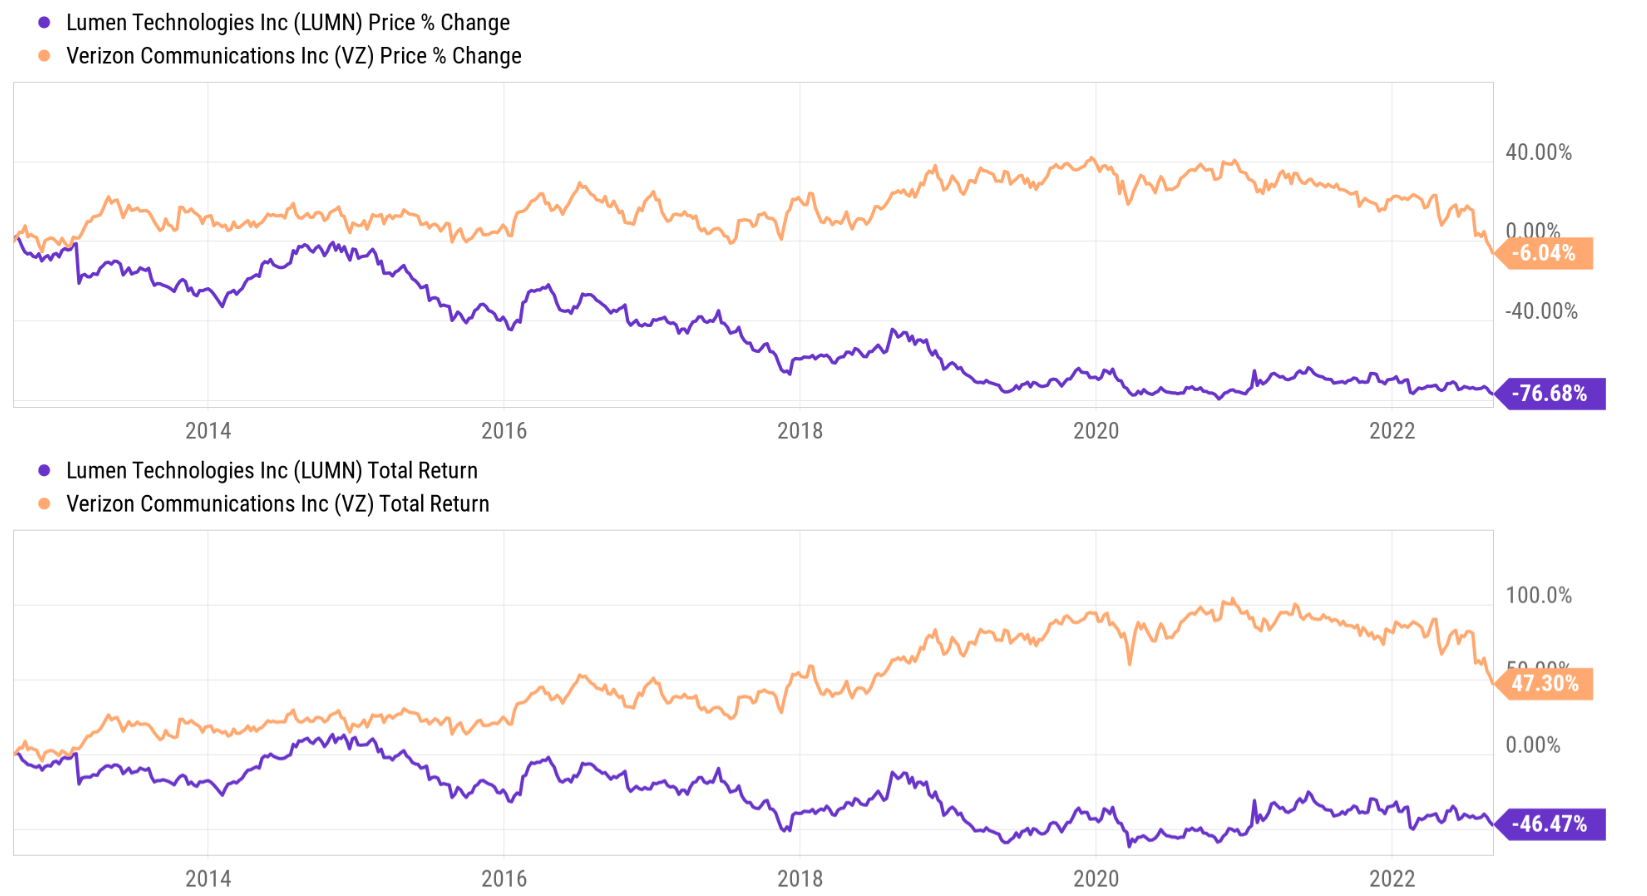
On top of lagging performance, LUMN has also suffered higher volatility risks too as you can see from the next chart. In terms of standard deviation, LUMN’s volatility has been on average 39% in the past 3 years, more than 2x higher than VZ’s 16.2%. In the past 5 years, the picture does not change too much. LUMN’s volatility has been on average 36%, still more than 2x higher than VZ’s 16.5%.
Going forward, I anticipate both the lower performance and higher risks to continue due to LUMN’s higher leverage and underinvestment, as elaborated on next.
Source: Portfolio Visualizer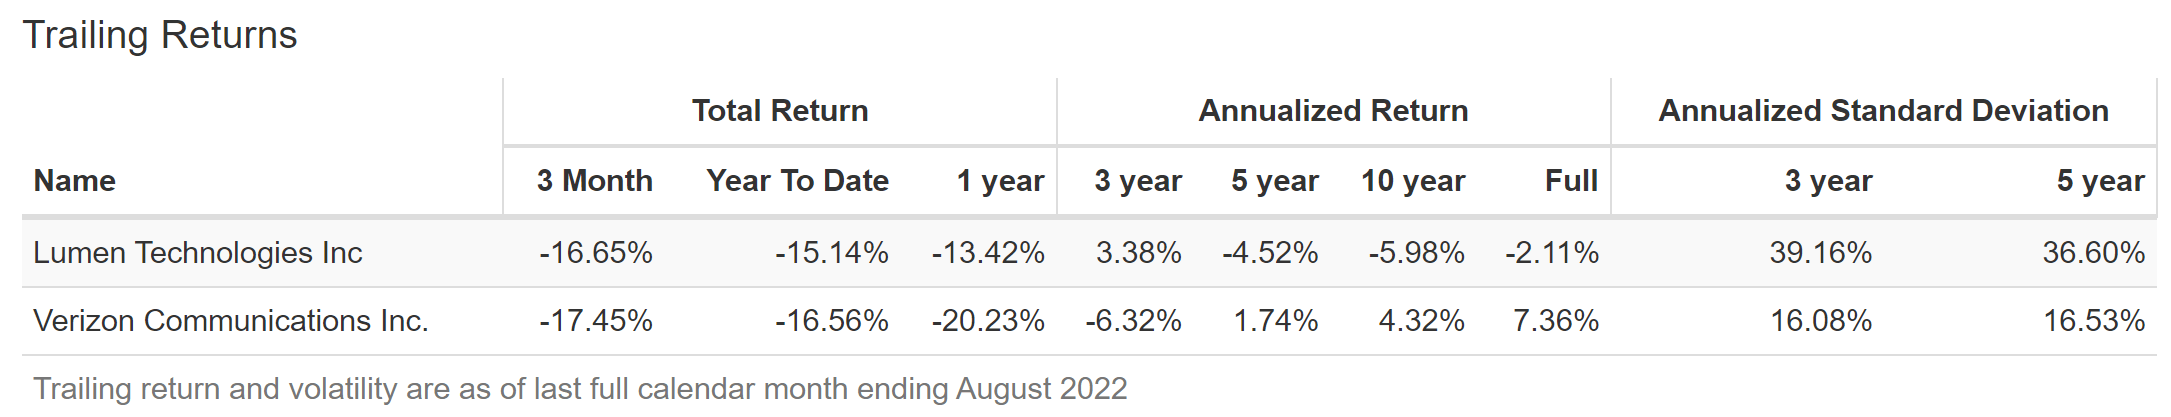
The misleading payout ratios
Before I examine the above issues in more detail, let me first point out the limitations of the common payout ratios. I am sure that all dividend investors are familiar with the earnings and cash payout ratios and these ratios are the first things that we check. However, these ratios are often misleading as in the case of LUMN.
The next chart shows LUMN and VZ’s dividend payout ratios in terms of earnings (top panel) and also cash flow (bottom panel). As can be seen, their earnings payout ratios followed a very similar trend and are essentially identical currently. LUMN’s current payout ratio is 52.3% and VZ’s is 51.1%. In terms of cash payout ratios, the picture is overall similar and shows the same trend. LUMN’s long-term average cash payout is 66%, again essentially identical to VZ’s 63.4%. And also by this metric, LUMN’s current ratio of 32% is safely below its long-term mean and also far below VZ’s 105%.
So, by these simple payout ratios, there is nothing alarming here. Actually, these payout ratios tend to suggest that LUMN’s dividends are safer than VZ’s. However, next, we will see how these simple payout ratios can be misguiding.
Source: Seeking Alpha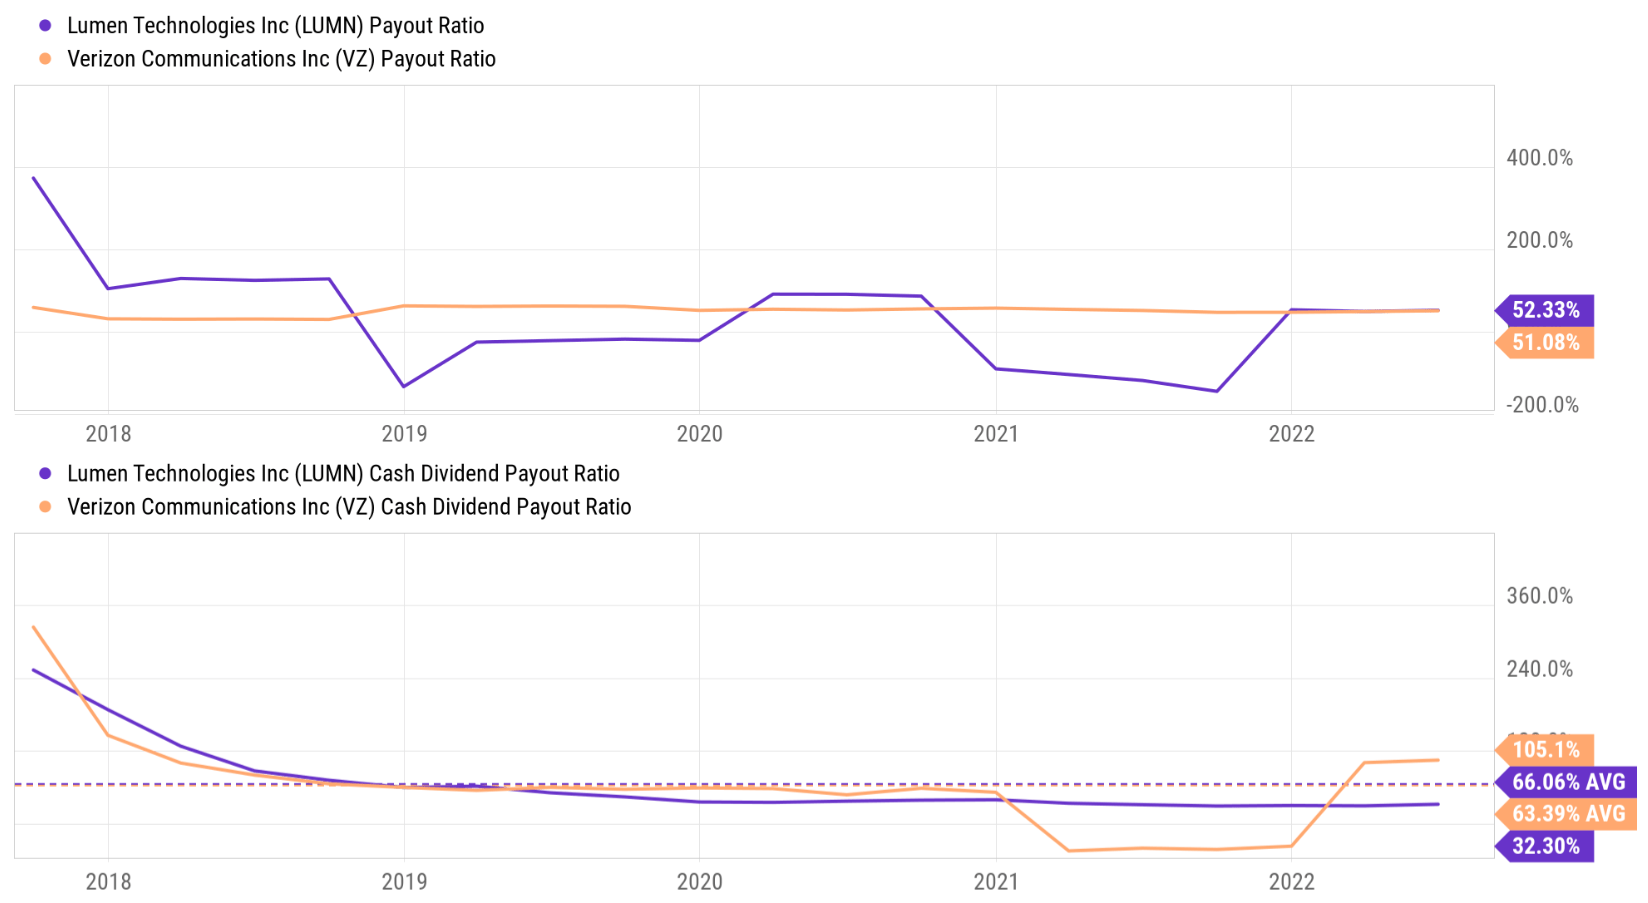
Closer look at dividend safety
A full discussion of the limitations of payout ratios and the holistic assessment of dividend safety can be found in our past articles. Such holistic assessment enjoy the advantage of being comprehensive. The downside is that it’s a bit involved and requires a more intimate understanding of various financial concepts (cash position, working capital, debt, et al). Here, I will just point out a few simple things that you can easily and quickly check.
The first thing to check beyond the simple payout ratios is the debt coverage as shown in the top panel below. LUMN’s interest coverage ratio has fluctuated from about a low of 1x to as high as 2.9x in the past decade, with an average of 1.25x. Its current value of 2.8x is far above its historical average. But in absolute terms, an average interest coverage of 1.25x is just too low (i.e., unsafe) in my view and so is its current 2.8x coverage, especially considering the interest rates uncertainties ahead. A coverage ratio of 1.25x means that almost all of its earnings (80% to be precise) will be used to service its debt alone (and a coverage ratio of 2.8x means more than 35%).
In contrast, VZ’s interest coverage ratios are much safer. It has fluctuated from about a low of 4x (compared to LUMN’s 1x) to as high as 12.3x in the past decade, with an average of 6.6x. Its current value of 10x is far above LUMN’s and also its own historical average. A coverage ratio of 10x means that only 10% of its earnings will be needed to service its debt. To provide another benchmark, the average debt coverage for the overall economy represented by the S&P 500 is about 6x on average. So LUMN’s financial strength is far weaker than the overall economy while VZ is far stronger.
The safety issue is further illustrated by the debt-to-equity ratio as shown in the bottom panel. LUMN’s ratio has been steadily climbing over the past decade from as low as 0.82x to a peak of 3.3x in 2022. The business deleveraged somewhat since then to the current level of 2.5x. But its current ratio is still substantially higher than its historical average. In contrast, VZ is much more conservatively leveraged. As seen below, its long-term debt-to-equity ratio is about 0.52x only, and its current ratio of 0.69x is less than 1/3 of LUMN’s.
Source: Seeking Alpha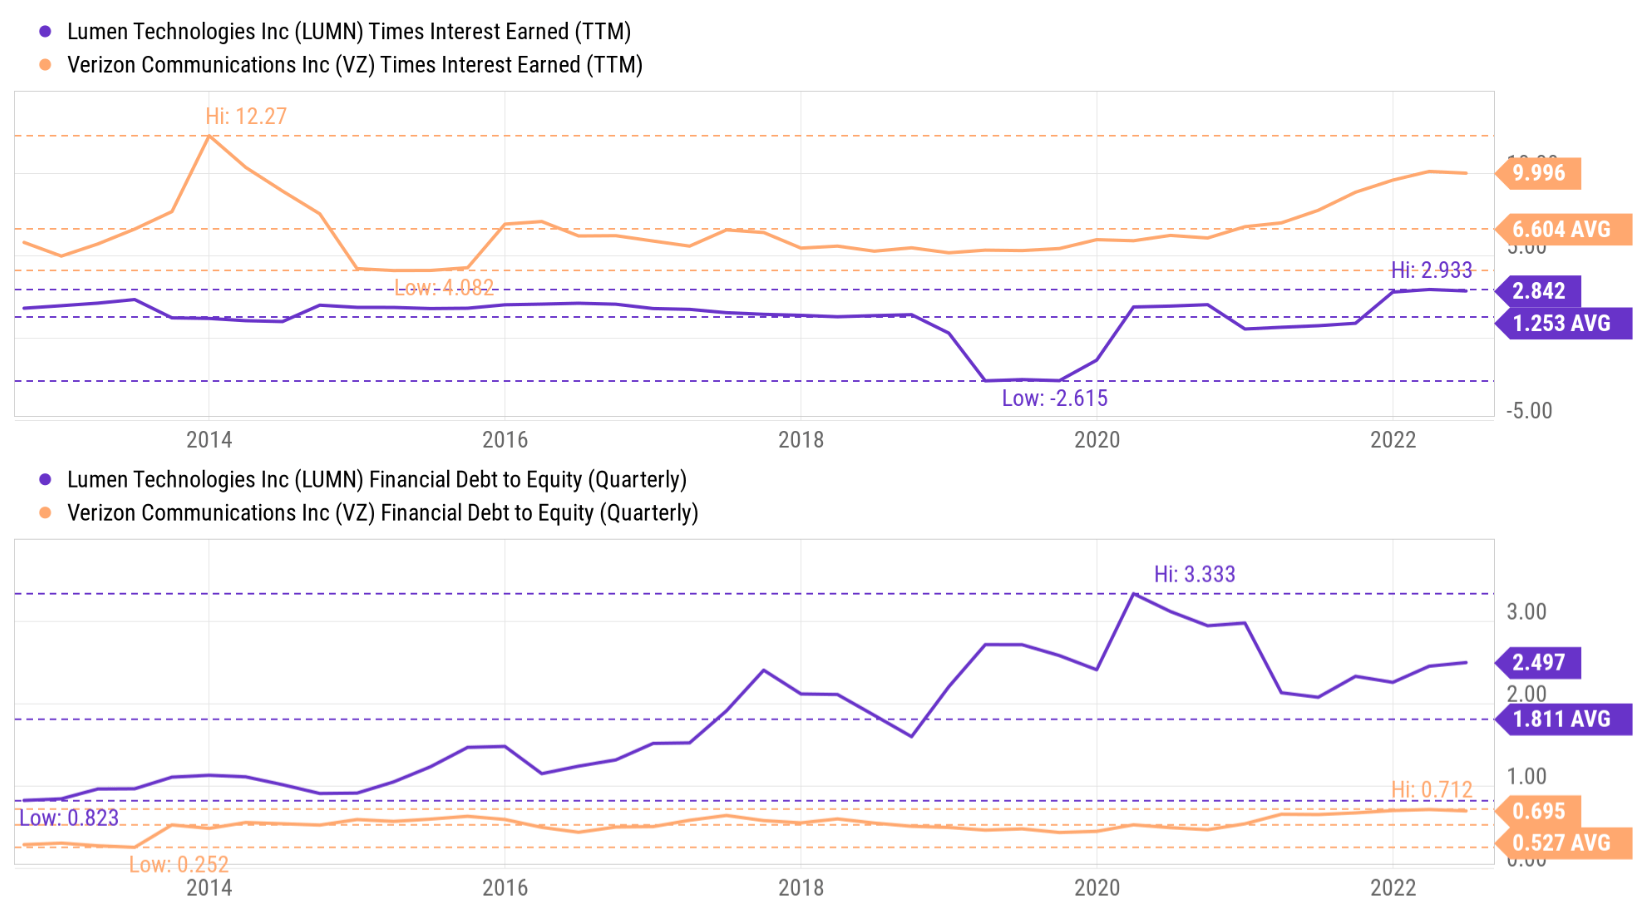
Growth rates and projected returns
Another simple and quick thing to check is the reinvestment rate. A big part of dividend investing involves dividend GROWTH at a rate that can at least combat inflation. Without a healthy and sustainable reinvestment rate, a business will stagnate.
The following chart provides a summary of LUMN and VZ’s capital expenditures and their total depreciation and amortization (“DA”). And as a quick and dirty approbation, I will use the DA to approximate the maintenance CAPEX. As seen, LUMN has been structurally underinvesting. Its average DA over the past few years since 2018 was about $1.1B, while its CAPEX investments have been on average $0.81B. Currently, its quarterly DA stands at $827M while its CAPEX investment is only $761, a gap of about $60M. In contrast, VZ has been systematically reinvesting in itself over the years. Its average DA has been $4.2B since 2018, and its average CAPEX investment has been $7.5B during this period. Therefore, again if we assume DA represents the maintenance CAPEX requirements, then VZ has been on average investing $3.3 billion as its growth CAPEX consistently over the past few years.
Source: Seeking Alpha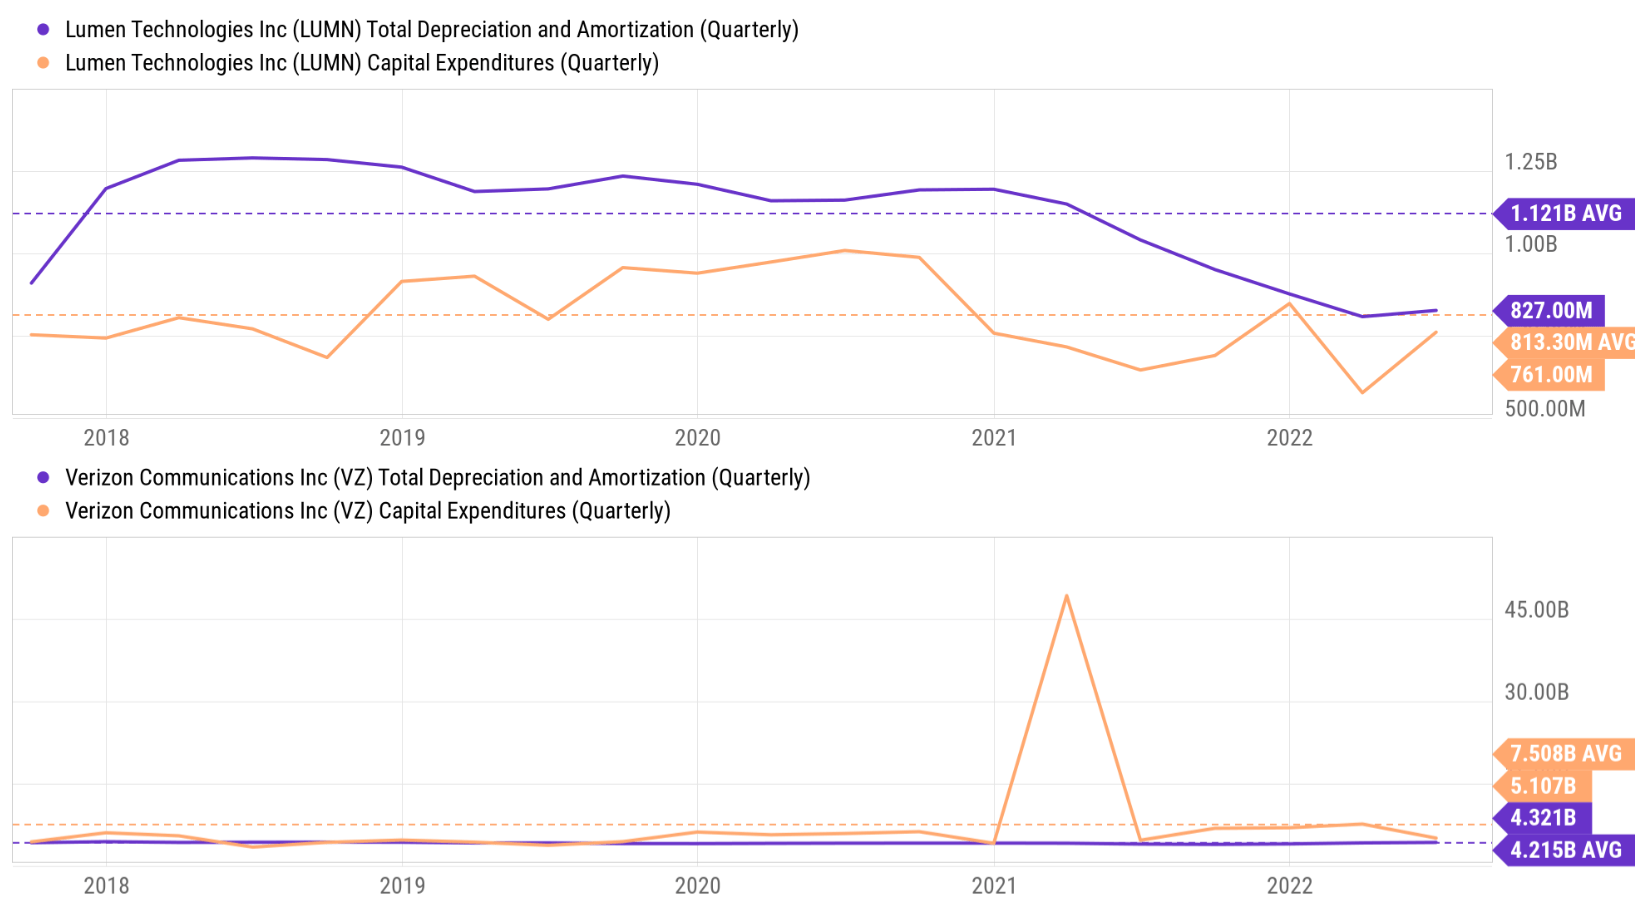
In the long term, the growth rate is simply the product of ROCE (return on capital employed) and reinvestment rate. For VZ, its reinvestment rates are about 10% based on my analysis, and its ROCE is about 30%. As a result, its long-term growth rate would be about 3% (10% reinvestment rate x 30% ROCE = 3% growth rate). And the projected returns in the next 3~5 years as summarized in the following waterfall chart. This projection assumes the following return drivers:
- again, a 3% organic growth rate.
- 1% share repurchases
- The dividend yield remains at the current 6% level
- A valuation reversion to the mean (from the current 7.6x PE to the historical mean of about 10x), contributing about 4% annual return in the next 3~5 years.
Based on the above assumptions, the annual return should be around 14% a year as shown below.
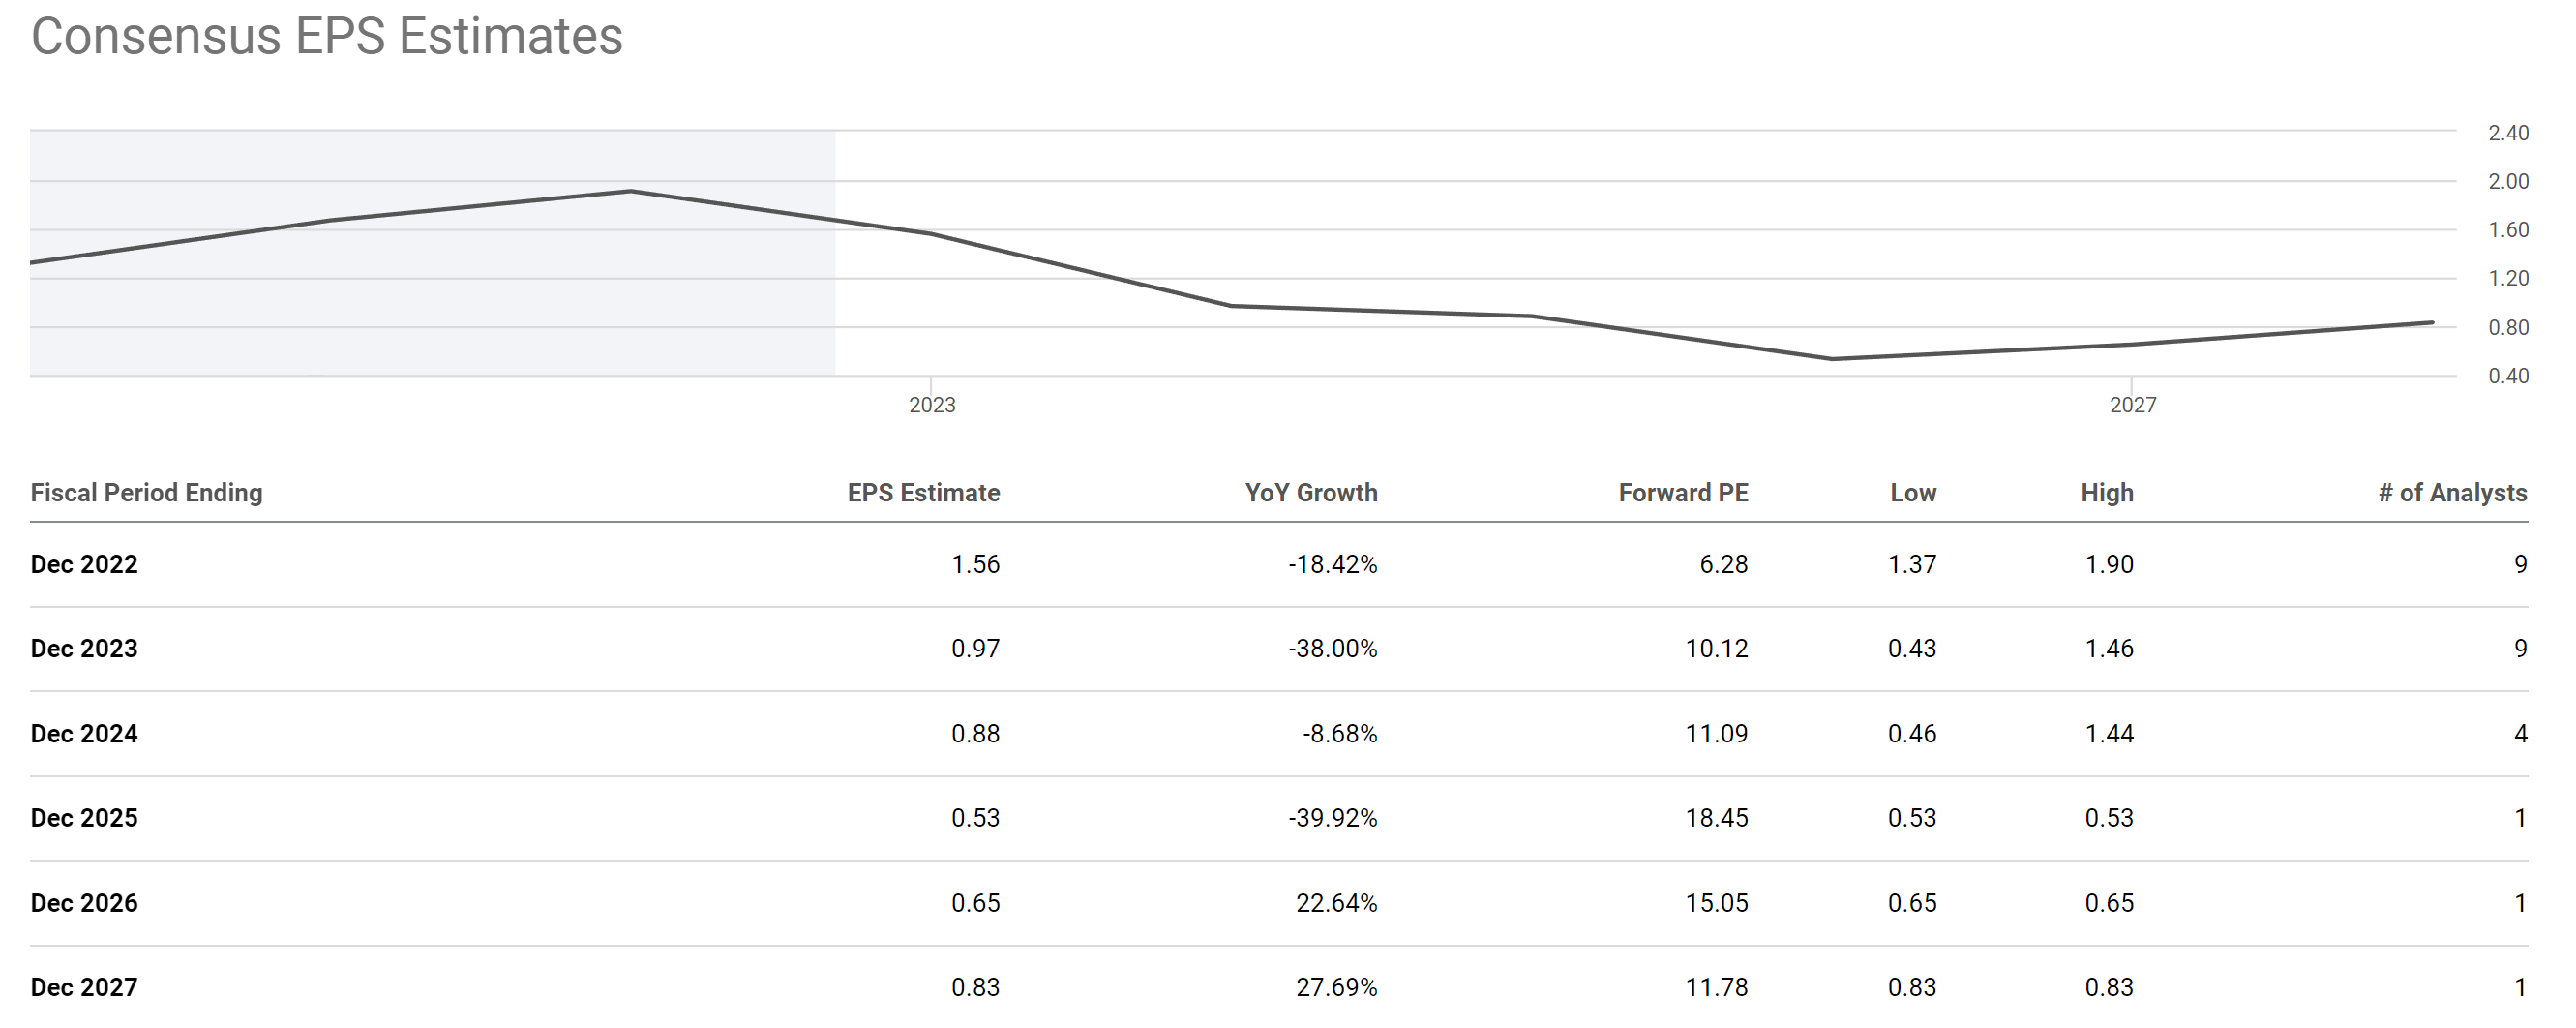
The picture for LUMN would be dramatically different. First, I do not expect meaningful growth due to the lack of growth CAPEX investment as aforementioned. Consensus estimates actually project a contraction of EPS (from the current level of $1.56 to $0.83 in 2027). Secondly, I do not expect valuation expansion either. When EPS stagnates or even contracts, the stock is very likely to be terminally cheap. Therefore, the best return scenario in my mind for LUMN is through its dividend only (i.e., 10%).
Source: Author based on Seeking Alpha data Source: Seeking Alpha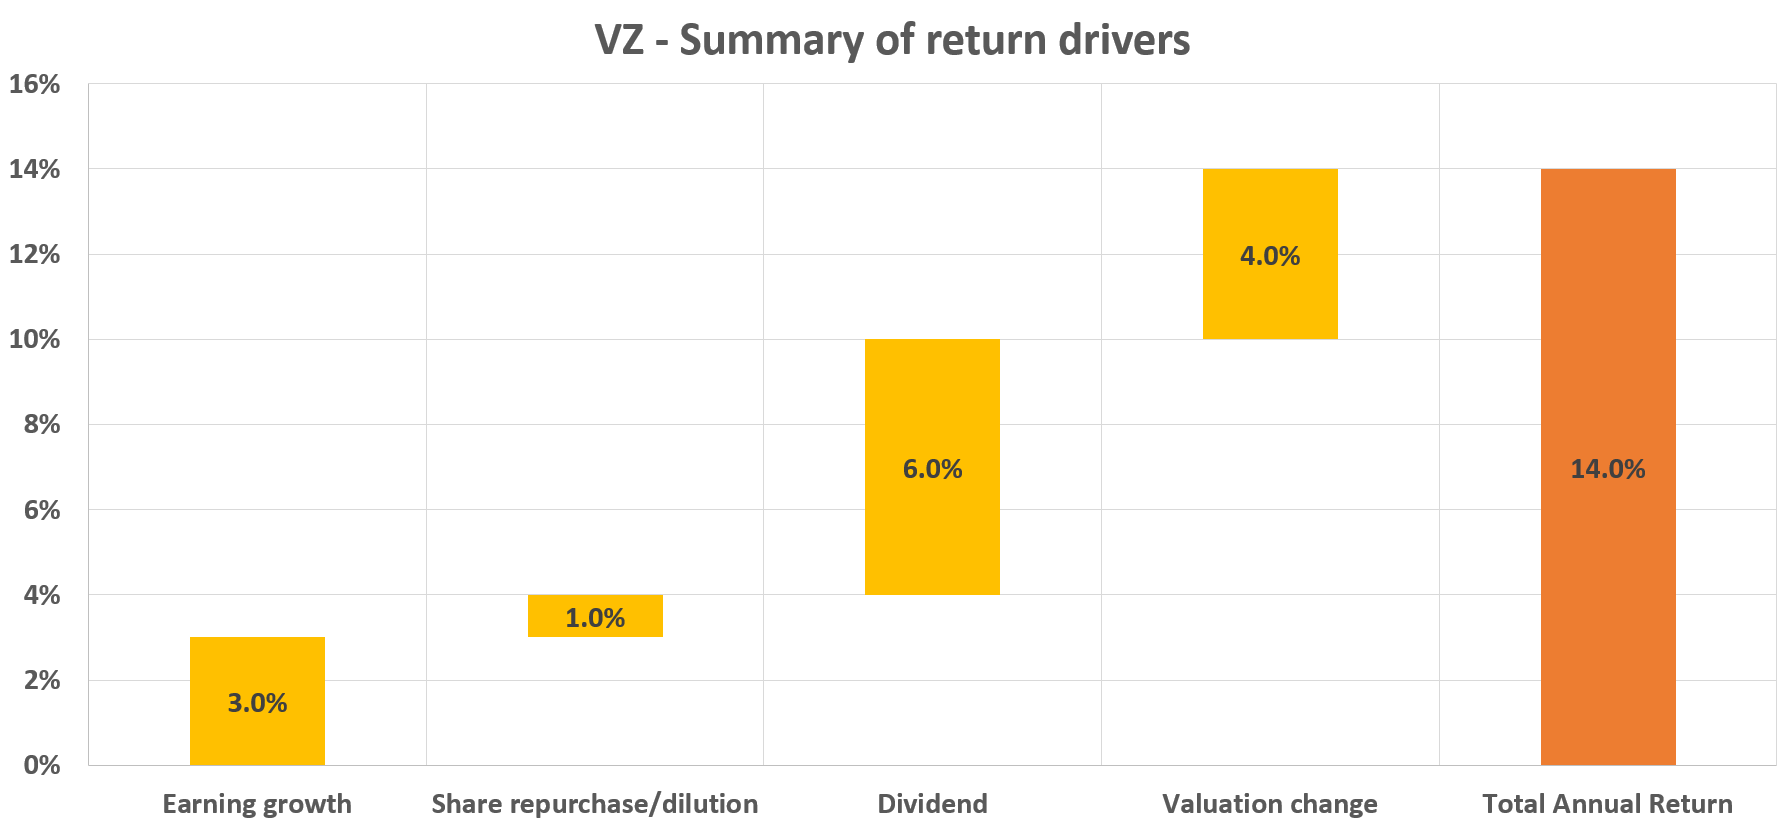
Final thoughts and risks
Our gut feeling tells us that when things look too good to be true, usually they are. And it is indeed the case with LUMN’s 10% dividend yield here. My view is that the 10% dividend yield is the cap of its potential return. And very likely, the actual return will be lower than 10%. Lack of growth in CAPEX investment is likely to cause stagnating or even contracting earnings, which could trigger dividend cuts and/or further valuation compression and cancel off part of the returns from dividend payouts.
For these reasons, if you do not need a current yield as high as 10%, I recommend you consider other options such as VZ. In my mind, VZ provides a much better package all around and a much more attractive risk/reward profile. Its current interest coverage of 10x alone, about 4 times higher than LUMN’s 2.5x, reduces the risks of dividend cuts and financial stress substantially. Furthermore, its more consistent reinvestment provides a much better prospect for profit growth and valuation expansion. All told, I am projecting its total annual return potential to be in the mid-teens (say around 14%), in contrast to LUMN’s 10% or below.
Finally, risks. Besides the underinvestment issues, LUMN also faces other issues such as a stretched balance sheet and low-interest coverage ratios. Although there are upside risks to the thesis here too, especially in the near term. There are some promising near-term growth catalysts afoot at LUMN. It has been investing in its Quantum Fiber network. Recently, the company introduced an 8-Gig offering. Depending on the responses from this rollout, the company could expand Quantum Fiber to more locations and compete more effectively with other high-speed providers such as VZ and AT&T.
Be the first to comment