

William_Potter
There are only two constants in the stock market: funds and fear. Every other factor is a variable than can have temporary effects, but only fear and funds are the “scaffolding” of the primary trend; lose the funds, lose the fear, and you lose the bull. In this piece, we show neither has been lost and the market is in a fractal trading range.
Fear
Market tops correlate with high levels of investor confidence, and market lows with high levels of fear. At the moment, we have as much fear as has ever existed in the market–the AAII survey shows that 80% of individual investors can’t even imagine the market being higher in 6-months time (table below).
ANG Traders, AAII, stockcharts.com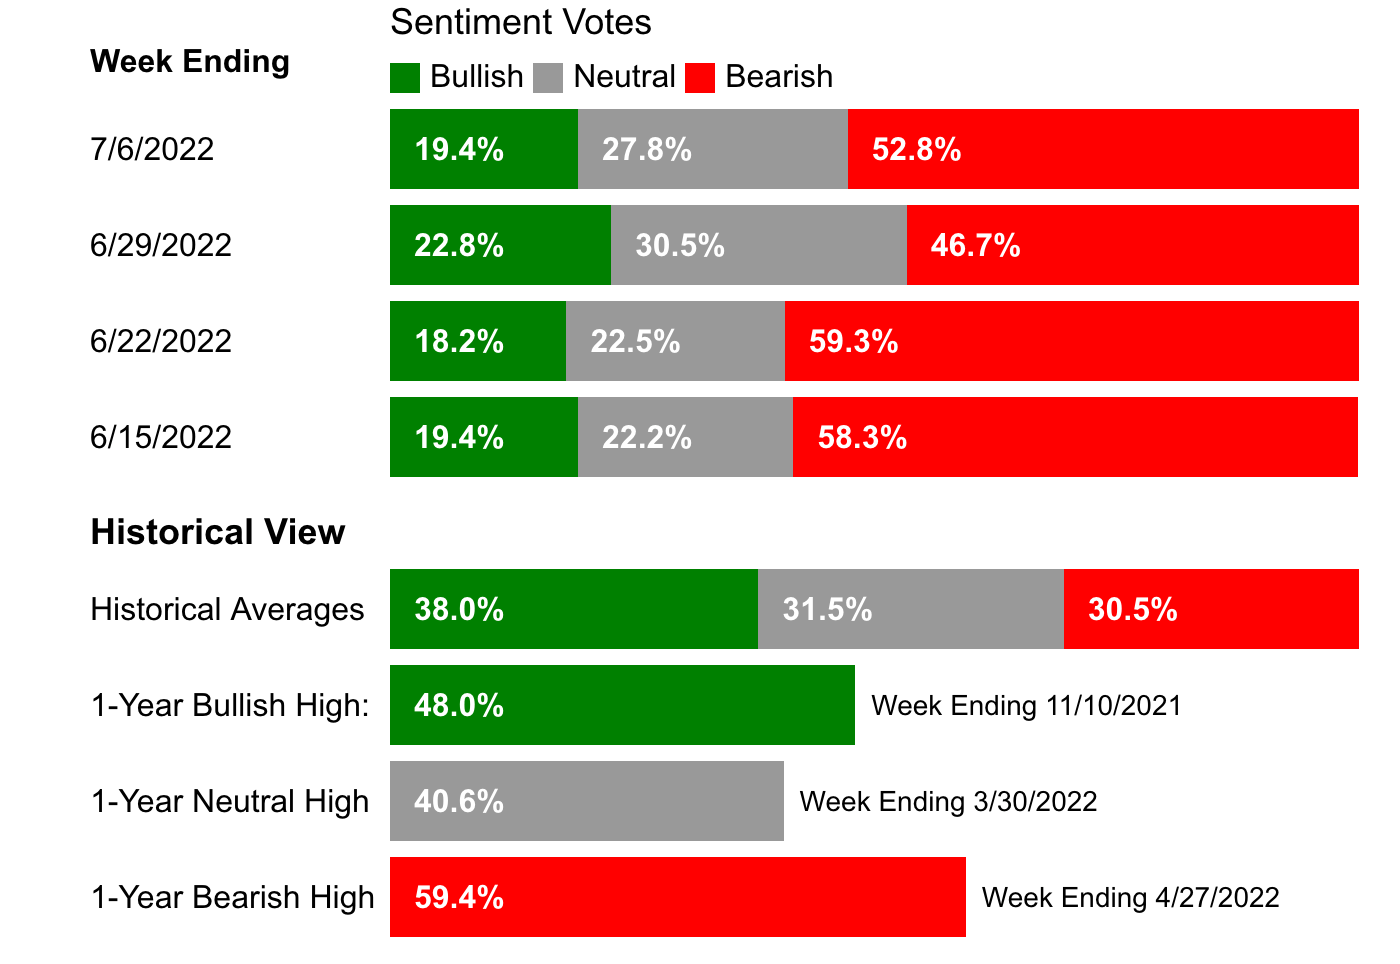
The bull-minus-bear differential is at near-historic levels of fear. We have not lost the fear.
ANG Traders, AAII, stockcharts.com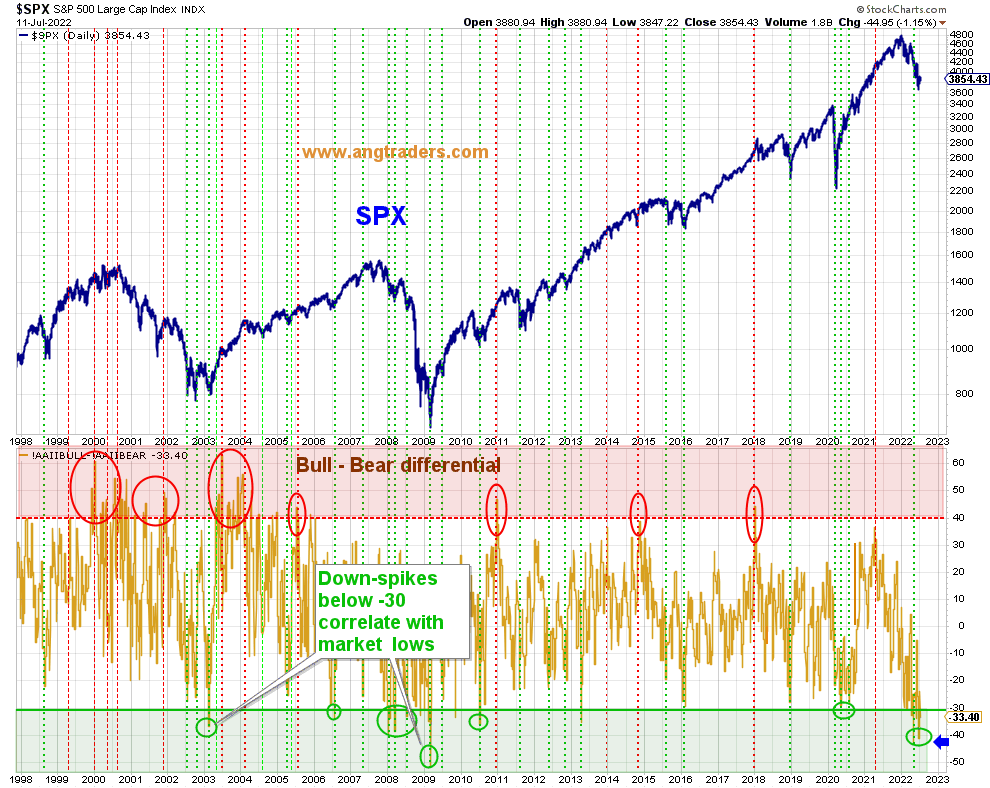
The AAII sentiment is a survey (which can be fickle), but investors show their true feelings by where they put their money; investors move into money market funds as they become fearful. Money market fund levels elevate when the stock market is near its lows (vertical lines in the chart below), and at the moment levels are at near-historic highs. You can almost taste the fear.
Money Market Funds (ANG Traders, stockcharts.com)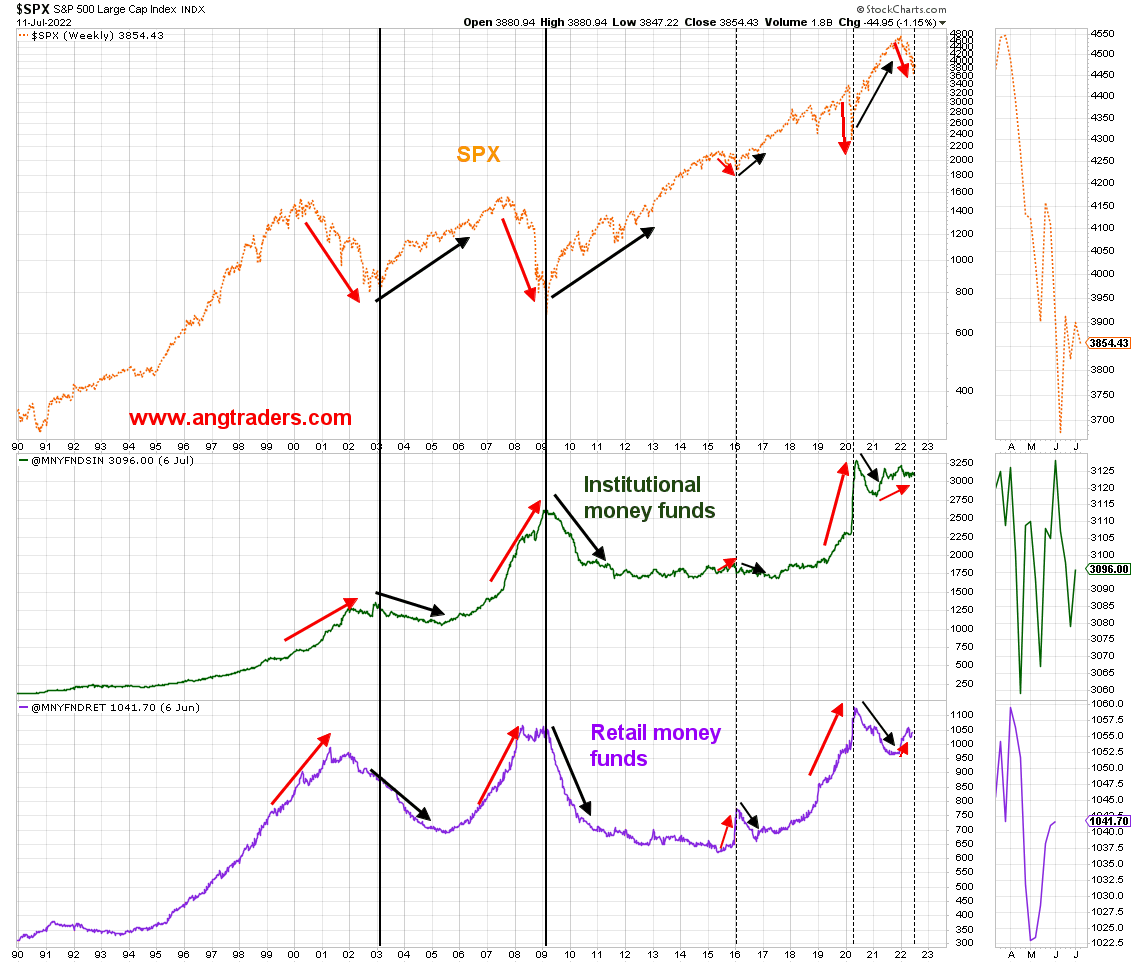
Wall Street analysts get scared and reduce targets when stocks are near their lows, not when prices are high. Fear is alive and thriving on Wall Street (chart below).
sentimentrader.com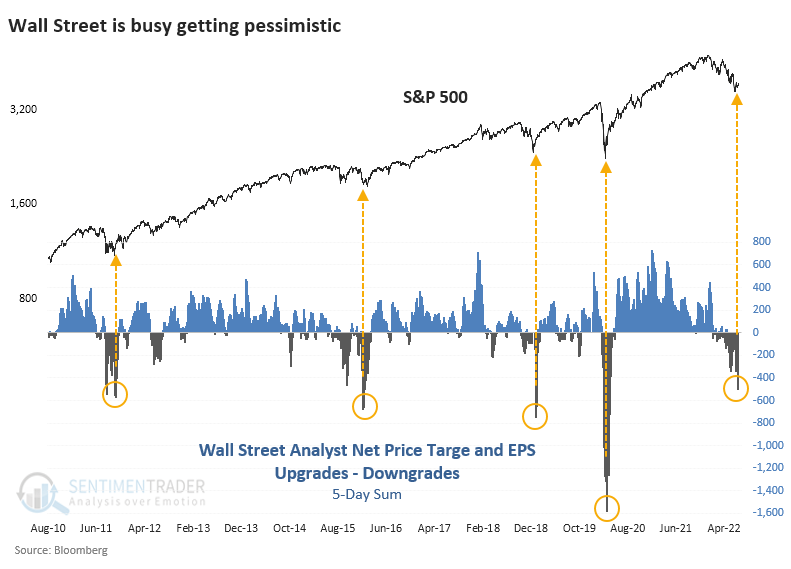
We have clearly not lost the fear.
Funds
It is important to understand where money comes from. There are two sources: Congressional spending laws, and chartered bank credit (loans). The latter is only “temporary” money because it must be paid back and cancelled, while the former is more powerful and potentially permanent money because it is created when the Treasury spends, but does not have to be taxed back and cancelled like bank credit (Note: Taxes are not required before spending. It is the other way around; the dollars that are used to pay taxes have to first be created by the spending…a dollar is a virtual entity created by the spending laws of Congress).
When it comes to the fund flows, less money has flowed into the economy this year than last year. Spending was $688B less in 2022 than 2021 (less money creation), and $712B more tax was collected (more money was taken back and cancelled) in 2022 than in 2021, but the net-transfer in H1 was still a positive $322B ; despite it being lower than in 2021, more money has still flowed into the economy than has been taxed back. The fund flows have not been lost.
The 20-day MA of the daily net-transfers correlates well with the SPX; an increasing net surplus (blue arrows) is supportive of the market, while lower net-transfers (pink arrows) weakens it. Since there are no major tax-takes until September, the average net-transfers should increase, and the SPX should follow (chart below).
ANG Traders, stockcharts.com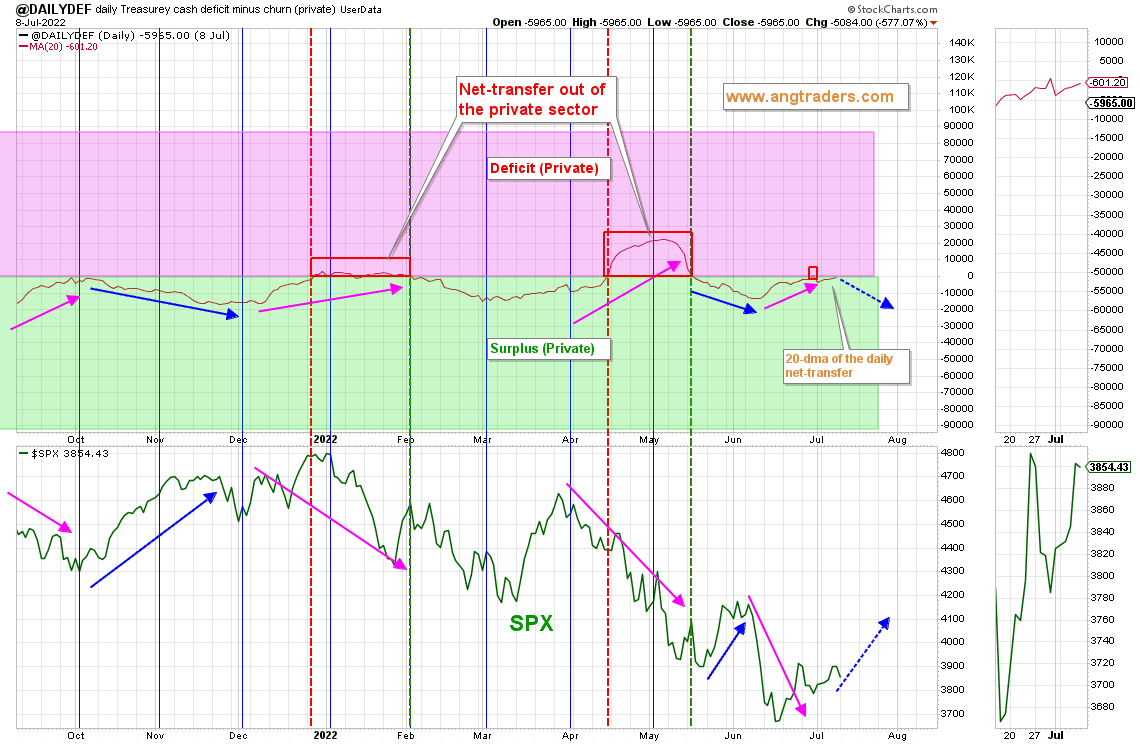
Corporate tax collection is a predictive proxy for corporate earnings, and since tax rates have not changed, higher 2022 Q2 corporate taxes demonstrate that corporations have booked higher incomes in Q2 than last year; 6% higher, $184B versus $173B (chart below).
Corporate Taxes (ANG Traders, stockcharts.com)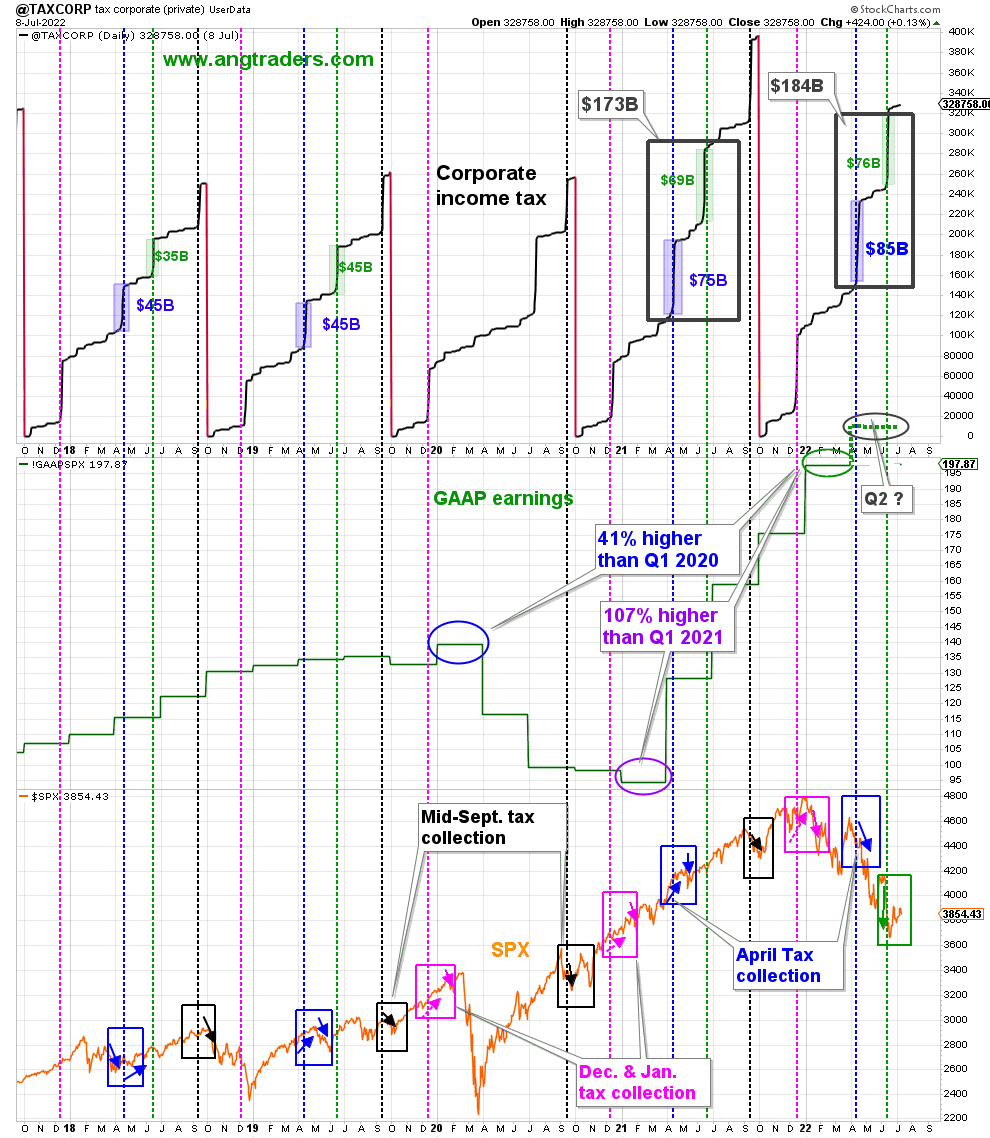
The market has priced in a major reduction in earnings, but the higher corporate taxes implies higher profits. As we enter earnings season, the market is providing a “buy-the-news” opportunity.
We have not lost the fear or the fund flows and, therefore, we have not lost the bull market as the primary trend. The market cycles through “super-bull” phases punctuated with range-bound periods (chart below). The latter last an average of a dozen-years or so, and the former last about 20-years. The current super-bull is only 8-years old and has risen a meager 210%; it is only middle-aged and has many more productive years of life ahead.
Trading-ranges (ANG Traders, stockcharts.com)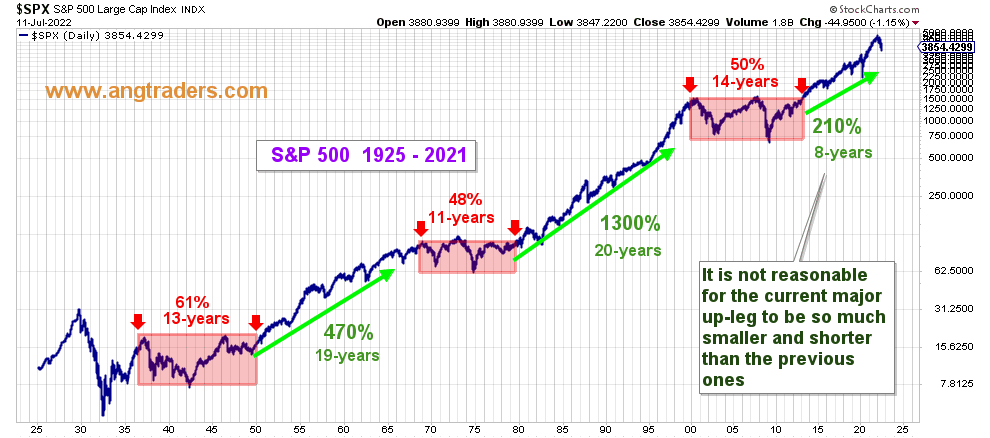
Within the super-bulls, there are fractal trading-ranges that last about one-year. We are currently in one of these range-bound periods which could last until the end of the year before we see new highs again, but we have not lost the primary trend (chart below).
ANG Traders, stockcharts.com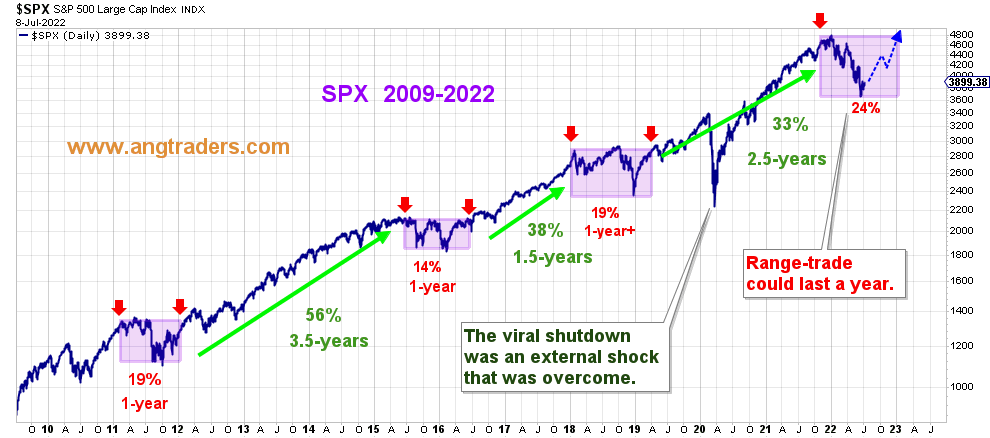
As long as the fund flows stay positive, and the fear is present, investors should start to layer into long positions in order to profit from the continuance of the super-bull. This can most easily be accomplished by purchasing broad spectrum ETFs such as SPY, QQQ, and IWM.
Be the first to comment