

jimfeng
The housing and durable goods sectors are the cyclical engine of economic growth, responsible for the booms and busts in the economic cycle.
When the housing market is hot, the whole economy gets a lift, and when the housing market starts to cool, the economy is dragged lower.
It is not hard to cause a boom in housing, a good old-fashioned debt bubble can do the trick, but the idea is to create sustainable growth.
In my view, the chart below is THE most important chart in macro.
The chart below can explain the surge in economic growth post-COVID, the destruction of supply chains, the rise in inflation, and now, finally, the peak in the economic cycle and what’s likely to be the source of the next recession.
This chart shows the percentage of GDP that comes from housing and durable goods or, more technically, residential fixed investment and durable goods consumption.
BEA, EPB Macro Research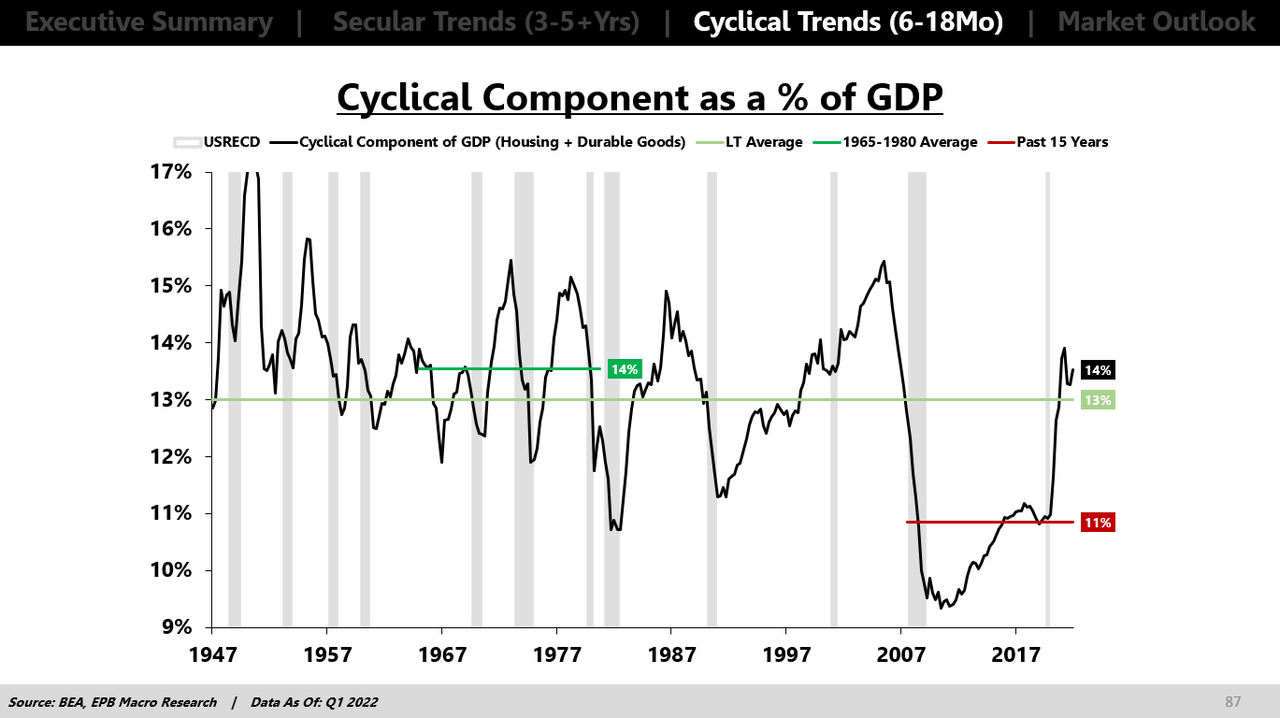
These two sectors, housing and durable goods, only make up anywhere from 10% to 15% of US GDP on average, but the fluctuations can virtually explain the entire economic cycle.
The housing sector and the durable goods sector, which includes things related to housing like home appliances, furniture, and other cyclical items like vehicles, are the high-powered, high-velocity sectors of economic growth.
Think about everything that goes into the construction of a new home and the purchase of durable goods. You need raw materials, manufacturing, distribution, supply chains, labor, and more. Furthermore, the housing and big-ticket durable goods sectors are very sensitive to changes in interest rates, so they are the first sectors to feel the impact of tighter monetary policy. This is why these two sectors are called leading economic indicators.
Over the last 70 years, in the United States, housing and durable goods comprised about 13% of total GDP on average. These two sectors are highly cyclical or boom-bust, so during an economic expansion the percentage rises, and during a recession or a bust, the percentage falls.
In the 1970s, during the great inflation, we also had an explosion in the relative share of the population that was aged 25-54. A total boom.
BLS, Census Bureau, EPB Macro Research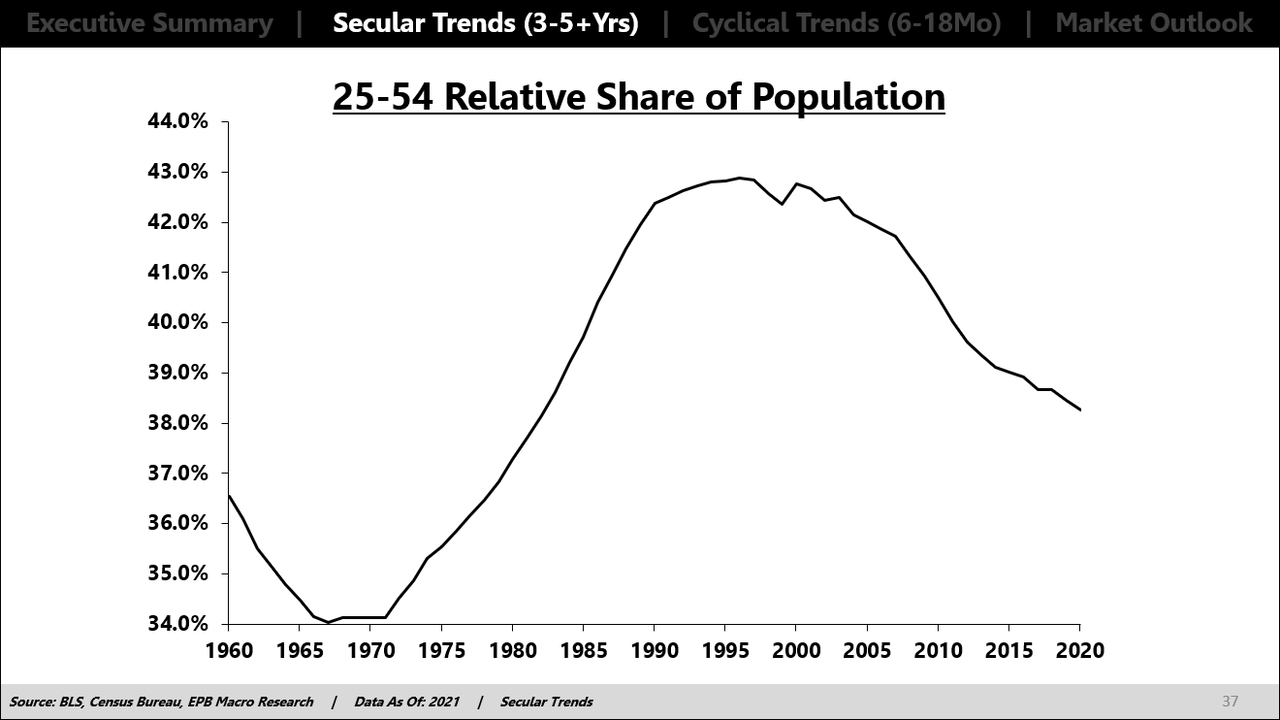
This meant that there was enormous demand for housing, vehicles, and other goods. Organic demand. The share of housing and durable goods averaged 14% in the 15 years from 1965 to 1980.
BEA, EPB Macro Research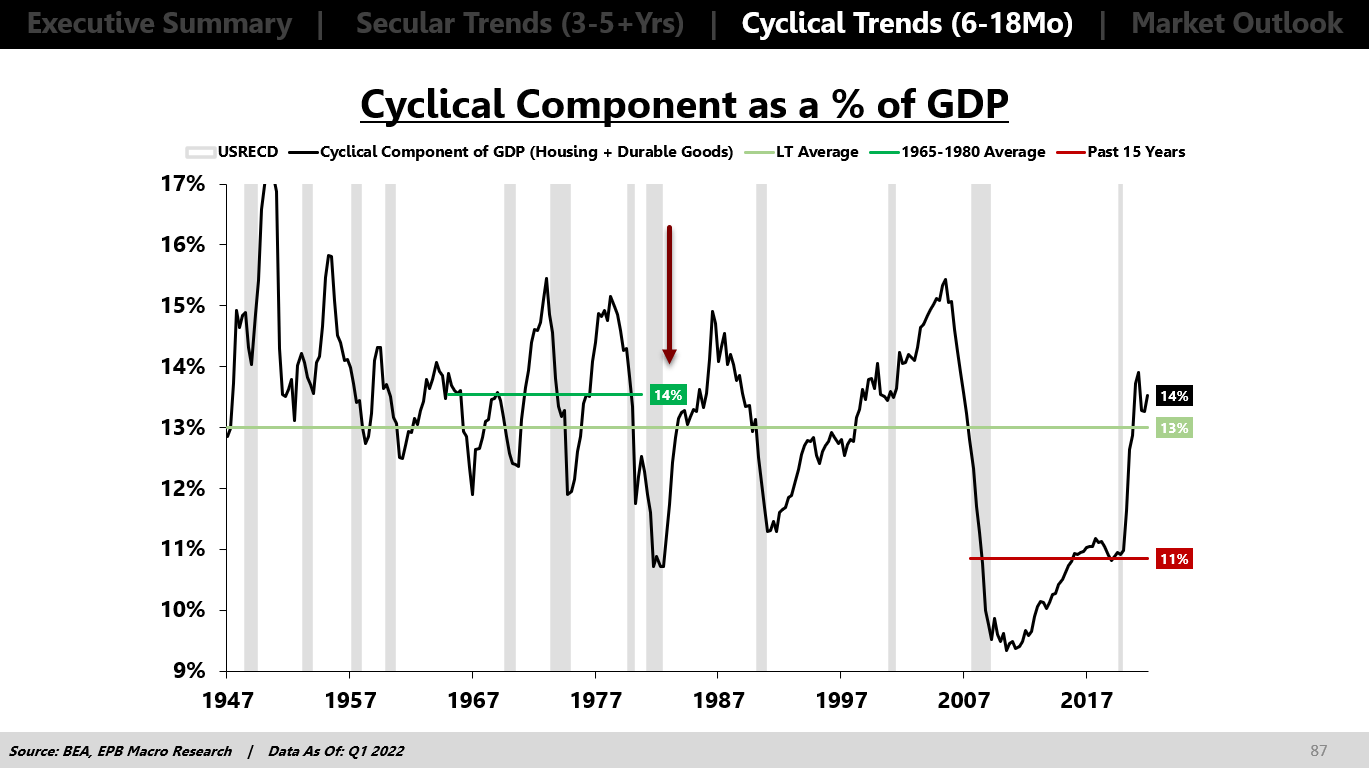
While inflation was high in the 1970s, so was real economic growth due to this sustained increase in housing and durable goods consumption, above the long-term average.
Importantly, the U.S. economy sustained above-average levels of housing and goods consumption with virtually no increase in debt. Total debt to GDP increased less than ten percentage points in those 15 years despite a boom in cyclical growth.
BEA, Federal Reserve, EPB Macro Research
In the early 2000s, there was another explosion in housing and goods consumption, rising to almost 16% of total GDP, but this time, it was debt-fueled; it wasn’t organic demographic demand.
BEA, EPB Macro Research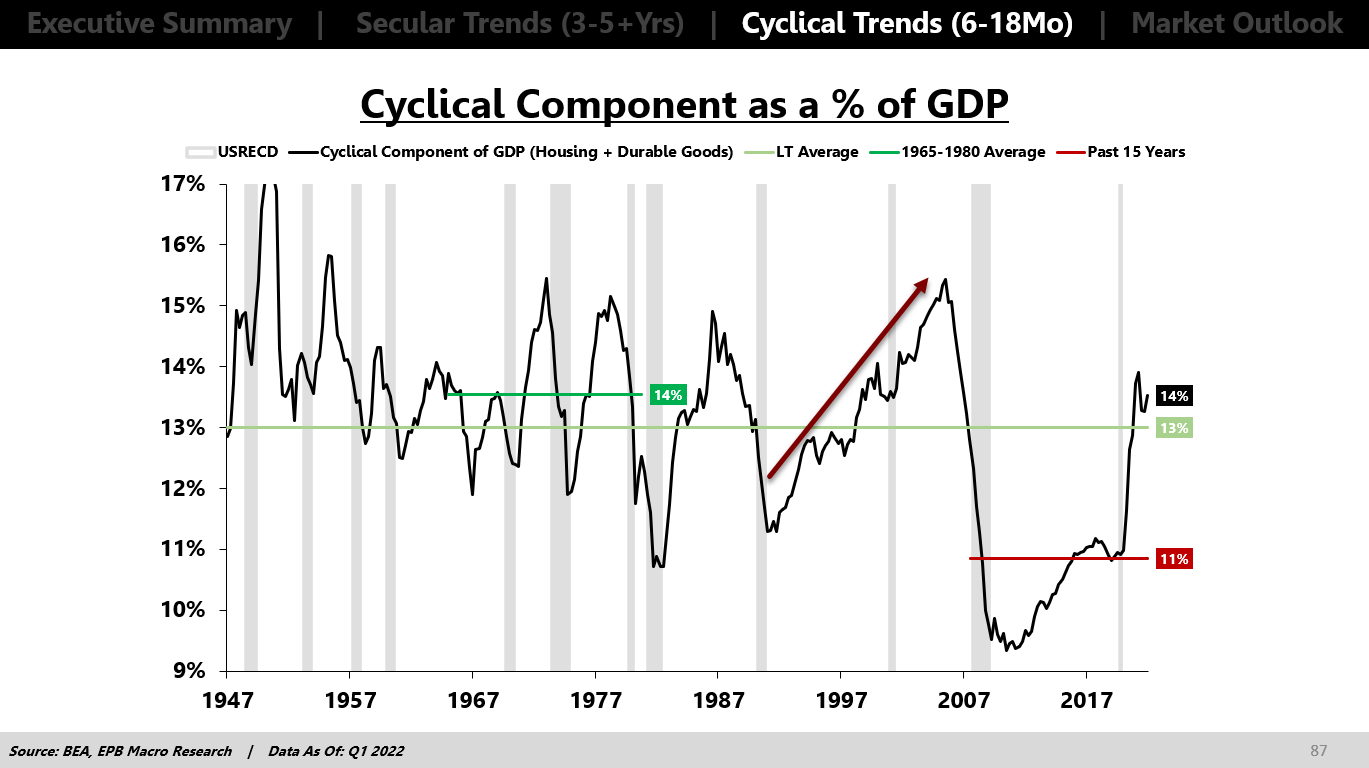
From the late 1980s to the mid-2000s, total debt to GDP rose from 250% to almost 400% of GDP. Over a 100% increase.
BEA, Federal Reserve, EPB Macro Research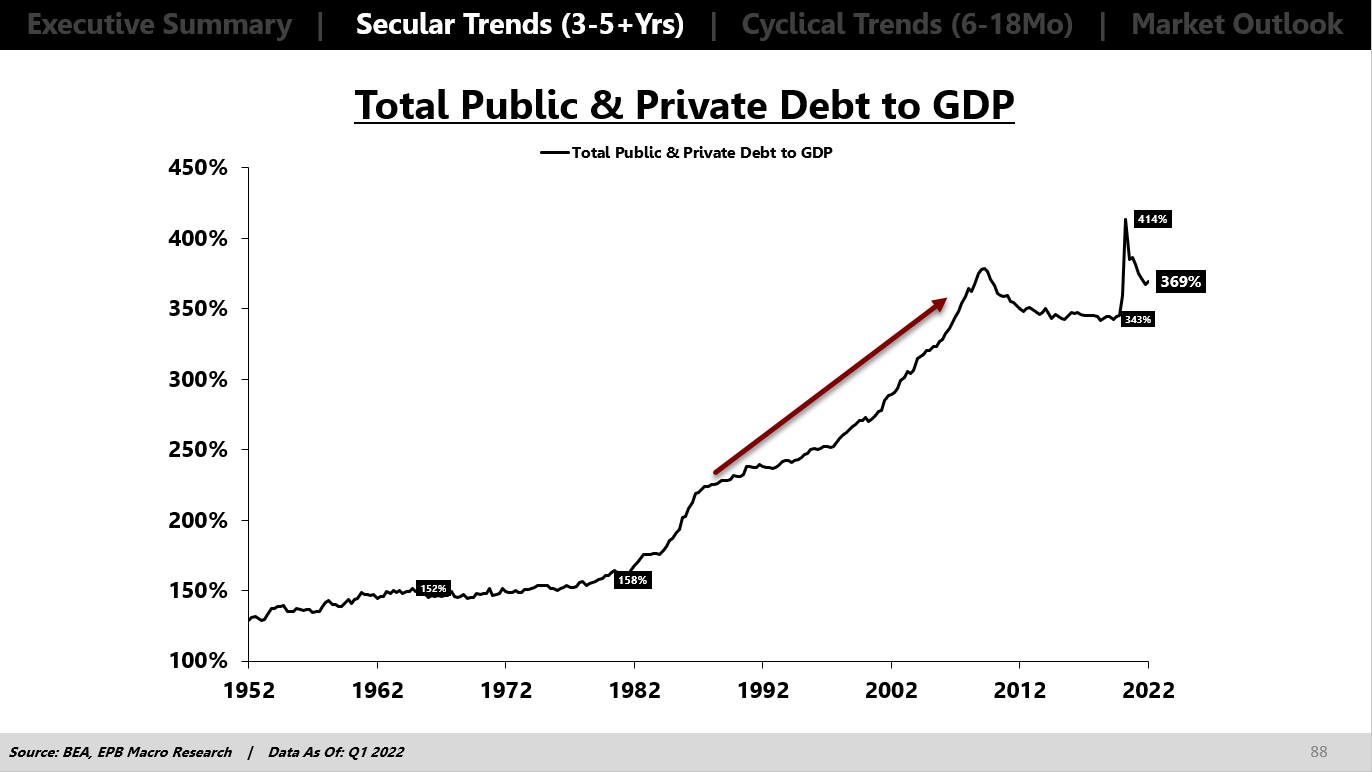
Since this was a debt-fueled speculative boom, it was unsustainable, and it ultimately crashed.
In the aftermath of the great financial crisis, the share of housing and goods was extremely depressed, only averaging 11% of GDP, way below the historical 13%.
BEA, EPB Macro Research
Since the cyclical engine of economic growth was depressed, economic growth was severely impaired, and this is why the post-financial crisis period had the weakest growth of any previous economic expansion.
Without the cyclical engine of growth, the economy is anemic. The problem is that you need organic demand. You can’t create debt bubbles to support housing and goods consumption. This is the China economic model, which has clearly led to many problems, such as Evergrande.
Today, in the aftermath of COVID, we saw an upsurge in housing and goods consumption. Rising from 11% to 14% in one year. This was one of the largest one-year increases on record.
BEA, EPB Macro Research
This boom was funded by over $5 trillion in borrowed funds and a very clear one-time shock of people leaving cities and moving to suburbs.
At a time when supply chains were constrained, you had an enormous explosion in the sector of the economy that relies most heavily on those supply chains.
Debt to GDP increased more than 25 percentage points in just one year to fund this boom. Not sustainable.
Now, interest rates are rising, and as I mentioned at the start of this article, these two sectors are susceptible to changes in interest rates.
The problem with the economy today is that we cannot continue to increase debt to fuel a housing boom. We know how that ends. We also don’t have the demographic demand of the 1970s to sustain above-average levels of housing and goods consumption without increased debt.
On top of that, interest rates are rising to their highest level in a decade.
With high debt levels and weakening demographics, organic demand will force the share of housing and goods to fall back to the 11% range that it was after the GFC, which means the trip from 14% back to 11% will be just as painful as it was enjoyable on the way up.
This boom was not caused by sustained organic demand; it was a one-time shock plus a debt binge that is now coming to an end.
This is THE most important chart in macro.
As Ed Leamer wrote in 2007, “Housing IS The Business Cycle.“
We unsustainably created a record boom in housing. Now, with higher interest rates, the risk is that this high-powered sector cools down and drags the economy into recession.
Home prices do not have to crash. That is not the risk.
The risk is the dozens of industries impacted by changes in the volume of new construction and the knock-on effects on economic growth.
Where the housing sector goes, the business cycle goes.
When you see a boom in housing coupled with an increase in debt followed by a surge in interest rates…be careful.
There’s a major inflection point on the horizon.
Be the first to comment