

nimis69/E+ via Getty Images
Last year we partied like it was 1999. It was an epic party to be sure. Thirteen years of record low interest rates, extraordinarily accommodative monetary policy, punch bowls spiked with liquidity, and everyone having a crazy time. Valuations were rich, covenants were light, and worries were few. But the dance is over. The music has been shut off, the punch bowls are empty, the lights are out, and any remaining streamers are being stripped from the rafters with each passing month. Welcome to the next decade. While the stock market has already fallen far, we are likely only getting started. Welcome to the Prince sequel never written. In the second half we’re likely going to be hung over like its 2000.
In the year 2000. The last time we have experienced a market environment even remotely similar to today was back at the turn of the millennium in 2000. We had just come off of a roughly two year stretch where technology, media, and telecom (TMT) companies were seeing their valuations launched into the stratosphere over the excitement of this new thing called the Internet. And that’s if they were even generating earnings or revenues for that matter (remember price-to-clicks and price-to-eyeballs ratios? Funny that somehow I don’t have these metrics listed in my Intro to Finance curriculum. Because they were so useful. Except that they weren’t at all. Because they were total nonsense).
By the summer of 2000, we had seen a fairly jarring correction, and some dot.com stock experts were pondering whether a long-awaited buying opportunity had emerged. Although the broader market did rally through the start of September that year, turned out that the correction that began in early 2000 was only the beginning of what ended up being one of the most epic bear markets in history that lasted all the way through early 2003. Today, we appear to be at a similar early bear phase to where we were in mid-to-late 2000.
StockCharts.com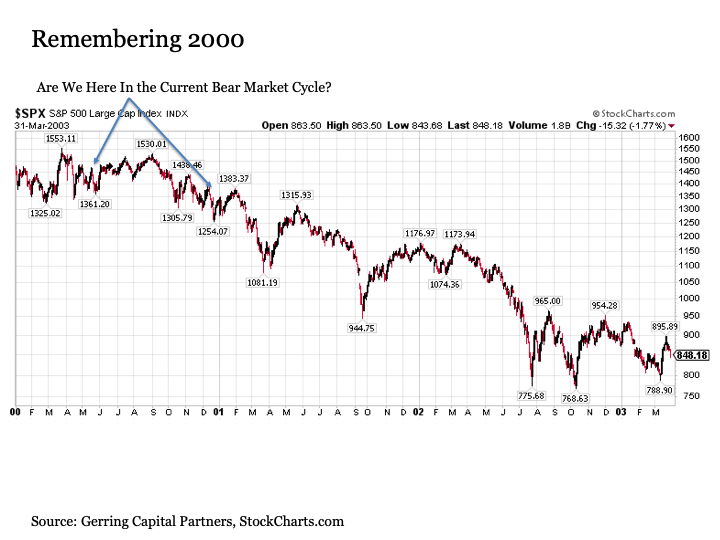
That was then, this is now. So what’s similar between 2000 and 2022? And what’s different for better or for worse?
Let’s start with the big similarities. Both preceding bull markets were led by technology and came at the end of the longest sustained economic expansions in U.S. history (COVID was a brief interruption that more than corrected for itself in the months that followed – thanks Federal Reserve!). Instead of dot.com and TMT stocks back then, today it has been the likes of big tech (AAPL)(MSFT), streaming and social media communications (GOOG)(GOOGL)(META)(NFLX), Internet related consumer discretionary (AMZN), and indefensibly hubris driven innovation (TSLA). In both cases, the percentage of the S&P 500 Index weighting to technology and friends soared well north of 30% (it’s worth noting that an index weight north of 20% has historically signaled eventual reckoning ahead (see energy in the early 1980s and financials in the mid-to-late 2000s for other examples). And in both cases investors became ominously comfortable with the idea that valuations do not matter – it’s all about the boundless growth.
What about the differences? The most important difference to note at the outset is that while many of the tech highfliers from 2000 never generated earnings or even revenues, the tech companies that led the market higher today are giants generating copious amounts of free cash flows. But much like Microsoft and Cisco Systems among others in 2000, it’s not the long-term viability of the business that is in question. Instead, it is the implications of the unsustainably high valuations that need to come back to earth. While the NASDAQ lost more than -80% of its value during the bursting of the tech bubble from 2000 to 2003, it was the tech valuation problem that played a big part in bringing the S&P 500 down by nearly -50% at the time. Take out the dot.com garbage, and the same problem looms today.
Where was the highly speculative garbage this time around? Send me a Dogecoin or any other rubbish cryptocurrency in your “digital wallet” and I will elaborate more on this point. Down -80% from current prices may be a positive survival story for the potentially remaining few cryptocurrencies over the next few years.
What are other differences? Let’s go straight to the bottom line key difference above all others. Nothing matters to markets more than liquidity. I wish it wasn’t true, but it’s just the reality. The difference between whether stocks are trading at 28 times earnings and represent “attractive” value or trading at 12 times earnings and are “not worth the risk” is whether the U.S. Federal Reserve is pinning interest rates at 0% and engaged in quantitative easing (QE) or whether they are raising interest rates at 75 basis points a pop in order to fight a raging inflation problem.
Back in 2000 once the tech bubble burst, the U.S. Federal Reserve quickly shifted from raising interest rates to cutting them aggressively. The Fed ultimately lowered interest rates to 1%, which was considered breathtakingly low at the time (I know, funny, right?). In short, the Fed was easing the whole time the market was unwinding its extreme valuations. They were able to do so because inflation was low and steady. In contrast, the Fed today is tightening as aggressively as they have in decades despite the fact that the stock market has been falling because we have our biggest inflation problem since the 1970s. Put simply, the market needs more liquidity to help turn things around, but the Fed is taking liquidity away at a rapid rate.
Big, big difference. Huge. Implications? The stock market downturn today is not likely to end any time soon. This bodes ill not only for 2022, but potentially also for 2023 and 2024 if not longer depending on how things play out. We’ll cross those bridges when we get there.
Before returning our focus to today, one more key similarity. Back during the bursting of the tech bubble, a variety of stocks outside of TMT that had been long ignored were not only trading at deeply discounted valuations, but represented attractive investment opportunities that performed well throughout much of the first few years of the 2000-2003 bear market. This included defense stocks, food companies, big oil and gas, and banks just to name a few. And the same is true today, except one can add pharmaceutical stocks to the list this time around.
What lies ahead for 2022. So we’ve established so far that the outlook for the previous tech and tech adjacent high flyers is likely to be bleak for the second half of the year, and that these challenges are likely to continue to place meaningful downside pressure on the major averages including the S&P 500 and the NASDAQ in the second half of the year.
But how much downside should we expect?
And what is likely to unfold on the economic front?
And what areas of the market present upside opportunity?
Let’s start with the S&P 500 Index. All of the key technical trendlines and moving average supports have been broken. This is a market that is clearly on the move to the downside. But how far between now and the end of the second half of the year?
StockCharts.com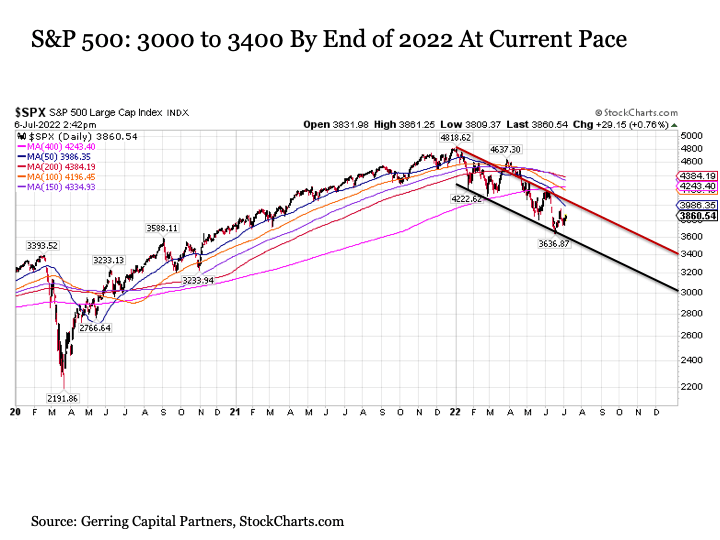
If the current downward sloping channel continues as it has since the start of 2022, this would place the S&P 500 in the 3000 to 3400 range. This would be another -12% to -22% downside from current levels and an overall decline of -30% to -38% from its all-time high at the beginning of the year.
Such a move may seem outlandish at first, but it is worthwhile to put things into fundamental context. First, this scenario would have the S&P 500 trading between 15x to 17x earnings assuming current earnings hold. But it should also be noted that the S&P 500 is currently trading at peak earnings, and we should not be surprised to see earnings growth and forecasts slow if not turn negative in the second half of the year. As a result, the S&P 500 could decline further between now and the end of the year and could be just as expensive if not more so on a price-to-earnings basis by the end of the year (the “E” shrinks just as much if not more than the “P”).
Still seems extreme? Let’s provide additional perspective. Such a move would do nothing more than unwind the gains the market had accumulated since the pre-COVID peak in February 2020. Monetary stimulate the stock market to the sky, monetary tighten the stock market back to earth.
What about the “tech heavy” NASDAQ? At its current pace, it is on track for a move back to the 8000 to 9000 range by the end of the year. This represents another -20% to -30% downside from current levels and a -45% to -50% decline from its pre-Thanksgiving 2021 peaks.
StockCharts.com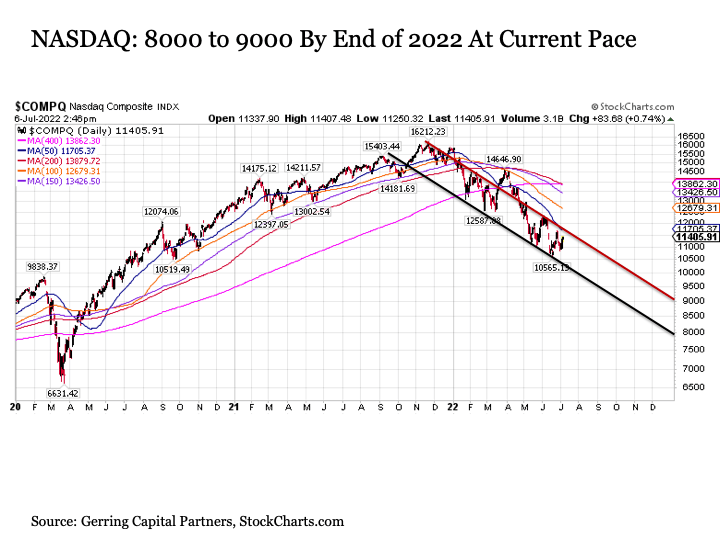
Poppycock? Consider the following simplified point. Take -30% to -40% off of the current (not peak, but current) prices of both Apple and Microsoft, which are the two big dogs of the S&P 500 and NASDAQ indices at combined weighting of -13% and -24%, respectively, and these two stocks are no further than back to their long-term historical average price-to-earnings multiple assuming their current earnings growth forecasts hold, which they may not depending on the economic outlook.
And once again, such a return to the 8000 to 9000 range represents nothing more than a return by the NASDAQ to its pre-COVID February 2020 highs. Remember that the NASDAQ did not break above 10000 until the July after the onset of COVID (because, you know, COVID was so good for the global economy, except that it wasn’t, but the monsoon of central bank liquidity sure felt good!).
On to the economic outlook. So what about the sustainability of the “E” in the P/E ratio for so many of these companies that make up the major market indices? For the answer, we need to consider the economic outlook for the second half of the year.
I’ll get straight to the point here. We’re likely to be in economic recession in the second half of the year. That is, of course, if we’re not in recession already. After all, we had a negative real GDP growth print for 2022 Q1 (for reasons that needed to be taken with a hefty block of salt – not as bad as it looked), and the latest reading from the Atlanta Fed GDPNow has real GDP at -2.1% for 2022 Q2. While some may quibble, two consecutive quarters of negative real GDP growth is your textbook definition of an economic recession. As a result and as the yield curve already predicted a few months ago now, count a recession as a foregone conclusion.
Let’s build on this point. The economy is probably already in recession. And recessions are really bad for corporate earnings. Usually the Fed eases monetary policy to offset the negative forces of a recession. Instead, the Fed is still tightening monetary policy… really aggressively. This includes 75 basis points at its last meeting and projected for another 75 basis points at its next meeting on July 27 and yet another 50 basis points at its September 21 meeting. Economic recession coupled with a still aggressively tightening Fed means that the forces that are decidedly negative for corporate earnings today are likely to become compounded meaningfully in the months ahead. Oh yeah, high inflation is not good for earnings, profit margins, or stock valuations either. Yeouch, yeouch, and ye-ouch.
What about the opportunity? Enough of the bearishness. We all have a capital market to navigate through the remainder of the year, so where do the opportunities lie?
Selective stock opportunities. The economic environment described above is deadly for growth stocks, particularly momentum names. And it’s very likely while we may see the price of Bitcoin and Tesla ground into powder in the coming months (much like Netflix has already). Economic recessions, inflation, and aggressive monetary tightening are not the backdrop for flights of fancy. Instead, they are the conditions that reward, at least in the earlier to mid-stages of the downcycle, the likes of intrinsic value, deep value, earnings predictability, and low price volatility. These are the stocks that have been doing just fine so far in 2022, and are likely to continue to do so with fits and starts as we continue through the second half.
Here are a few examples.
Defense. Not aerospace, mind you, but purely defense (or as purely as possible). Here is an industry whose constituents are trading at or below fair value in many cases. What about the fundamental outlook? Explained in one word – Ukraine. Looking for a second word? Taiwan. The defense industry is among my most favored allocations not only for the second half of 2022, but for the foreseeable future. I’ve been long Lockheed Martin (LMT) and Northrop Grumman (NOC) since 2020.
Big Pharma. Many of the stocks in the industry are meaningfully higher for 2022, yet still trade at a meaningful discount to fair value. Fundamental rationale? One word – COVID. The worst of the pandemic may be behind us, but a lot of people are still getting sick, not to mention the millions that are still suffering from long haul COVID (I know some who are, and it is horrible what they are still going through). Moreover, just as military wars have led to meaningful jumps in innovation in their wake, so too does a health care pandemic war lead to meaningful advancements in medical care and treatments. I’m currently long a whole basket of health care stocks including Johnson & Johnson (JNJ), Pfizer (PFE), Merck (MRK), and Bristol Myers (BMY) dating as far back as 2016.
Banks. While many are still reeling from the after effects of the Great Financial Crisis when financials were at the heart of the problem, traditionally banks have done relatively if not absolutely well during periods of economic weakness. Why? From a historic business and market cycle perspective, financials perform at their relative best during the mid to late stages of an economic recession and bear market. Why? Because as companies and capital allocators start to see the economic light at the end of the tunnel and start to contact their banks to line up loans and funding for new capital expenditures and fixed investment. Given that banks remain historically discounted to fair value, this adds to the appeal. The fact that the Federal Reserve continues to raise interest rates is also a short-term plus. I have been long JP Morgan Chase (JPM) and U.S. Bancorp (USB) as far back as 2020.
Of course, the stock market is only one of many asset classes that make up capital markets (cryptocurrencies is still not one of them). As a result, it is also worthwhile to look beyond stocks to some of the various other asset classes that may also offer upside opportunity in the second half of 2022.
Long-Term Treasuries. Madness, you might say. Why on earth would one want to own the long bond in a high inflation environment?
First, a recession is coming if it’s not already here, and it might last for a while. This is bullish for Long-Term Treasuries as investors move to safety and lock in what may ultimately be higher long-term rates (if the Fed eventually takes short-term interest rates back to 0% over the next couple of years, locking in a 3% yield today ends up being an attractive deal).
Again, what about high inflation!?! While inflation remains hot today, my investment time horizon extends well beyond today. And it remains my view that high inflation will prove transitory at the end of the day. We’ve already seen the year-over-year increase in Core PCE inflation, which is the Fed’s preferred inflation measure, move lower for four straight months now from 5.3% in February to 5.2% in March to 4.9% in April and 4.7% in May. While food and energy prices may keep headline inflation elevated over the summer months (although oil prices have already fallen by -20% from June peaks and -25% from March highs, but we can’t rule out that they may bounce back up through the summer driving season), core inflation has already been on the fade for much of 2022. And if inflation continues to fade as the economy falls further into recession, this is bullish for long-term Treasuries. It also eventually brings relief to stocks, but not right away.
While my current forecast between now and the end of the year for long-term U.S. Treasury yields has a wide band, as much will depend on the headline inflation numbers in the coming months, a 10-Year U.S. Treasury yield back below 2.5% (or even 2.0%) should not be ruled out by the end of the year. The fact that the 10-year breakeven inflation rate has recently plunged to 2.30%, which is the lowest level that we’ve seen since September 2021 and is on the brink of falling back into the pre-COVID range when disinflation / deflation ruled the day is further support of long-term Treasury yields moving measurably lower in the second half of the year.
StockCharts.com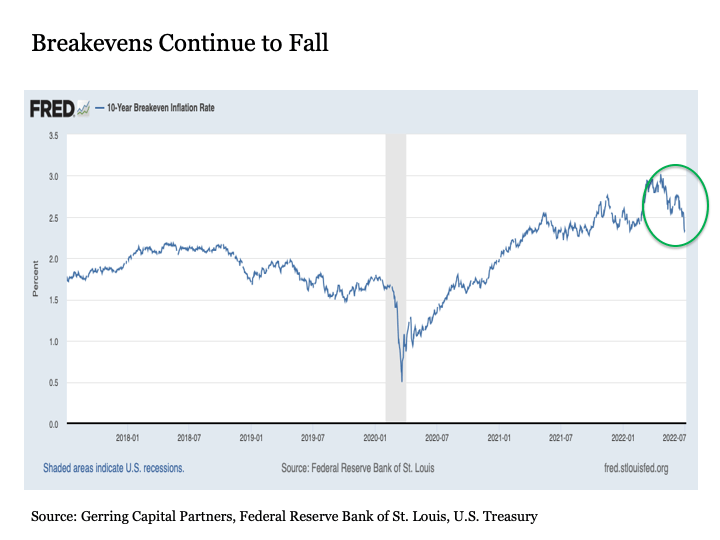
Even if this scenario plays out, anticipate continued heightened volatility in Treasury yields in the months ahead. I have been long the 20+ Year U.S. Treasury (TLT) since 2015, and remain committed to this allocation going forward.
Gold. Gold ranks among my most favored allocations for the second half of 2022 and into 2023. While gold provides a hedge against inflation, it even more so provides a safe haven against the economic uncertainty that comes with a recession in a high inflation environment where the Fed is really late and now ultra-aggressive in tightening monetary policy. Moreover, as the cryptocurrency mega bubble continues to unwind and the “digital gold” hypothesis is debunked, many would be and used to be gold investors are likely to come back home to the yellow metal.
StockCharts.com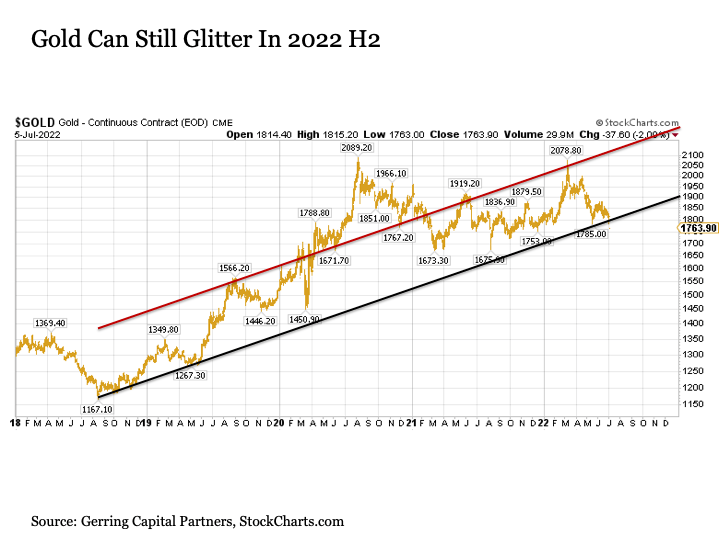
Gold has been consolidating COVID related gains for more than two years now, and further back and forth swings should be expected in response to the Fed’s aggressive monetary tightening moves. But the long-term uptrend in gold remains intact, and given that gold has already pushed its way above $2000 per ounce already over the last three years, it would not be surprising given all of the economic uncertainty looming ahead to see gold end the year in the $1900 to $2200 per ounce range by the end of the year.
Bottom line. It has been a tough year for the headline stock market so far in 2022, and this appears likely to continue through the remainder of the year. But the stock market remains filled with opportunities for those searching under the surface. And while Long-Term Treasuries and gold have also had a tough stretch so far this year, their prospects look decidedly better as we move through the rest of 2022.
Be the first to comment