Fox Photos/Hulton Archive via Getty Images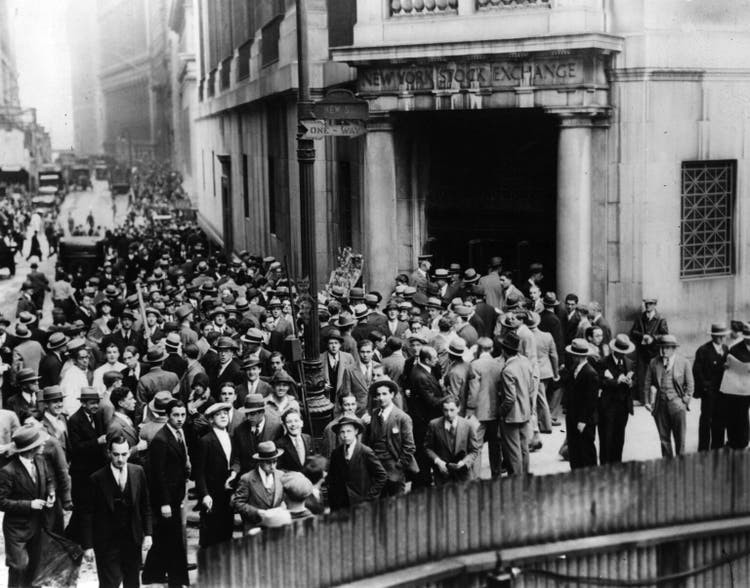
History Doesn’t Repeat Itself, but It Often Rhymes. – Mark Twain
We find ourselves in the midst of the next verse in history’s ballad and the poetry is somber. Granted, economies of today are vastly different than those of the late 1920’s. But there are two characteristics of that time period that are similar to today: cheap credit and greed.
Through a series of prodigiously coincidental events, something is happening that has not occurred in over a hundred years: The Federal Reserve System of the United States is tightening monetary policy into a recession following an extraordinary period of financial speculation.
That action contributed to the severity of the Wall Street Crash of 1929 and it is contributing to weakness in equity markets today. This is not to suggest that the U.S. is heading for another Great Depression, which was the result of other factors.
The lessons of history can help us understand the context of today’s markets and help us prepare for the future. A future of tremendous promise when this turbulent period has passed.
Then or Now
Let us begin with an exercise. The following are quotes from people or publications describing financial markets of their time. As you read each one, try to guess whether they are from the era of 1927-1930 or from 2020-2022.
I eat, sleep, dream, and talk stocks. The only way, I believe, to make money… It is exciting. I love it.
This quote is from Arthur Crew Inman written in his diary on January 3, 1929, nearly nine months before the crash. His diary is famous for extensively archiving daily life in the U.S. between 1919 and 1963.
Stock prices have reached what looks like a permanently high plateau.
This quote by Yale economist Irving Fisher was published in the New York Times in October 1929, after the top was in.
Say it with me … Stocks only go up. Only losers take profits.
This quote is from Dave Portnoy in June 2020 who became well known for posting his day trading activities on social media.
Taxi drivers told you what to buy. The shoeshine boy could give you a summary of the day’s financial news as he worked with rag and polish. An old beggar who regularly patrolled the street in front of my office now gave me tips and, I suppose, spent the money I and others gave him in the market. My cook had a brokerage account and followed the ticker closely.
This quote comes from Bernard Baruch published by Fortune Magazine. Mr. Baruch was a Wall Street investor who sold his equities before the crash in 1929.
I was foaming at the mouth at those posts about six-figure gains…. My brain was scattered. I’d check my phone over 500 times a day, and I became jealous of others making so much money.
This quote is from an anonymous trader that was published by Business Insider describing the experience of trading in 2020-2021.
I believe these minor examples of testimony demonstrate the fervent emotion and enthusiasm that became widespread during both time periods. It requires a unique combination of easy credit, accessibility, and universal attraction. It is not easy to undo this condition without consequences.
Proverbial Shoe Shine Boys
During the decade of the 1920s, access and participation in equity markets grew dramatically to include people of all kinds that ordinarily did not participate in the stock market. Stocks became a regular topic of conversation among people who had no role in finance or banking. People invested their limited life savings with the expectation that they would earn riches. Stock investing became so popular that stock ticker tapes, conveying share price information, became commonplace in a variety of locations including train stations, boats, and night clubs.
Mr. Baruch decided to sell his equity positions after he observed investing advice being offered by everyone from taxi drivers to shoeshine boys. In a similar story, Joseph Patrick Kennedy has claimed that he knew to sell stock positions before the crash when he received stock tips from a shoeshiner and gauged sentiment to be overly bullish.
Over the past three years we have witnessed a similar resurgence of epidemic investing. This phenomenon manifested itself in the rise of groups like aptly named Wall Street Bets and the growth in social media influencers offering financial advice. FinTwit and FinTok are monikers for online investing communities that have experienced tremendous growth earning billions of views since 2020. The level of investing activity is represented by a spike in web search activity for the term “stocks” as provided by Google Trends:
Chart by author (data from Google Trends)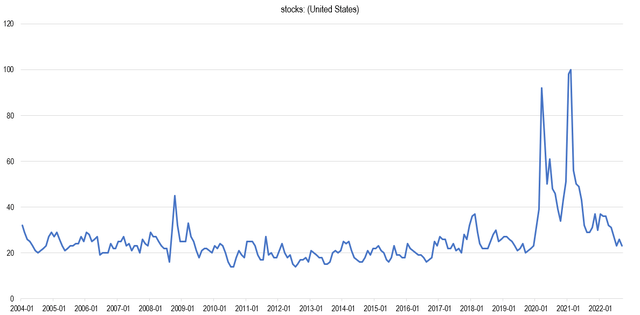
Ticker tapes have been replaced with cell phones which not only convey share prices but permit trading by anyone with internet access. Robinhood was among the most popular brokerages for these new investors and experienced a surge of interest in 2020-2021 as indicated by Google Trends search data. Annual users of Robinhood Markets (HOOD) grew from 10 million in 2019 to 22.5 million in 2021.
For those who were paying attention, these social media influencers were the proverbial shoeshiners of this era.
Chart by author (data from Google Trends)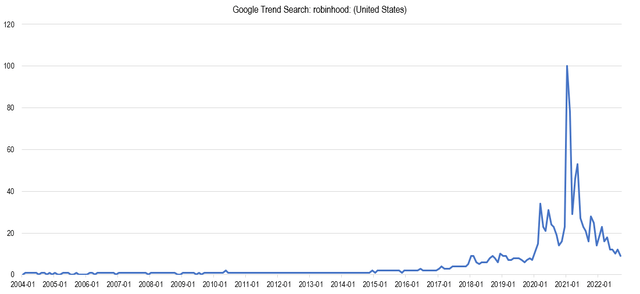
Monetary Tightening To Ring Out The Excess
According to the St. Louis Fed, interest rates declined from the early 1920s to 1927. Easy credit permitted investors to greatly leverage their stock portfolios. This is an excerpt from the paper The Great Margin Call:The Role of Leverage in the 1929 Stock Market Crash.
From late 1928 through the summer of 1929, banks and brokerage firms tightened margin requirements from about 10-20% to about 50%, levels that were without precedent.
The Federal Reserve recognized the excessive speculation and attempted to stem the momentum by tightening monetary policy. The following is an excerpt from Britannica about interest rate policy:
In 1928 and 1929, the Federal Reserve had raised interest rates in hopes of slowing the rapid rise in stock prices. These higher interest rates depressed interest-sensitive spending in areas such as construction and automobile purchases, which in turn reduced production.
Between 1928 and 1929 the rate on 4 to 6 month commercial paper rose from 4% to 6.25% while high grade corporate bonds rose from 4.5 to 4.8%. In addition, the U.S. was entering into recession in 1929. Professor Richard Sylla told Time Magazine:
It was a prosperous decade, but there was an economic slowdown at the end of the decade, a recession that had started in the second half of 1929. But the economy then was used to having recessions every two or three years, so there’s no reason why that recession had to turn into a Great Depression.
Professor Richard Sylla also stated:
Milton Friedman and Anna J. Schwartz’s book A Monetary History of the United States, 1867–1960 pointed out there was no connection between the 1929 Wall Street crash and the Great Depression.
Anna J. Schwartz in her publication “Money in Historical Perspective” points out that restriction in the growth of money supply beginning in 1928 contributed to the start of a business contraction prior to the peak in the stock market. Continued tightening exacerbated the stock market decline.
Senior Economist Timothy Cogley summarizes the events in his Economic Letter, Monetary Policy and the Great Crash of 1929: A Bursting Bubble or Collapsing Fundamentals? The conclusion of the letter is this:
…the events of 1928-1930 actually provide a case study of the risks associated with a deliberate attempt to puncture a speculative bubble.
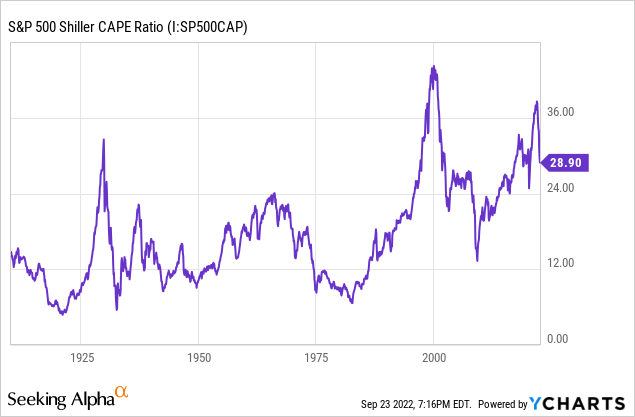
Cogley analyzes the speculative bubble condition in relation to the price-dividend ratio. In addition, I prefer to examine the Shiller CAPE ratio for added clarification. The chart below shows that the CAPE ratio of the S&P grew rapidly in 1928-1929 reaching a multiple of 30 before crashing back to mean. The CAPE ratio behaved similarly through the 2000 Dotcom bubble and crash. The ratio reached a concerning level of 38 at the start of 2022 and has since fallen to 28.9. The ratio has not yet returned to mean but has improved significantly this year.
When the stock market crashed in 1929 the volume of margin calls rose dramatically. Most investors did not have extra cash to cover their margin calls because the public was collectively fully invested.
Margin calls are rising with volatility today. What is most alarming is that many of these margin calls seems to be for inexperienced investors. Google Trends search data shows a measurable spike in the term “margin call” starting in 2022.
Chart by author (data from Google Trends)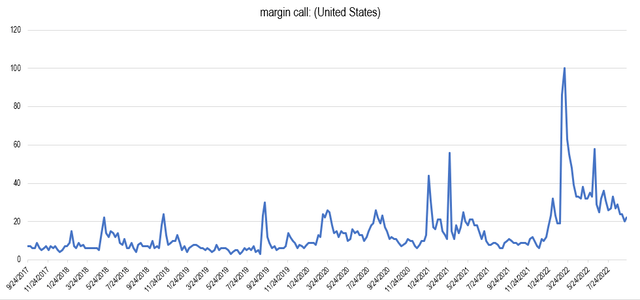
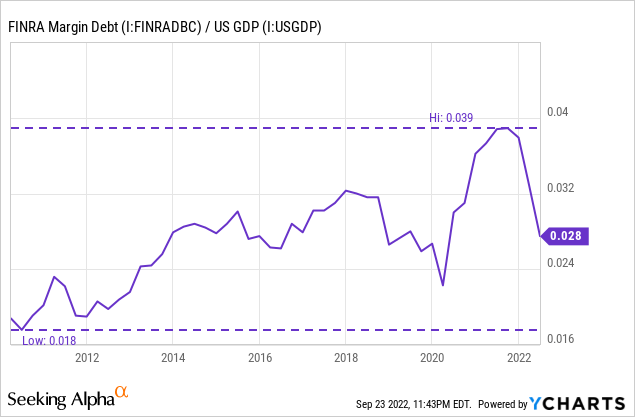
FINRA margin debt as a percent of GDP peaked in 2021 at a concerning level of 3.9%. It has since reduced to 2.8% which is in-line with levels of 2014-2019.
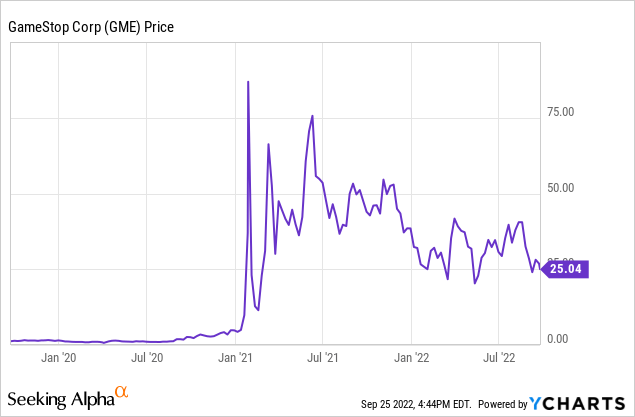
However, the amount of leverage available to average investors through the use of options is much higher today. In 2021, a record daily average number of options contracts were traded which included 25% by retail investors. Novice investors crowded into options contracts on high momentum stocks creating one-of-a-kind gamma squeezes like that of GameStop. The fact that GME has not returned to its pre-gamma squeeze trading range suggests that speculation remains.
Cassandras of Wall Street
There were some that expected the Crash of 1929 and urged people to prepare. Banker Paul Warburg in an annual report to stockholders in March of 1929 wrote:
If the orgies of unrestrained speculation are permitted to spread, the ultimate collapse is certain not only to affect the speculators themselves, but to bring about a general depression involving the entire country.
Warburg served as the 2nd Vice Chair of the Federal Reserve and was instrumental in its founding. His warnings about the stock market earned him the nickname “Cassandra of Wall Street,” owing to the fact that his warnings went largely dismissed. It turned out that his report was more than timely as the Dow Jones Industrial Average went on to lose 89% over the following three years.
Charts by TradingView (adapted by author)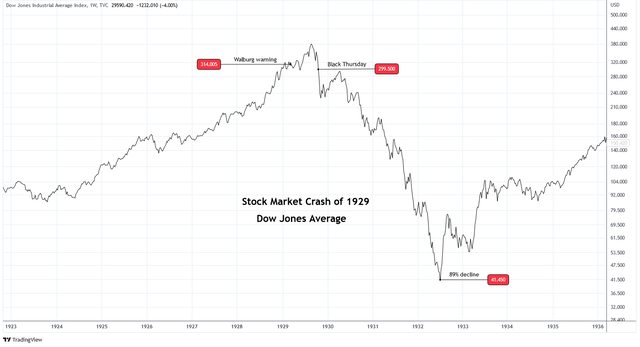
The nickname “Cassandra” has been used to describe Dr. Michael Burry who is known for making similar predictions in this era. Burry is famous for shorting the U.S. housing market prior to the Great Recession in 2008. This is a quote Tweeted by his verified Twitter account in June 2021:
People always ask me what is going on in the markets. It is simple. Greatest Speculative Bubble of All Time in All Things. By two orders of magnitude.
That is a bold statement. But less than 2 years later the ARK Innovation ETF (ARKK), a proxy for the highest momentum equities, has fallen by 76%.
Charts by TradingView (adapted by author)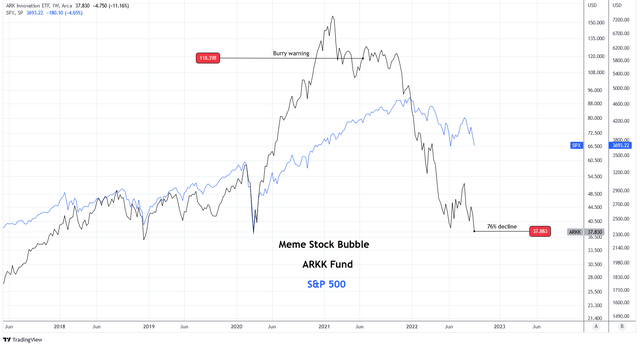
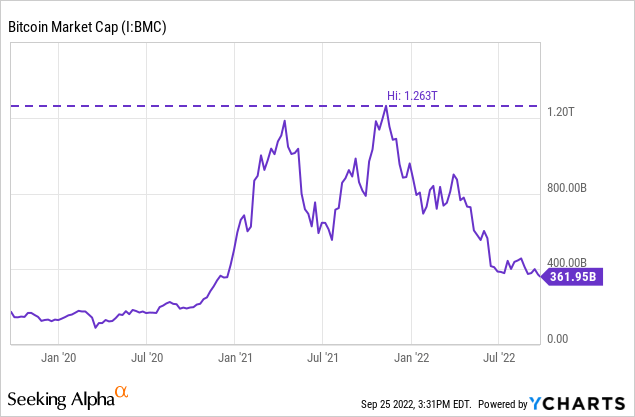
The market capitalization of Bitcoin has declined from $1.263 trillion to $361.95 billion. The total market cap of cryptocurrencies worldwide has declined from a peak of $2.9T to $938 billion. The recent decline in tech stocks and cryptocurrencies are a manifestation of the reversal in speculative excess.
Repeating the Mistakes of History
The Crash of ’29 was a result of several converging forces occurring at the pinnacle of a major speculative bubble:
- Stricter margin requirements
- The start of recession
- Rising interest rates
- Slower money supply growth
There are qualities of each condition that are in effect today.
Stricter Margin Requirements
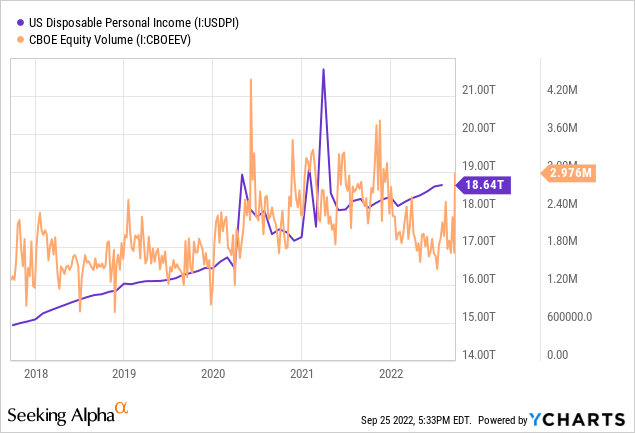
Margin requirements have changed little over the past three years but policy has impacted the level of effective leverage. The distribution of stimulus checks in the U.S. correspond with spikes in options contract volumes, as can be observed in the chart below which shows spikes in disposable personal income with each stimulus distribution. There are numerous reports of traders exploiting options strategies to maximize their effective leverage. One strategy, nicknamed the “infinite money cheat code,” used margin to write covered calls to credit the brokerage account, a glitch on the Robinhood platform. One trader claims to have held a $1 million position on $4,000 capital, a leverage ratio of 250x. The glitch has since been resolved and the end of fiscal stimulus used to purchase options contracts has become a headwind for leverage in equity markets.
Start of Recession
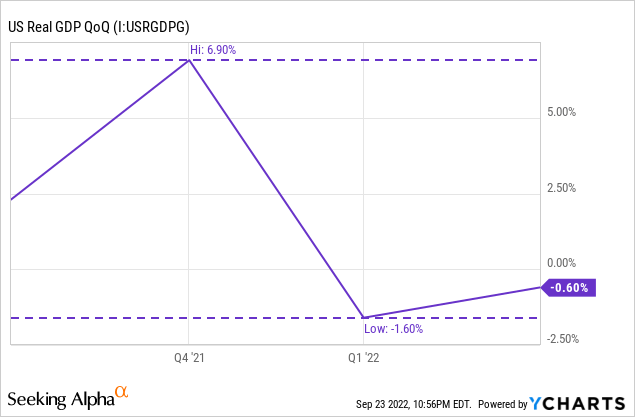
I’ve written before that I believe the U.S. is already in recession. The first two quarters of 2022 printed negative real GDP growth. Third quarter estimates by GDPNow started strong and have fallen to 0.3%. The GDPNow estimate tends to be generous at the start of the quarter and become more realistic near the quarter end. I think it’s plausible that Q3 real GDP growth will be negative. Can we deny a recession with three consecutive negative quarters?
The most often cited data to argue against recession is employment data, specifically the low unemployment rate and initial jobless claims. I did an in-depth analysis in this article. Employment is not a reliable sign of the beginning of recession because it is a lagging indicator.
I use the employment-population ratio to better understand employment. History shows that the ratio usually stalls at the start of recession and begins to decline shortly after recession begins. The ratio is currently stalling at 60. This is significant because the ratio has not recovered to pre-pandemic levels. I believe that employment data is especially lagging now because the labor market is still recovering from that disruptive event.
Federal Reserve Economic Data | FRED | St. Louis Fed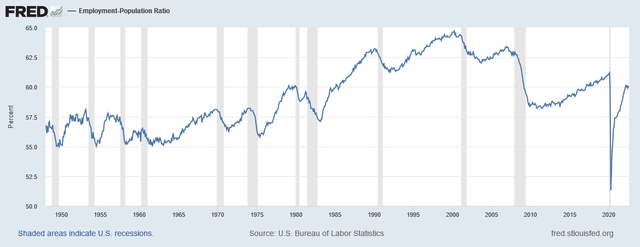
Other indicators are beginning to agree with recession. The real gross fixed capital formation for United States has recorded a -1.2% QoQ change for Q2 2022. This rate of decline is consistently associated with periods of recession as the indicator is a measure of business investment in fixed assets.
Federal Reserve Economic Data | FRED | St. Louis Fed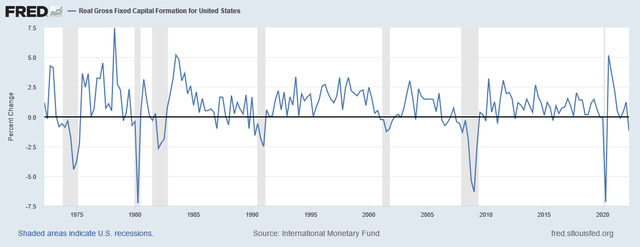
Rising Interest Rates
You may be wondering, how is this different than 2000? Although a major speculative bubble had culminated, the Fed quickly paused rate hikes in early 2000 and began cutting rates in October 2000 as the Nasdaq began to decline. In addition, real GDP growth did not decline until Q1 2001.
Charts by TradingView (adapted by author)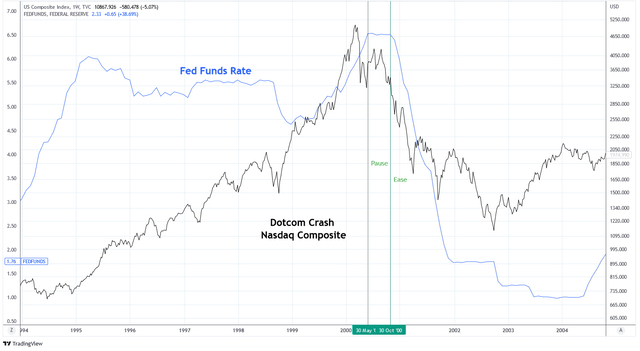
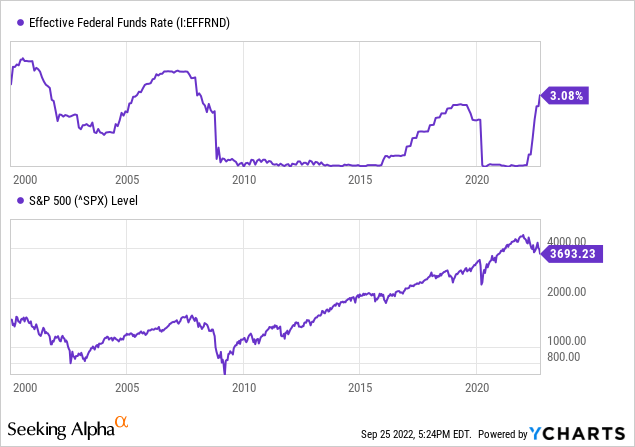
Not only is the Fed continuing to raise rates today but they are raising the FFR at the fastest annualized pace in seven decades on a quarter by quarter basis. And according to the FOMC Dot Plot the members expect higher rates through the end of 2023. Clearly, pausing is not on their minds.
Slower Money Supply Growth
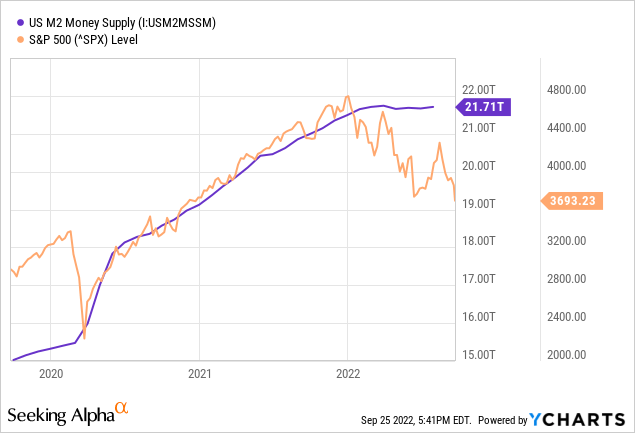
The U.S. money supply as measured by M2 increased dramatically in response to the pandemic in 2020. Over that period of time M2 has increased by an astonishing 40%. Money supply growth peaked in February 2022 and has since declined by 0.14%.
Summary
The lesson here is this: it is dangerous to press forward with monetary tightening during recession after a major speculative bubble. The last time that was followed to its conclusion it caused the most volatile event in the history of U.S. markets.
This is not a doomsday premonition. For one, much of the excessive speculation and leverage has already been remediated. Also, the Great Depression was caused by other factors that are not applicable today.
This is an alert that current conditions are treacherous. The following decisions made by policy makers will determine whether historians write chapters about this episode or entire books unto itself.
For these reasons, my portfolio is the most defensively postured it has ever been. My allocation to U.S. Dollar cash and Treasuries is the largest it has ever been. Nearly every long position is hedged. From where I sit we are barreling toward a policy error. It is the opinion of this author that the time to pause is now.


Be the first to comment