

Justin Sullivan/Getty Images News
Introduction
My thesis is that Salesforce (NYSE:CRM) is doing a nice job approaching their $50 billion annual revenue target for FY26. They had revenue of $26.5 billion for FY22 and they’re guiding to revenue of $31 billion for FY23. Their fiscal years end in January so FY26 ends in January 2026.
Revenue Expansion
At the 2022 investor day presentation, CFO Amy Weaver noted that the first pillar for Salesforce is the Customer 360 advantage, particularly multi-cloud adoption. The broad portfolio has a multiplier effect with annual recurring revenue (“ARR”):
When you compare the average customer with a single cloud to a customer who has just 2 clouds, the ARR is 3x as much. Three cloud customers 9x as much, 4 clouds, 24x as much ARR, and it keeps going. In fact, look at these numbers for 7 cloud customers, they’re generating 300x more ARR than your average single cloud customer.
Early in the investor day presentation, Co-CEO Marc Benioff mentioned that when they sell the whole cocktail, the customers are more strategically aligned with them and they have lower attrition. An investor day slide demonstrates this reality that attrition falls as the number of clouds rises:
Salesforce Attrition (2022 Investor Day)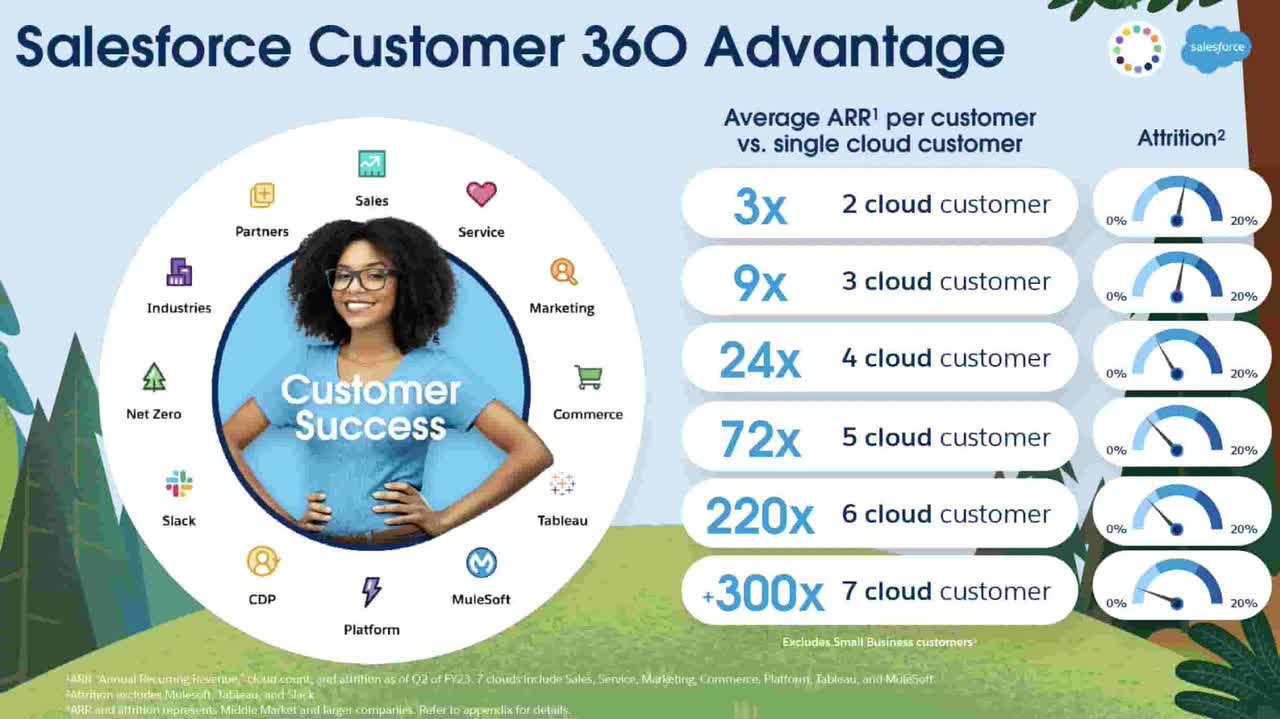
It is noted that the above slide excludes small business customers defined as businesses that have less than 200 employees in the Americas and less than 100 employees in other regions.
CFO Weaver continued by emphasizing the revenue opportunity Salesforce has since customers with 4 or more clouds are currently only 20% of total customers. These 20% are driving 85% of total ARR so wonderful things can happen from a revenue standpoint if more customers are moved over to additional clouds:
Multi-Cloud Adoption (2022 Investor Day)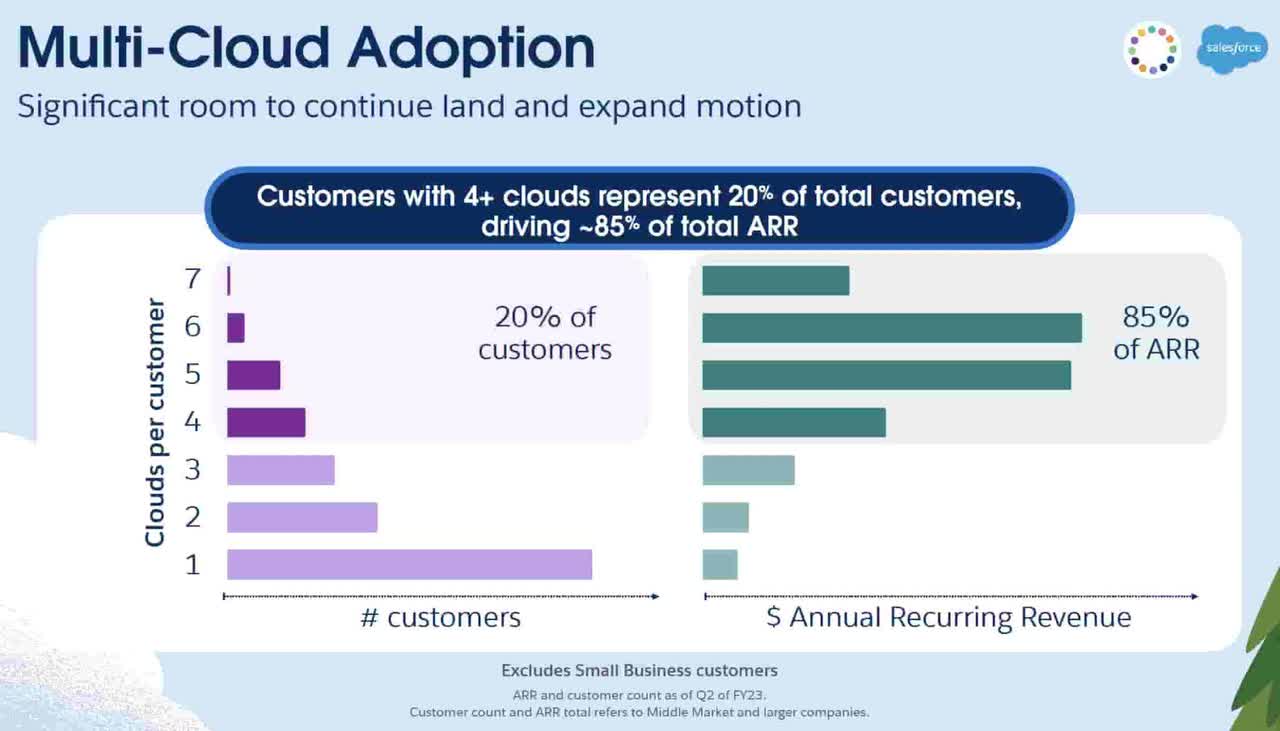
CFO Weaver showed a slide with all the cohorts from FY07 to FY23. The customers starting in FY07 generally began with a single cloud and today they have nearly 6 clouds on average and they’re generating nearly 48x the ARR as when they first joined. Looking at the FY12 cohort, they’re now generating 9x as much ARR as when they started. CFO Weaver stressed that one thing she loves is that the customers joining in FY22 are starting with nearly 2.3 clouds on average which is more clouds than the customers starting in previous years:
Land and Expand (2022 Investor Day)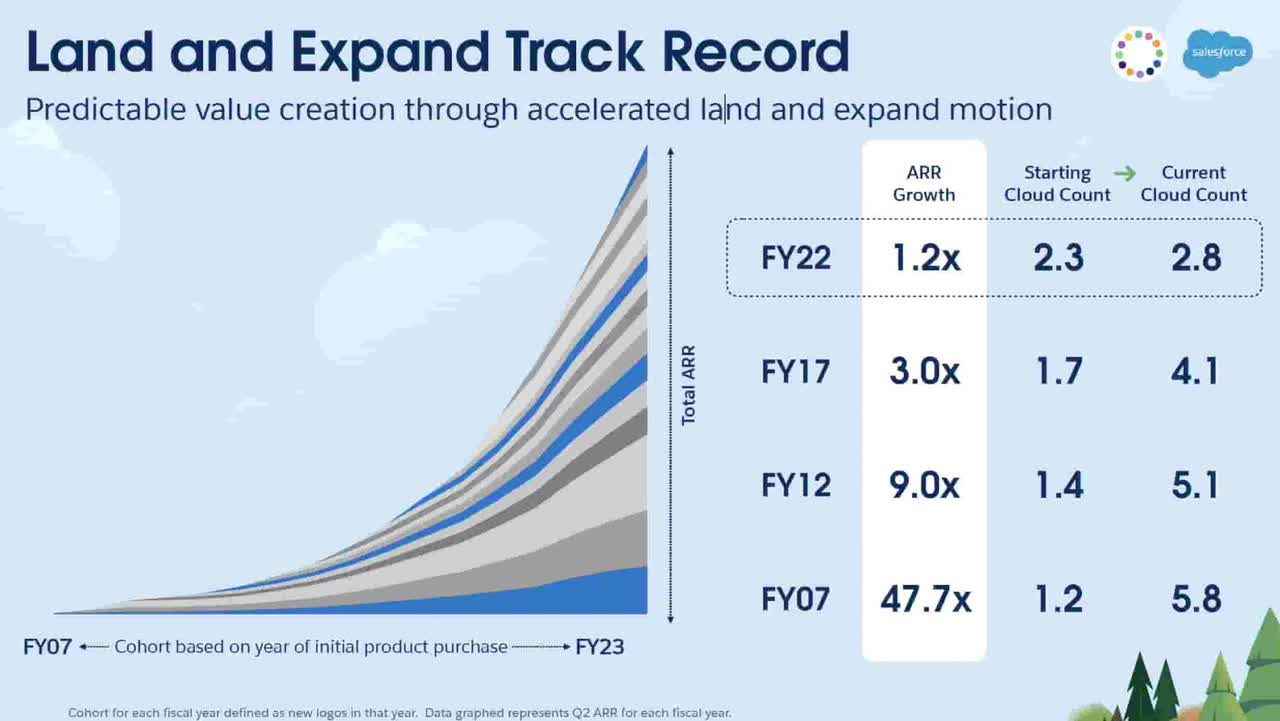
Per CFO Weaver, the second pillar for Salesforce is composed of industry solutions. Their 12 industry solutions are driving $3.8 billion of revenue which is up from $2.9 billion a year ago. Average selling prices (“ASPs”) are 30% higher and attrition is 2% lower for industry sales:
And when we talk about industries projects, what these are is they’re really out-of-the-box solutions tailored to particular industries. [Co-CEO] Bret Taylor loves to say, this helps these customers start on third base, easy to install, fewer installment shorter installment time, quicker time to value. But there’s something for us as well. And the reason I love this is, our industry sales generates 30% higher ASPs, 2% lower attrition when compared to core and 45% of the customers are new logos to Salesforce. Beautifully balancing out our opportunities in our installed base while continuing to bring in a steady flow of new customers to Salesforce.
These figures were shown in an investor day slide. Note that the attrition percentage excludes MuleSoft, Tableau, and Slack:
Salesforce Industries (2022 Investor Day)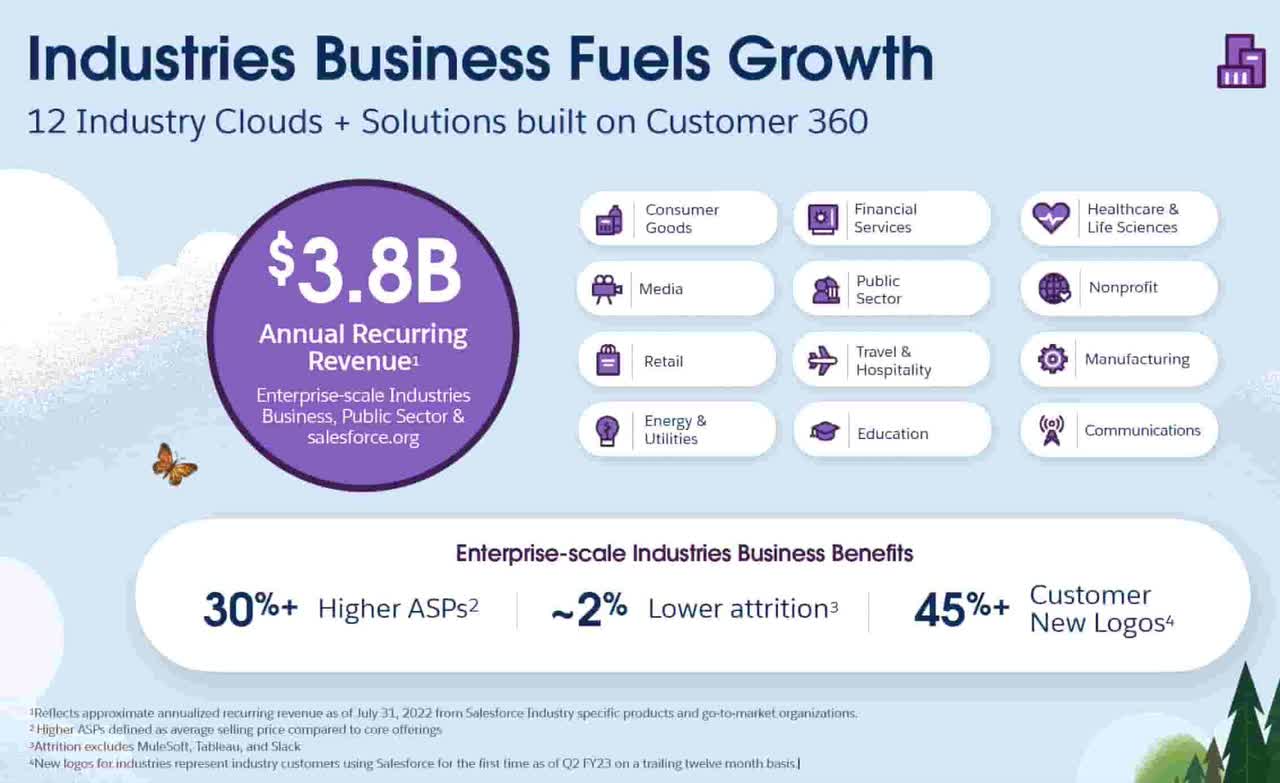
Geographic expansion is the third pillar for Salesforce per CFO Weaver. She states that Hyperforce is a key part of geographic expansion, noting that it will be available in 17 countries by the end of the year. In addition to reliability, stability and compliance, she talks about two other key advantages:
First, data residency. This allows our customers to choose where they are storing their data. And as you know, there are hotspots around the world where this has become absolutely table stakes, and it puts Salesforce at the head of the table. Second, this allows us to move very quickly and agile into new markets. A first-party data center may have taken years, 2 years to set up. We can now move in quickly through this public cloud. Providing another powerful opportunity for growth going forward.
Salesforce has a long history of successful acquisitions; they find the right companies to enhance their ecosystem. There will surely be more opportunities on this front in the future as the ecosystem continues to expand into new areas:
Salesforce Acquisitions (2022 Investor Day)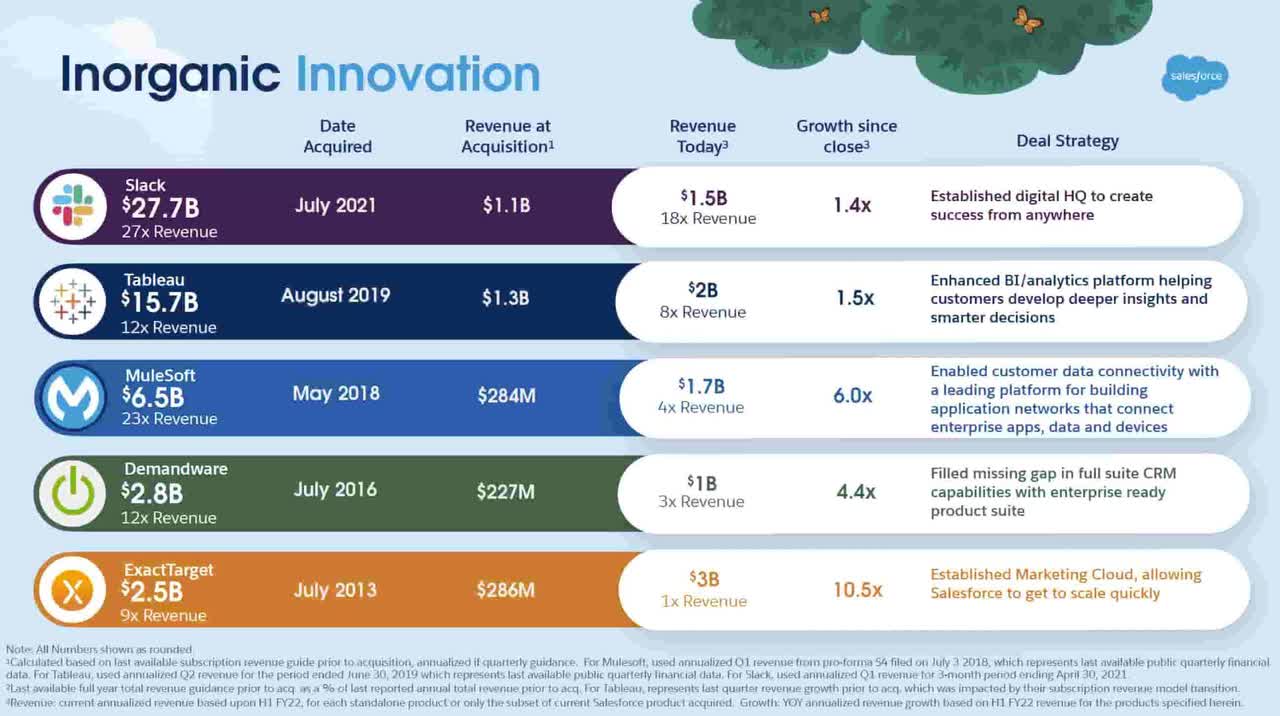
Revenue opportunities are amplified as businesses rely more heavily on cloud-based solutions and Salesforce strengthens their partnerships with AWS. Salesforce and AWS have announced new integrations between AWS SageMaker and the Salesforce platform made possible by Salesforce Genie that allows customers to use SageMaker’s ML alongside Salesforce’s Einstein AI. At the 2022 investor day, Piper Sandler’s Brent Bracelin asked Salesforce Co-Founder Parker Harris about the increased AWS presence at Dreamforce, saying that they were front and center with 30 different sessions. The answer from Co-Founder Harris was telling as he remarked that both Salesforce and AWS are customer-centric. Their engineering teams and business development folks are continually working together:
Our engineering teams and our business development, like everybody is working together, dreaming up ideas with our customers’ feedback to say, great, like Sage Maker, don’t move the data just yet. Sure, your data science could use that. We use some of their services, time is used. We have AWS Connect, so we can share workloads. So if you want to – if you have services that you want to extend Salesforce with and integrate, we want to just make that easy.
Valuation
CFO Weaver got my attention during the investor day presentation when she said they would like to use 30-40% of free cash flow (“FCF”) for buybacks. Co-CEO Bret Taylor said the following regarding capital allocation in the 2Q23 call:
Our capital allocation strategy is simple. We will continue to expand our free cash flow margin as we scale. We will invest in our organic innovation. We will reduce the impact of dilution, both by offsetting stock-based compensation and by maintaining a healthy balance sheet to fund any future M&A.
TTM FCF for July 2022 was $5,681 million which is OCF of $6,396 million [$4,010 million + $6,000 million – $3,614 million] less capex of $715 million [$382 million + $717 million – $384 million]. This compares to TTM FCF for July 2021 which was $5,470 million or [$3,614 million + $4,801 million – $2,288 million] less [$384 million + $710 million – $437 million]. SBC is a real expense such that it lowers adjusted FCF but there are also growth investments that raise adjusted FCF.
TTM revenue through July 2022 was $29,320 million or $15,131 million + $26,492 million – $12,303 million and this is up 24.6% from the annual revenue of $23,539 million or $12,303 million + $21,252 million – $10,016 million a year earlier. The TTM FCF margin through July 2022 was 19.4% which is lower than the 23.2% margin from a year earlier. Hopefully Co-CEO Taylor will explain why the FCF margin based on reported numbers didn’t climb over the last year. Obviously F/X is a headwind. One way in which they plan to improve the FCF margin is to limit sales and marketing (“S&M”). One of the slides in the investor day presentation shows that management plans to drive non-GAAP S&M down to 35% of revenue by FY26. By contrast, it was 38% in FY22 seeing as non-GAAP S&M was $10,024 million based on $11,855 million overall S&M less $727 million amortization of purchased intangibles S&M less $1,104 million SBC S&M while revenue was $26,492 million.
Looking at the non-GAAP reconciliation table in the 2022 investor day presentation, I like to visualize GAAP operating income plus the amortization of purchased intangibles. This combination grew 45% from $1,089 million in FY20 to $1,576 million in FY21. It then grew 38% to $2,172 million in FY22. Based on management’s guidance, I’m optimistic that it will grow 41% to nearly $3,070 million for fiscal 23. Estimates have to be made for FY23; management thinks revenue will be about $31 billion and they expect a GAAP operating income margin of 3.6%. The 2Q23 10-Q shows $535 million in cost of revenues amortization of purchased intangibles plus $469 million in S&M amortization of purchased intangibles for the first half of FY23. It also shows $947 million in expected amortization of purchased intangibles for the remaining six months of FY23:
Amortization of purchased intangibles (Author’s spreadsheet)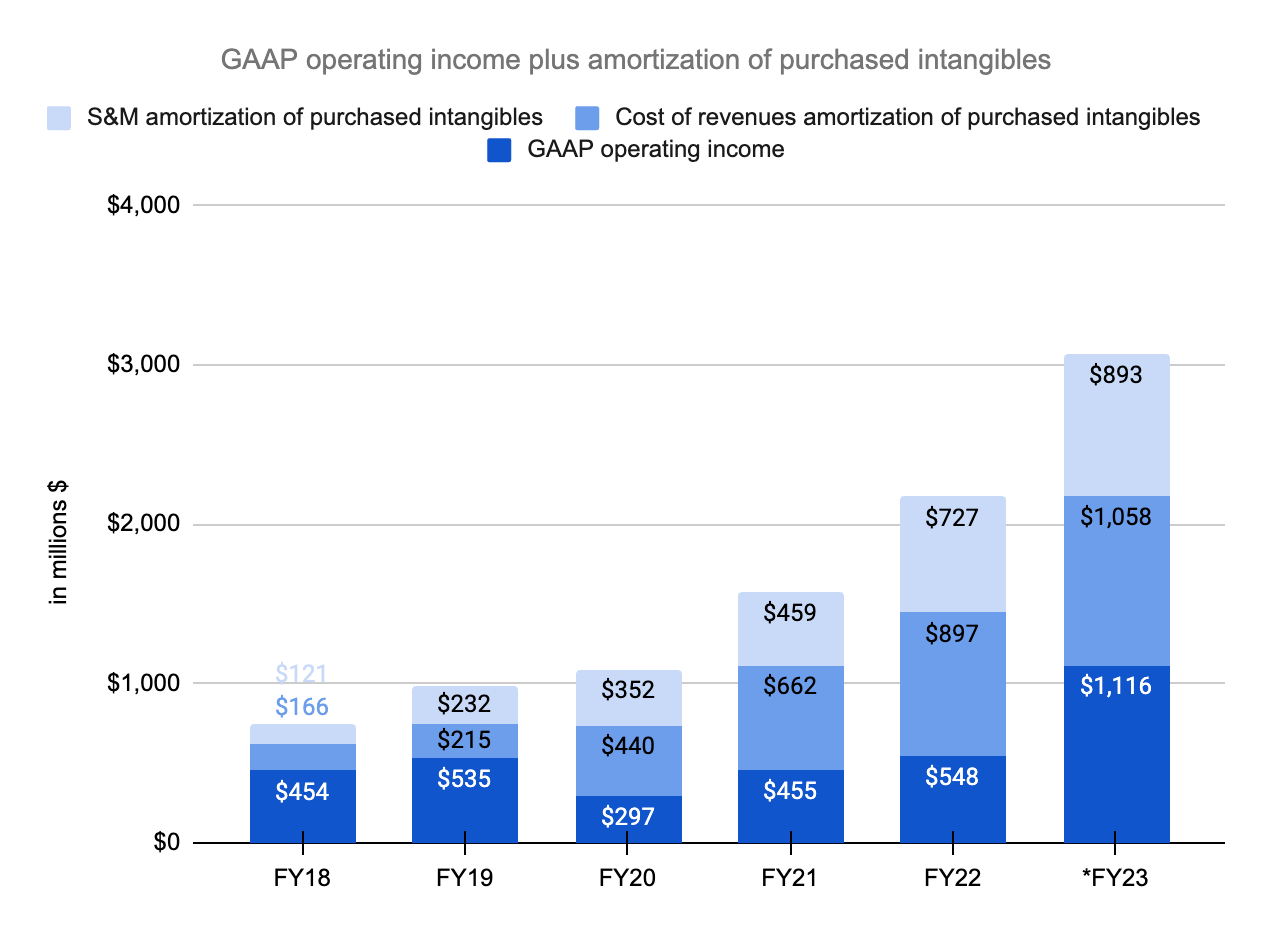
*FY23 numbers above are estimates
Management also adds back stock-based compensation (“SBC”) to their adjusted operating income figure but I think about this differently from them. I treat SBC like a cash expense but there are growth investments including SBC in the S&M income statement line. The FY22 SBC of $2,779 million was composed of $386 million in cost of revenues, $918 million in R&D, $1,104 million in S&M plus $371 million in G&A. I like to stick with GAAP in terms of the way SBC is handled in these income statement lines except for S&M. Management has often said that the cost to book is S&M so they clearly view it as growth. A little more than half of the amortization of purchased intangibles has gone into the cost of revenues income statement line historically and the rest has gone into the S&M line.
Co-CEO Benioff has regularly made comparisons with SAP (SAP) and this continued at the 2022 investor day. He was happy to report that Salesforce had revenue of $7.7 billion in the last quarter which was more than SAP’s quarterly total of $7.5 billion. Looking at FY22 through January 2022, Salesforce had S&M of $11,855 million which was 45% of their $26,492 million revenue. Meanwhile, SAP’s 20-F shows that calendar 2021 S&M was €7,505 million or 27% of their €27,842 million revenue; it was 26% for SAP in 2020 and 28% in 2019. I like to think of what the economics for Salesforce look like if their base S&M is 27% like Salesforce and the rest of S&M is for amortization of purchased intangibles along with growth investments. Here are the numbers for Salesforce if we assume that only the first 27% of revenue is the base S&M. Again, the remainder of S&M is amortization of purchased intangibles along with growth investments:
S&M (Author’s spreadsheet)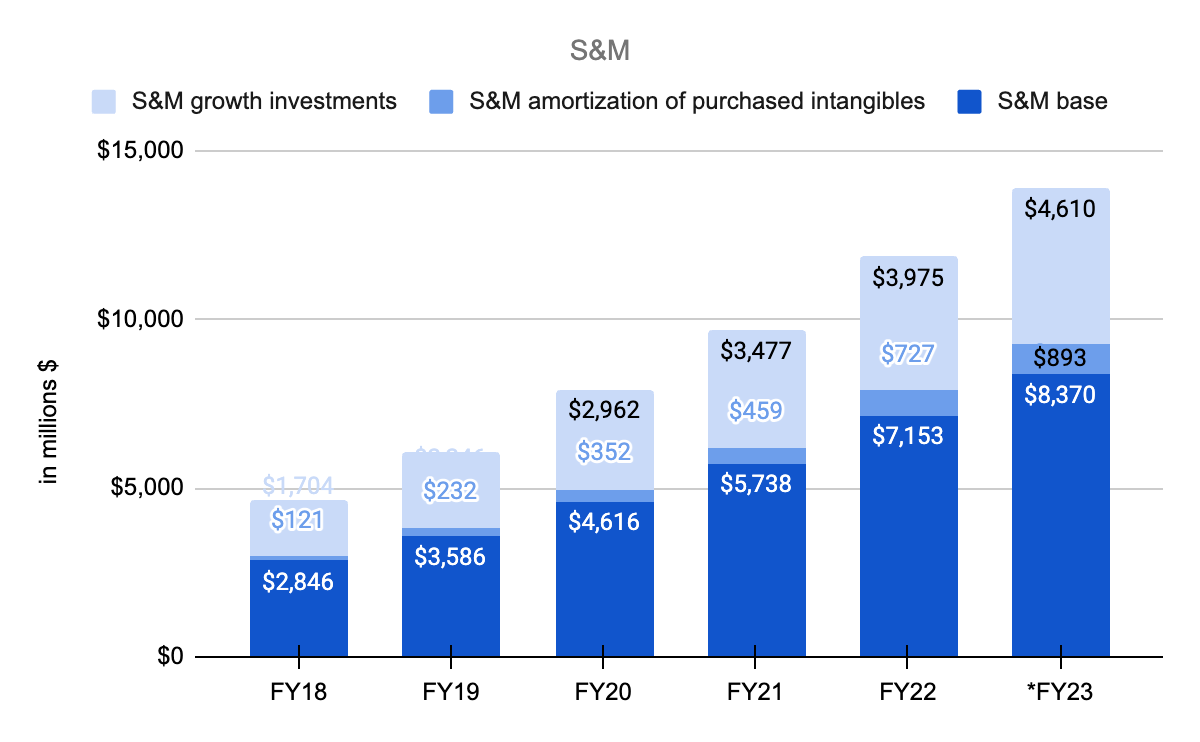
*FY23 numbers above are estimates
Summing up, GAAP operating income plus amortization of purchased intangibles from cost of revenues and S&M climbed from $1.6 billion in FY21 to $2.2 billion in FY22 and I estimate this will increase to about $3.1 billion for FY23. If we add S&M growth investments back in then the adjusted operating income figures are $5.1 billion, $6.1 billion and $7.7 billion, respectively. Including this consideration for growth S&M investments, this adjusted operating margin is 23% for FY22 and an estimated 25% for FY23. Salesforce has been anomalous with their optimism and it has led to sensational results. Given the immense growth, I think a valuation of 20 to 25x this FY23 adjusted operating income estimate is reasonable implying a valuation range of about $155 to $195 billion. This multiple is lower than what I’ve used in the past because interest rates have gone up.
The 2Q23 10-Q shows a billion shares outstanding as of August 24th. Given the September 23rd share price of $147.01, the market cap is $147 billion. The 2Q23 10-Q shows that the enterprise value is fairly close to the market cap as $9.4 billion long-term debt and $2.6 billion lease liabilities are offset by $6.9 billion cash equivalents and $6.6 billion marketable securities. The market cap is less than my valuation range so I think the stock is undervalued.
Be the first to comment