

mikdam/iStock via Getty Images
It’s been a difficult 2022 for investors to say the least.
Charlie Bilello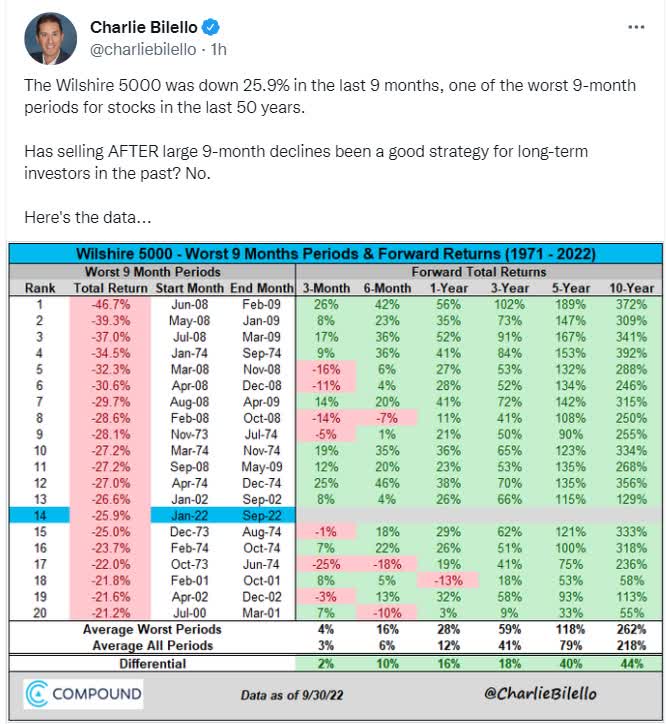
Not because the market is down 26% in the last nine months; that’s merely the 14th worst nine-month return since 1971.
What makes 2022 especially challenging is that it’s the worst bond bear market in US history, by a wide margin.
Charlie Bilello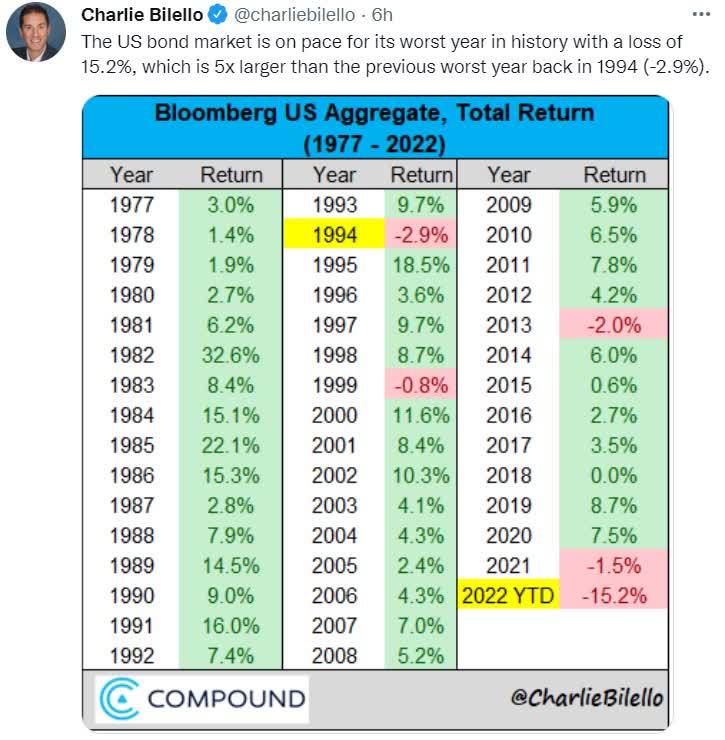
Even in the stagflation hell of the 1970s, bonds delivered positive returns, at least on a nominal basis. But thanks to starting out at record low bond yields, combined with the fastest increase in rates in 40 years, bonds are suffering a historic decline this year.
Daily Shot 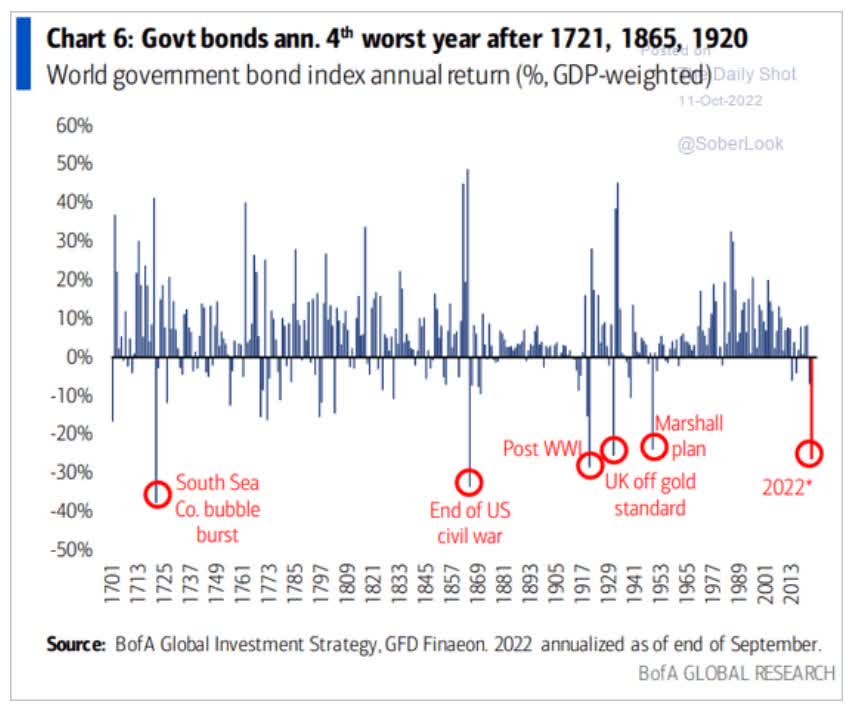
In fact, according to BAC, it’s the 4th worst year for global bonds in history.
The good news is that this creates the potential for a very strange and wonderful 2023 for both stock and bond investors.
According to some analysts, including Bloomberg Intelligence, in 2023 we could see something that almost never happens historically.
- both bonds and stocks could have an epic rally
Why? Because the 2023 recession.
- Bloomberg’s survey of CEOs shows 80% expect a recession next year
- The Conference Board’s CEO survey shows 96% expect a recession next year
How on earth is a recession good for stocks? It’s not, at least fundamentally speaking. However, remember that the stock market is forward looking and almost always bottoms long before recessions end.
Charlie Bilello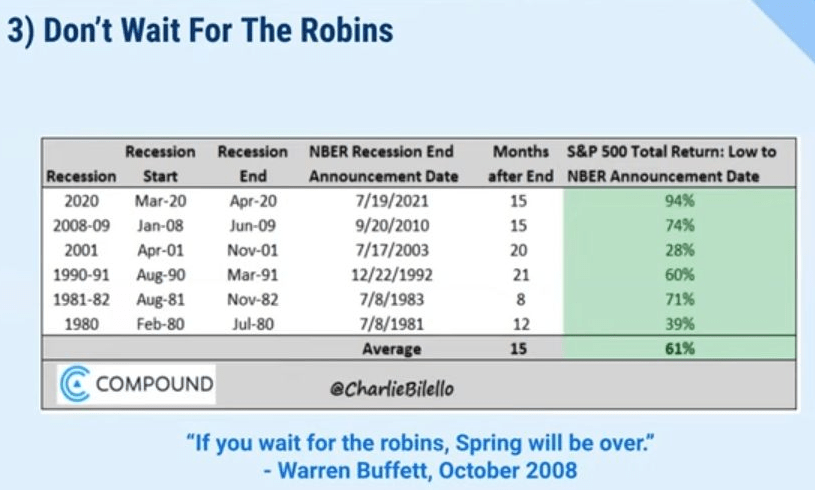
In fact, historically speaking, by the time a recession is officially over, stocks are up 61% off their lows.
If you aren’t willing to buy blue-chips when the market is down 25%, how eager are you going to be when stocks have soared 61% in a matter of months?
What about bonds? Bonds and stocks usually move in opposite directions in bear markets. But this is one of the 8% of times when stocks and bonds are moving in the same direction, because soaring interest rates are the cause for the stock market’s decline.
Daily Shot 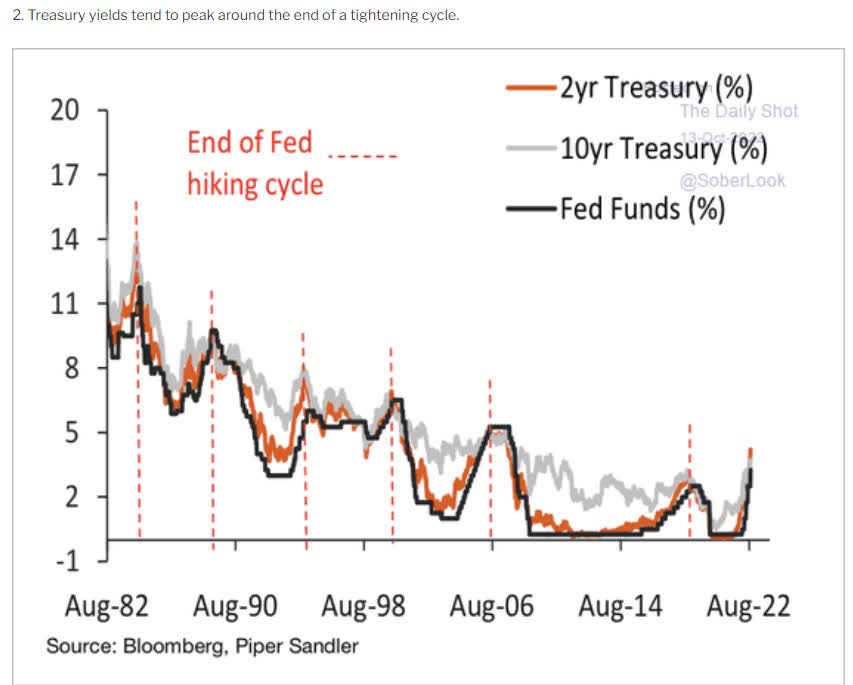
Historically speaking bond yields, including long bonds, peak 1 month before the Fed stops raising rates.
- range of 4 months before to 4 months after
CME Group 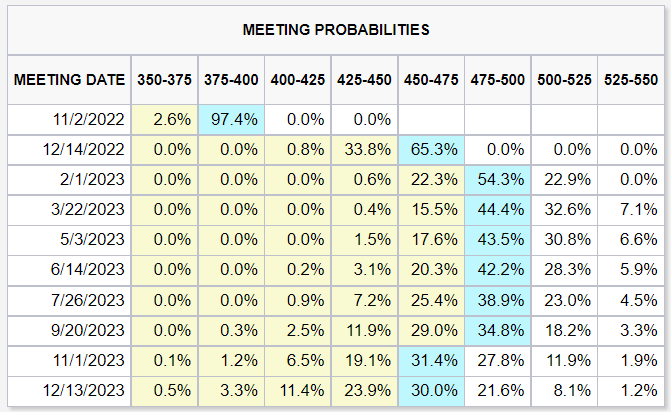
The bond market and the Fed both think that peak rates are coming around February or March 2023.
- historical peak bond yields around late October 2022 to mid July 2023
If stocks can fall far enough in late 2022 to fully price in the 2023 recession this year then the table could be set for an epic 2023 for both stocks and bonds.
- 3,000 to 3,150 S&P 500 is the blue-chip economist consensus for recession bear market bottom for the market
- about 12% to 19% lower from here
Or to put it another way, we’re likely a lot closer to the ultimate bear market bottom than many investors think, and if you sell now you’re likely to deeply regret it in the coming years.
That’s especially true when there are high-yield aristocrat opportunities like Fresenius Medical (FMS), and V.F. Corp (VFC), both of which are more than 50% historically undervalued.
Let me show you why these two high-yield aristocrats aren’t just potentially good buys, or even strong buys, but potentially very strong Buffett-style table-pounding fat pitch buys.
Fresenius Medical Care: The Best Time In Over 20 Years To Buy The World Leader In Dialysis Treatments
Further Reading:
- Fresenius Medical Care: Best Time In 21 Years To Buy This High-Yield Dividend Aristocrat
- a full deep dive report on FMS’s growth potential, risk profile, valuation, and total return potential
Here’s the bottom line up front about FMS.
-
What You Need To Know About Foreign Dividend Withholding Taxes
-
Fresenius is a German company, so US investors face 26.375% dividend withholding taxes on their shares
-
a tax credit recoups this if you fill out the paperwork and own them in taxable accounts
What Fresenius Does
The company’s position as the top dialysis service provider and equipment maker in the world remains symbiotic and unique. Fresenius’ experience operating over 4,100 dialysis clinics around the globe (about 1,000 more than the next-largest player, DaVita) gives it insights into caregiver and patient needs to inform service offerings and product innovation. Fresenius uses clinical observations to develop and then manufacture even better technology to treat ESRD patients. It outfits all its clinics with its own brand of equipment and consumables, which has margin implications related to system costs and operating efficiency for staff. However, other dialysis clinics appreciate Fresenius’ technology as well, and Fresenius claims about 35% market share in dialysis equipment/consumables while serving only 9% of ESRD patients through its global clinics. Especially telling, main rival DaVita remains one of Fresenius’ top product customers.” – Morningstar
FMS is the world-leader in kidney dialysis, a growth market created by the global obesity epidemic and an aging world population.
Unprecedented Times Are Testing Fresenius Medical Care” – Morningstar
Yes, FMS is facing major challenges right now, created by a perfect storm of pandemic disruption, as well as Medicare/Medicaid regulatory changes.
But do you what else is unprecedented?
The Lowest Valuation Since 2001
FAST Graphs, FactSet 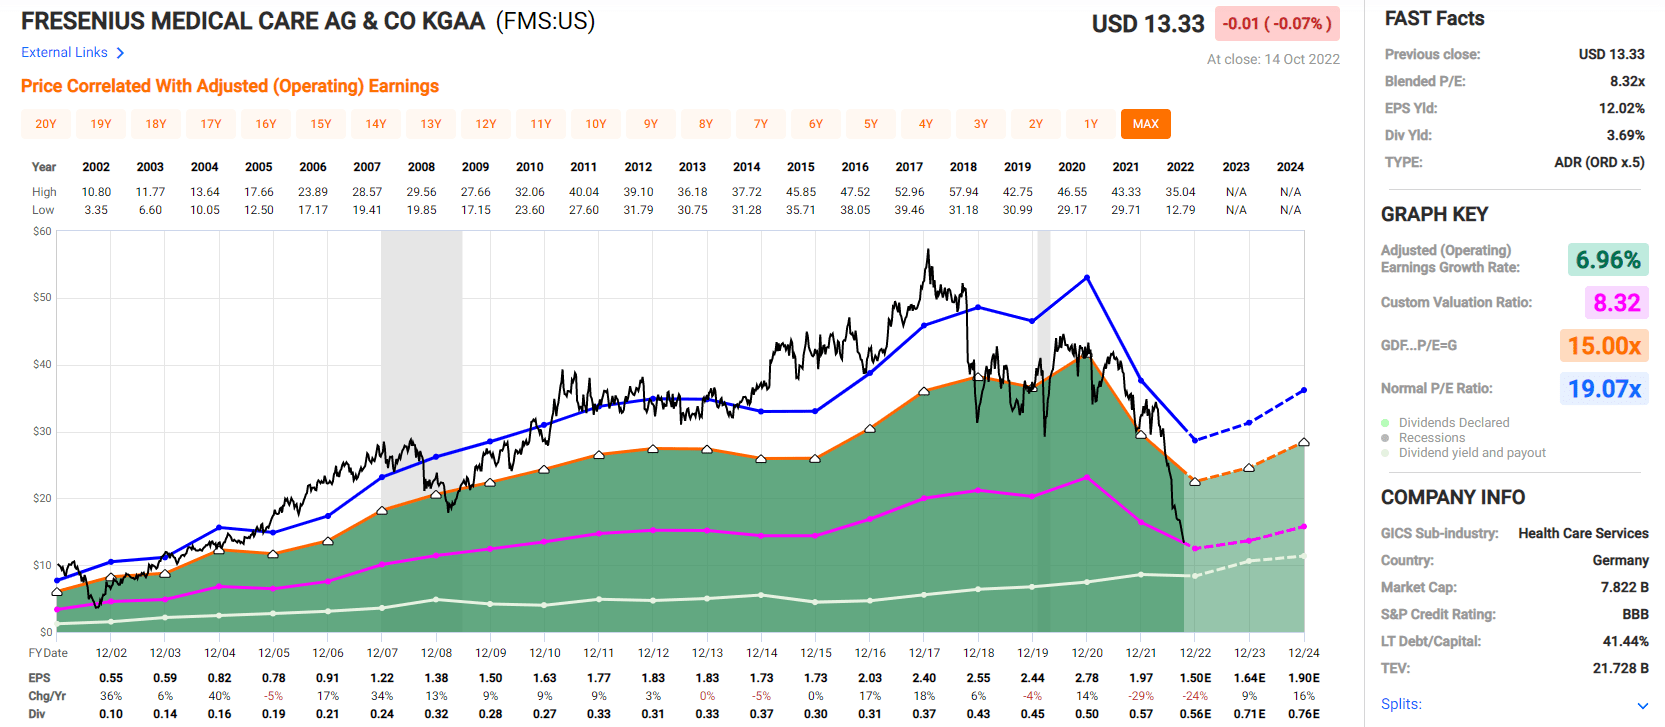
FMS hasn’t been this undervalued in 21 years. Back in 2001 Medicare/Medicaid also were updating their payment formulas and this created havoc for anyone counting them as customers.
- this was the skilled-nursing facility apocalypse
Why am I confident that FMS isn’t the next AIG or Lehman? Why is this a deep value anti-bubble blue-chip and not a value trap?
(Source: FactSet Research Terminal)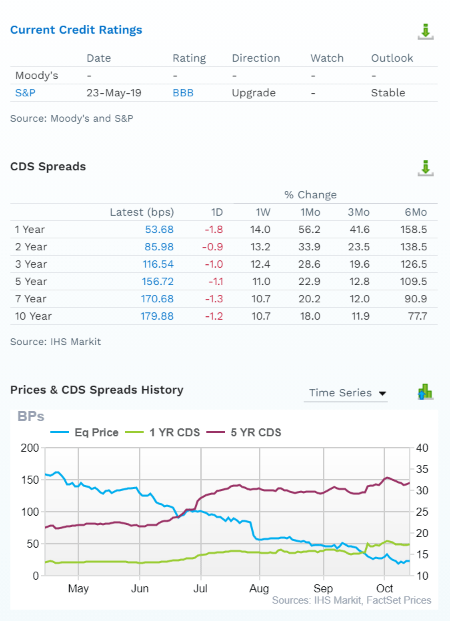
This is a BBB stable rated company with 7.5% fundamental risk according to S&P.
And according to the bond market, as seen in its credit default swaps, it’s actually a BBB+ stable company.
Bond investors are estimating a 5.1% risk of default over 30 years.
Rating agencies aren’t panicking, neither are bond investors, and neither are analysts.
(Source: FactSet Research Terminal)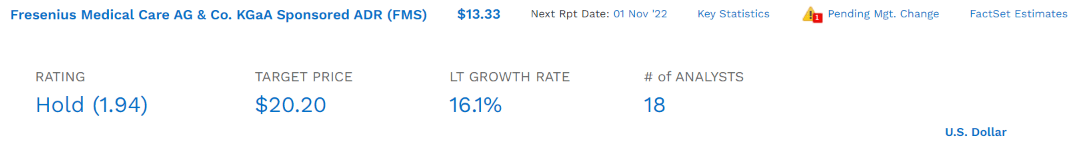
FMS has the best growth outlook in 20 years, and the lowest valuation in 21 years. Do you know what happened the last time this happened for this 25-year growth streak global aristocrat?
Portfolio Visualizer Premium 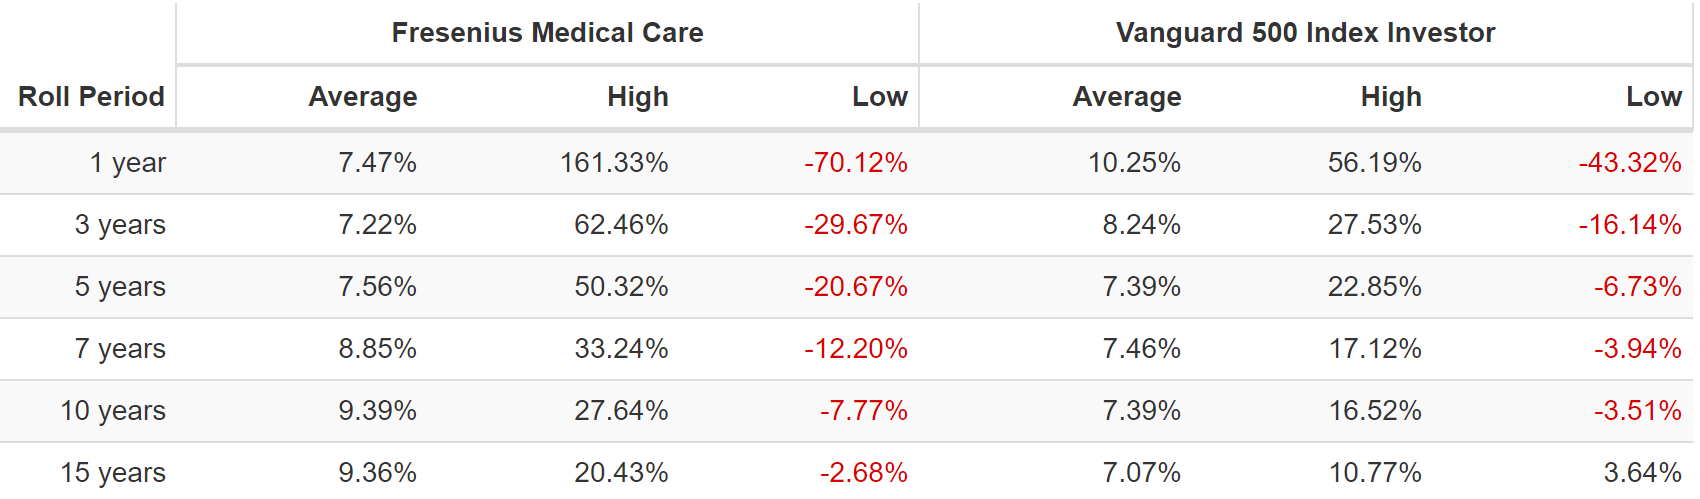
The last time FMS was this undervalued it soared 161% in the next year, and delivered Buffett-like 20% annual returns for the next 15 years.
- 16.3X total return over 15 years
Reasons To Potentially Buy Fresenius Medical Care Today
| Metric | Fresenius Medical |
| Quality | 86% 13/13 Quality Speculative Blue-Chip Global Aristocrat |
| Risk Rating | Low Risk |
| DK Master List Quality Ranking (Out Of 500 Companies) | 151 |
| Quality Percentile | 70% |
| Dividend Growth Streak (Years) | 25 |
| Dividend Yield | 5.3% |
| Dividend Safety Score | 85% |
| Average Recession Dividend Cut Risk | 0.5% |
| Severe Recession Dividend Cut Risk | 1.80% |
| S&P Credit Rating | BBB Stable |
| 30-Year Bankruptcy Risk | 7.50% |
| LT S&P Risk-Management Global Percentile |
94% Exceptional |
| Fair Value | $30.36 |
| Current Price | $13.33 |
| Discount To Fair Value | 56% |
| DK Rating |
Potentially Ultra Value Buffett-Style “Fat Pitch” |
| PE | 8.0 |
| Cash-Adjusted PE | 6.3 |
| Growth Priced In | -4.4% |
| Historical PE | 18 to 19 |
| LT Growth Consensus/Management Guidance | 16.1% |
| PEG Ratio | 0.39 |
| 5-year consensus total return potential |
31% to 36% CAGR |
| Base Case 5-year consensus return potential |
32% CAGR (4X the S&P 500) |
| Consensus 12-month total return forecast | 57% |
| Fundamentally Justified 12-Month Return Potential | 133% |
| LT Consensus Total Return Potential | 21.4% |
| Inflation-Adjusted Consensus LT Return Potential | 19.1% |
| Consensus 10-Year Inflation-Adjusted Total Return Potential (Ignoring Valuation) | 5.75 |
| LT Risk-Adjusted Expected Return | 13.86% |
| LT Risk-And Inflation-Adjusted Return Potential | 11.57% |
| Conservative Years To Double | 6.22 |
(Source: Dividend Kings Zen Research Terminal)
FMS is trading at 8X earnings and 6.3X cash-adjusted earnings, an anti-bubble blue-chip pricing in -4.4% CAGR growth.
- vs. 16% that analysts expect
FMS is such a bargain that analysts think it will deliver 57% returns within a year but a return to fair value would justify a 133% total return within 12-months.
Fresenius 2024 Consensus Total Return Potential
(Source: FAST Graphs, FactSet)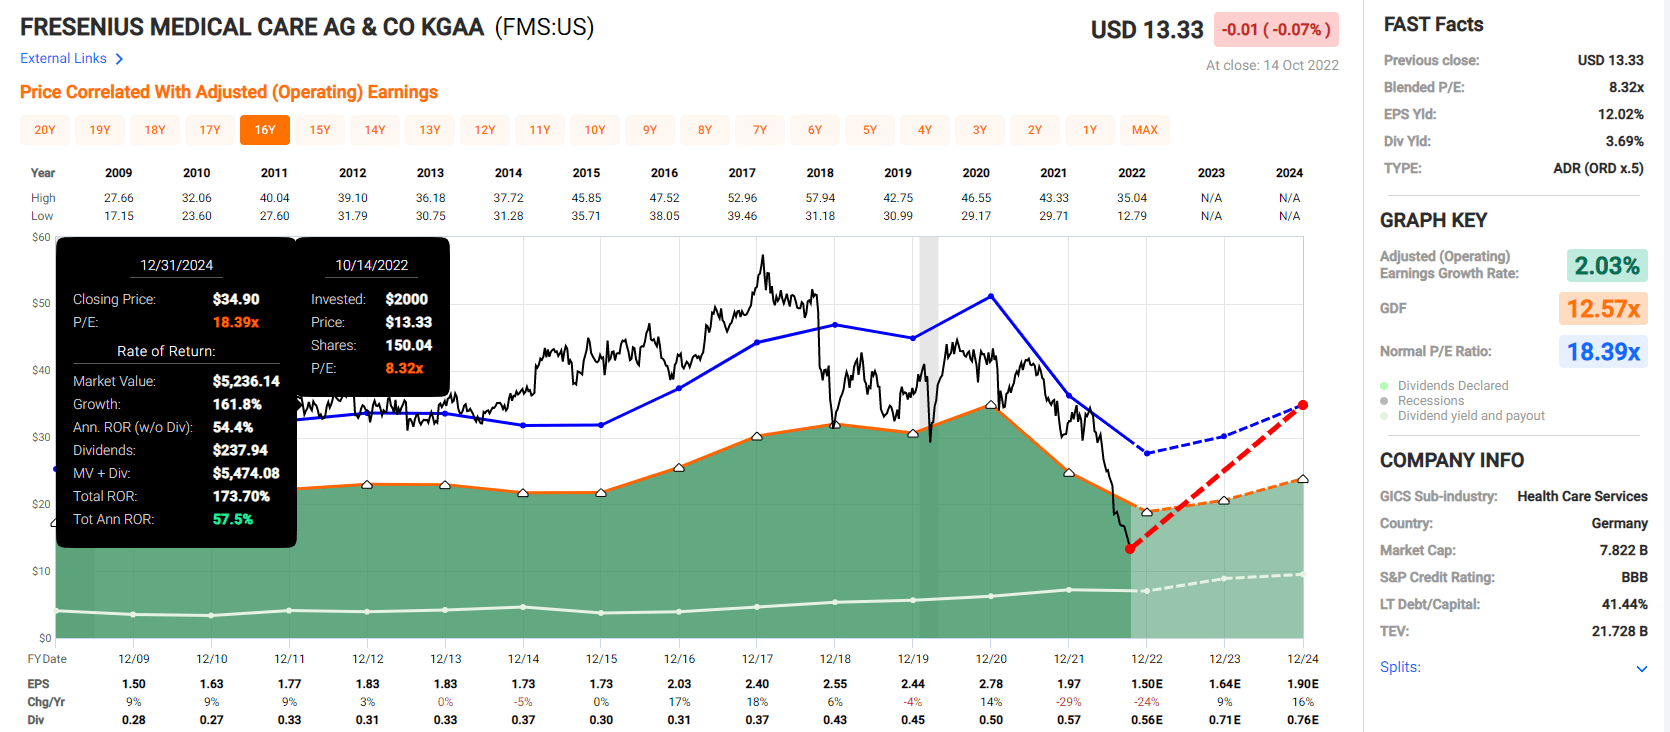
If FMS grows as expected and returns to historical fair value by the end of 2024, investors could nearly triple their money and enjoy 54% annual returns.
Fresenius 2027 Consensus Total Return Potential
(Source: FAST Graphs, FactSet)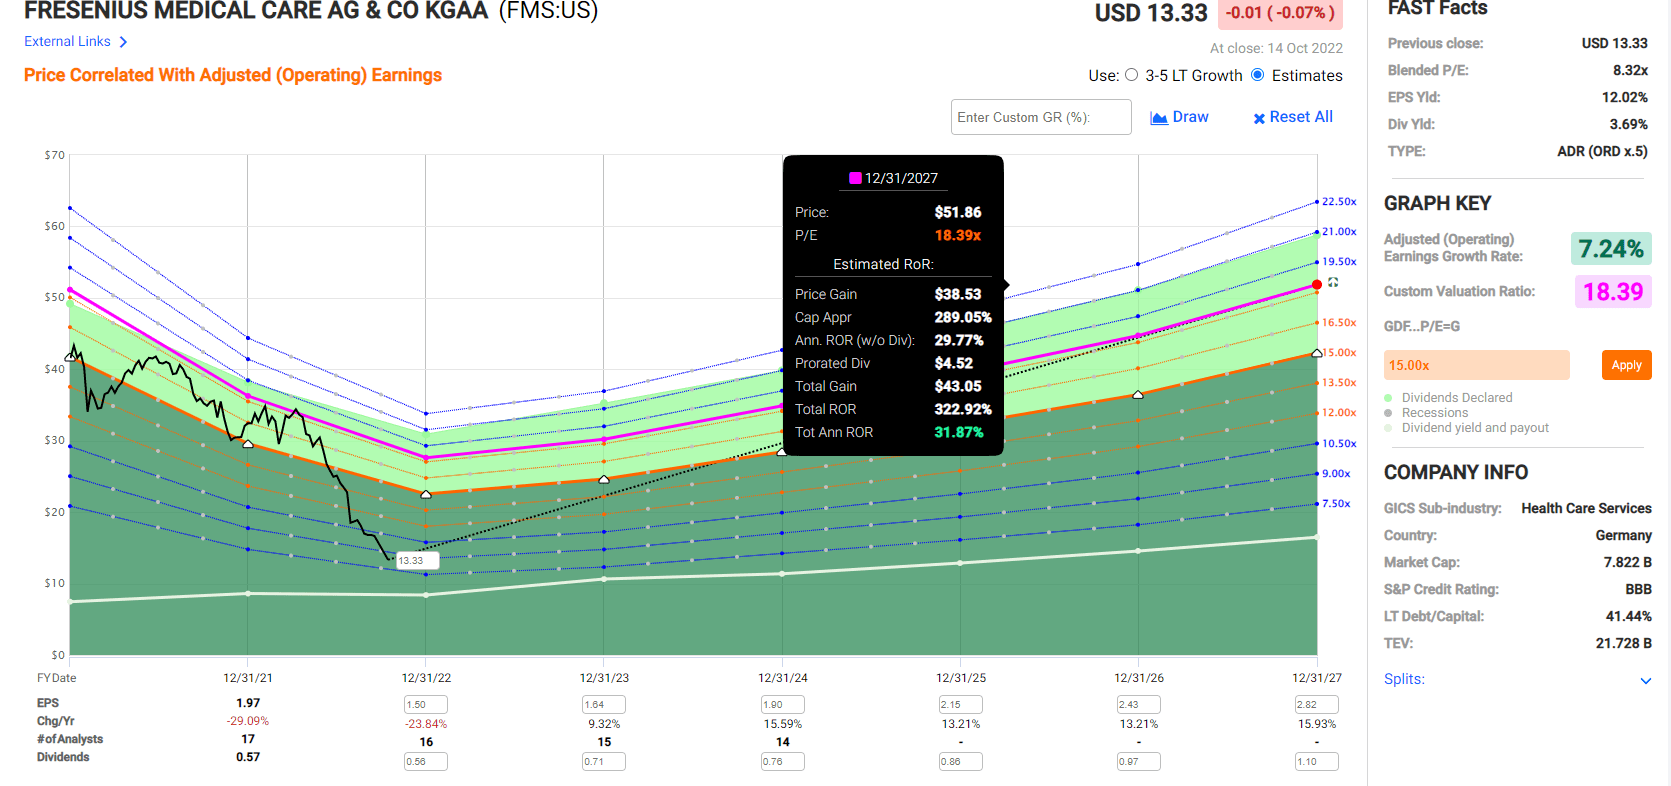
If FMS grows as expected and returns to historical mid-range market-determined fair value investors could enjoy 323% total returns in the next five years, or 32% annually.
Now compare that to the S&P 500.
S&P 2024 Consensus Total Return Potential
(Source: FAST Graphs, FactSet Research)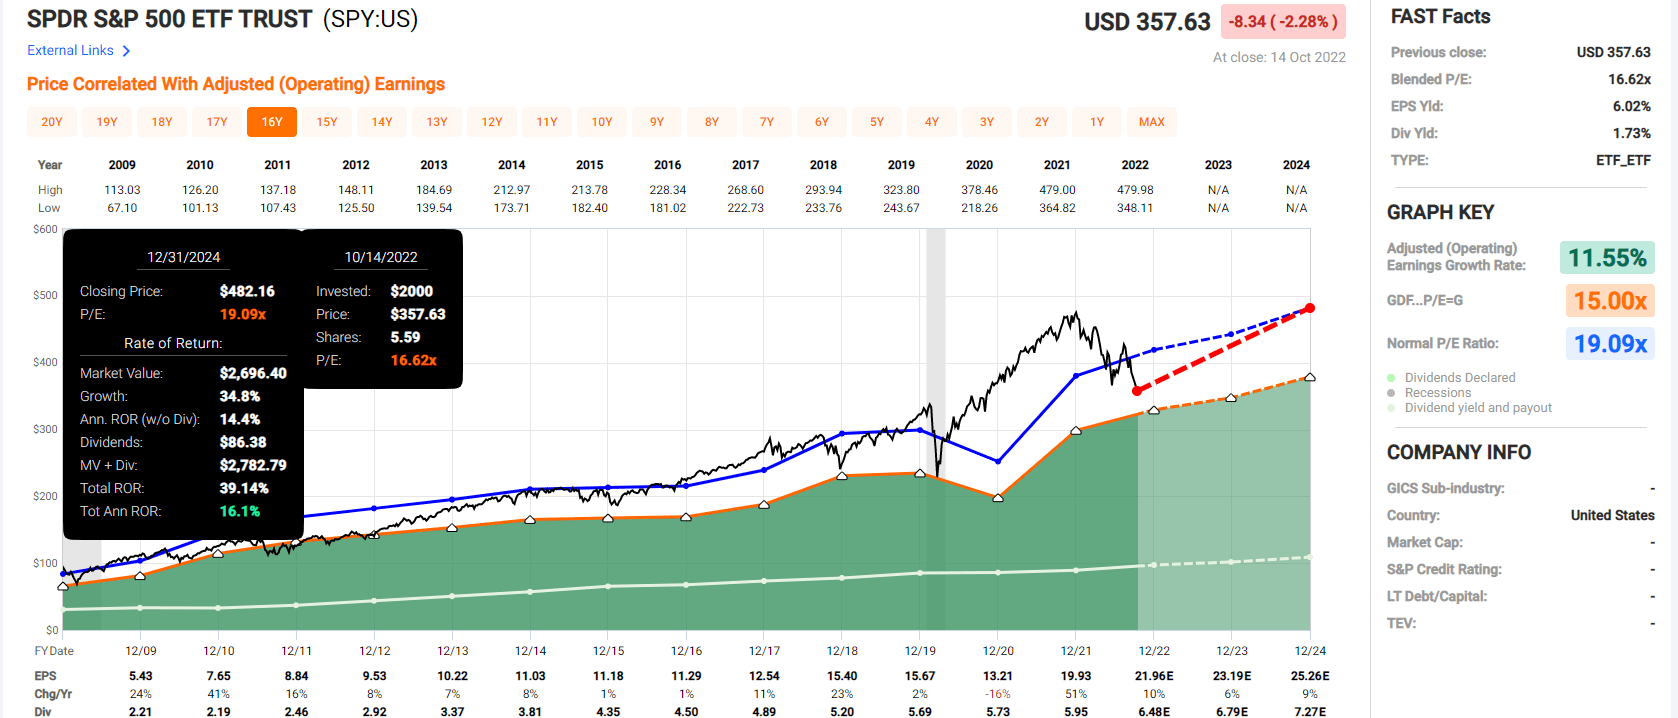
Over the next two years, analysts think the S&P could deliver 40% returns or 16% annually.
- FMS offers over 3X the short-term consensus return potential of the S&P 500
S&P 2027 Consensus Total Return Potential
| Year | Upside Potential By End of That Year | Consensus CAGR Return Potential By End of That Year | Probability-Weighted Return (Annualized) |
Inflation And Risk-Adjusted Expected Returns |
| 2027 | 67.80% | 10.91% | 8.18% | 6.00% |
(Source: DK S&P 500 Valuation Tool)
Analysts think the S&P can deliver 11% annual returns over the next five years.
FMS offers 4X the return potential of the S&P 500 over the next five years.
FMS Corp Investment Decision Tool
DK (Source: Dividend Kings Automated Investment Decision Tool)
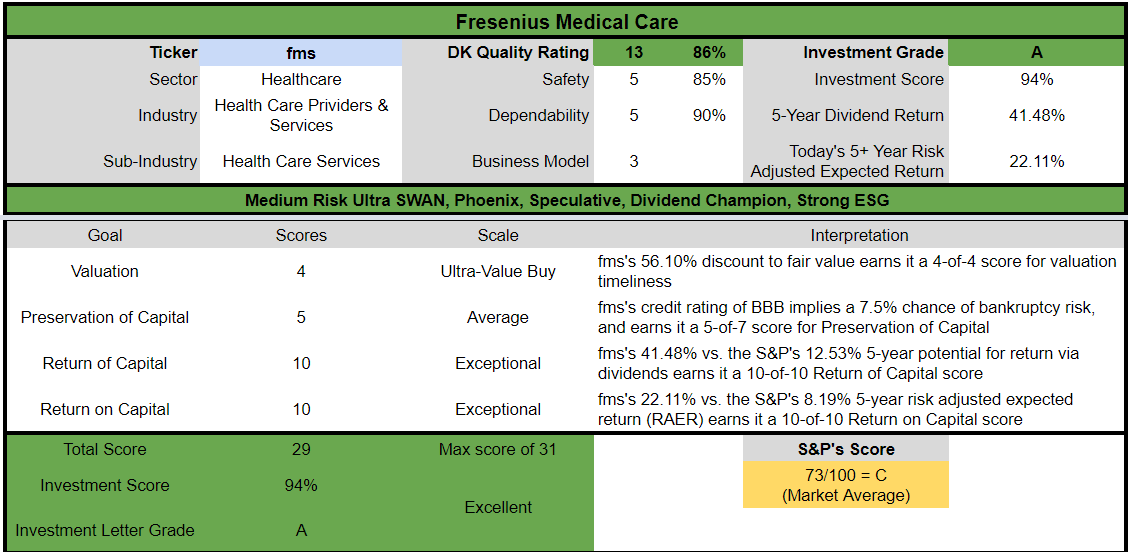
FMS is a potentially excellent high-yield aristocrat anti-bubble opportunity for anyone comfortable with its risk profile. Look at how it compares to the S&P 500.
- 56% discount to fair value vs. 10% S&P = 46% better valuation
- 5.3% very safe yield vs. 1.9% S&P (2.5X higher and much safer yield)
- 110% higher annual long-term return potential
- 3X higher risk-adjusted expected returns
- over 3.5X the consensus 5-year income
V.F. Corp: The Highest Yield In Over 25 Years Makes This A No-Brainer Buy
Further Reading:
- 4 Reasons Why V.F. Corporation Is One Of The Best Dividend Aristocrat Bargains You Can Buy
- a full deep dive report on VFC’s growth potential, risk profile, valuation, and total return potential
What V.F. Corp Does
Through dispositions and additions, VF has built a portfolio of strong brands in multiple apparel categories. We view the three brands that account for about 80% its sales (Vans, Timberland, and The North Face) as supporting VF’s narrow moat based on a brand intangible asset. Despite economic concerns, we believe VF will grow faster than most competitors in the long run and maintain its competitive edge.” – Morningstar
VFC is a leader in the $500 billion life-style apparel industry, and a master of smart acquisitions that have helped it to drive steady growth in earnings and dividends.
- 50-year dividend growth streak = dividend king
VFC has been falling like a brick all year, but especially in recent weeks.
- supply chain disruption
- 2023 recession
- management downgraded guidance
It’s been a perfect storm of negative catalysts for VFC which has resulted in the worst bear market in 32 years.
YCharts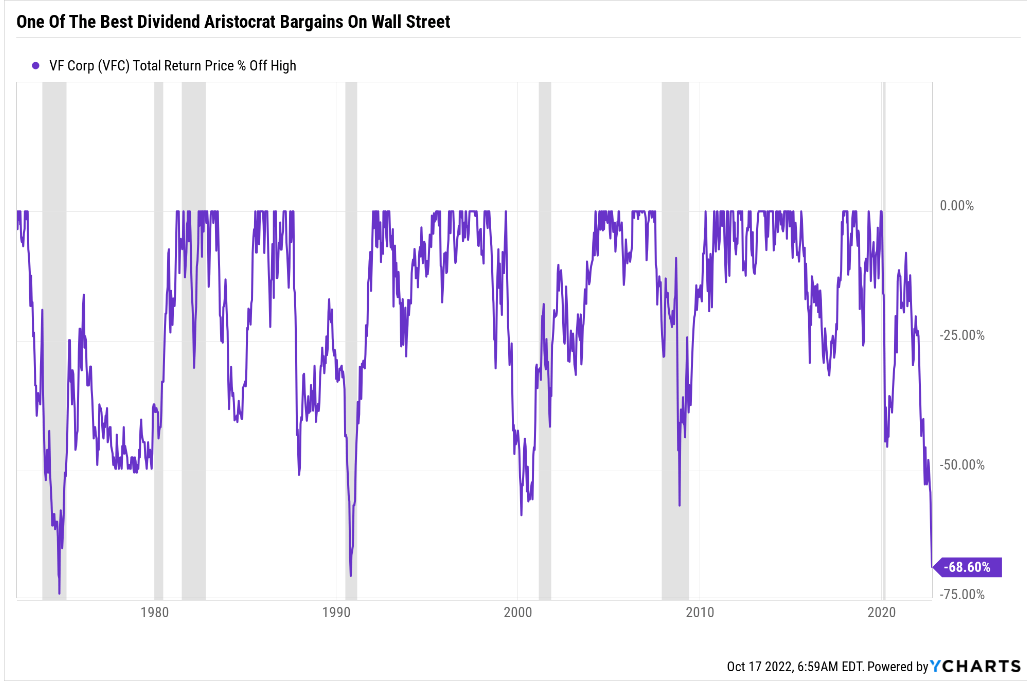
Literally, VFC has fallen more in this bear market than it did in the Pandemic or Great Recession.
The Lowest PE Since The Great Recession
FAST Graphs, FactSet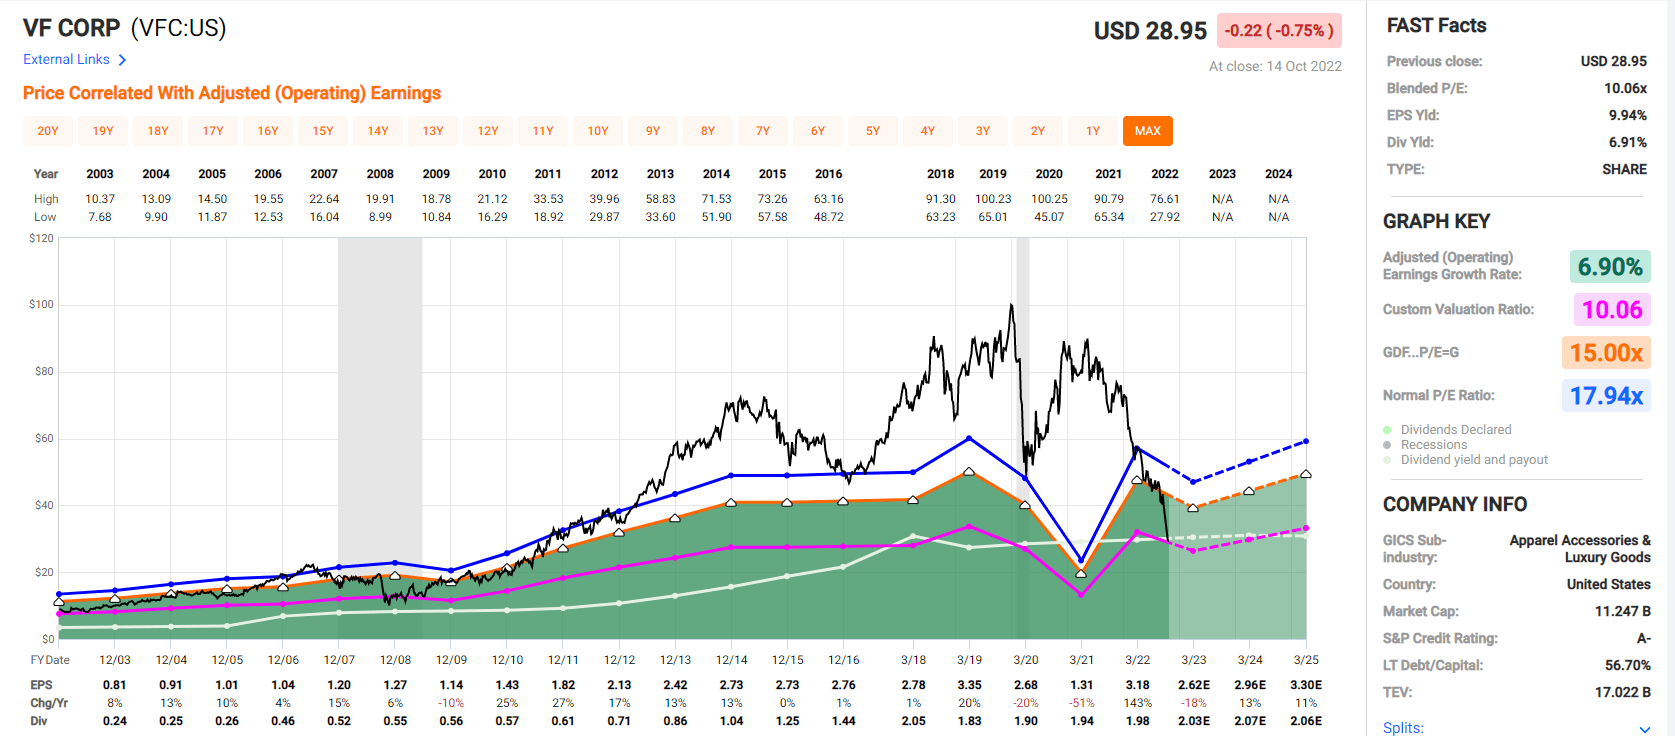
Does an 18% earnings decline in this recession justify a 70% price collapse? For an A-rated dividend king with some of the most popular brands in its industry?
The Highest Yield In 31 Years
YCharts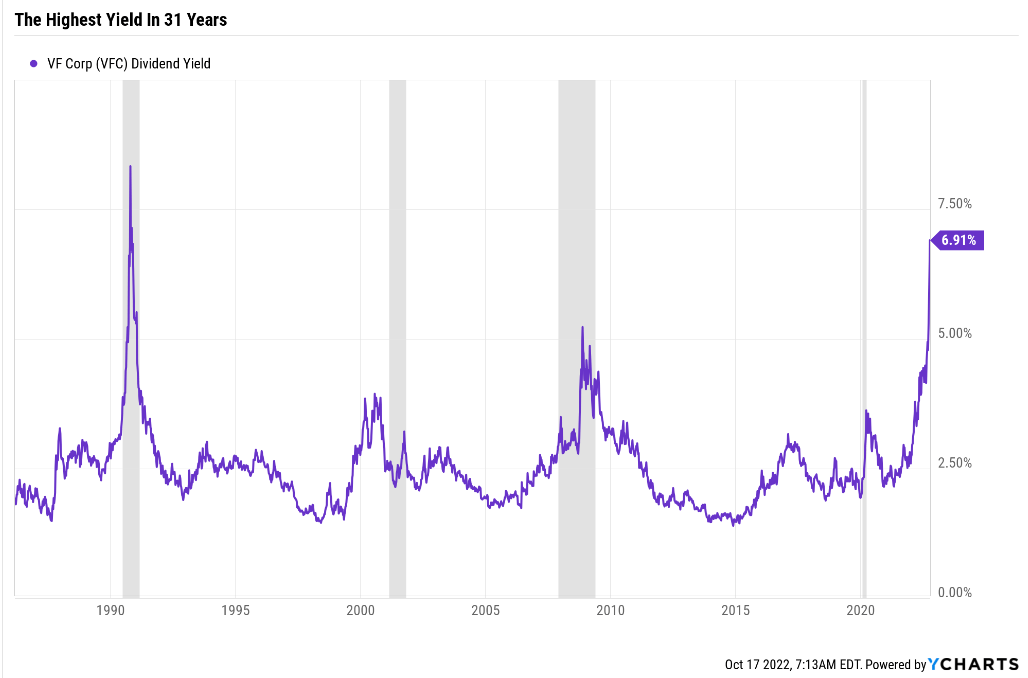
VFC’s yield is higher than it was in the Great Recession.
In fact, it’s the highest yield in 31 years.
Does this make sense? Is it justified by fundamentals? I think not. Neither do the rating agencies or bond market.
FactSet Research Terminal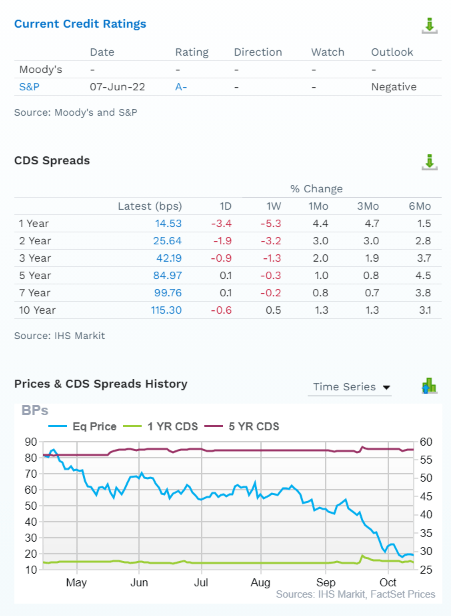
This is an A-rated company that the bond market agrees has a 3.45% long-term default risk. Its fundamental risk (of losing all your money) has been rock steady the entire time its stock price has been crashing.
- this isn’t what value traps look like
VFC Rolling Returns Since 1985
Portfolio Visualizer Premium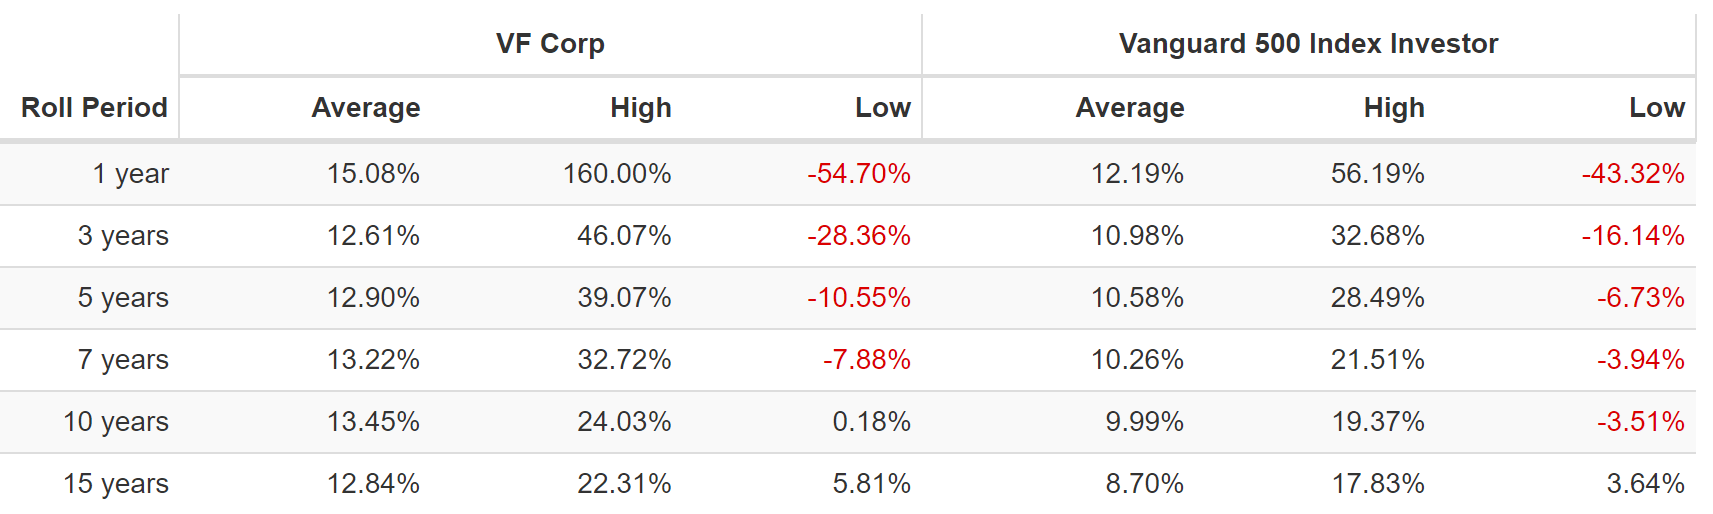
The last time VFC was this undervalued it delivered a 160% total return within a year.
After the Great Recession it delivered 24% annual returns for the next decade.
- 8.6X returns over 10 years
After the 1991 recession, the last time it fell 70%, it delivered 22% annual returns for the next 15 years.
- 20.5X returns over 15 years
Reasons To Potentially Buy V.F. Corp Today
| Metric | V.F. Corp |
| Quality | 80% 11/13 Quality SWAN (Sleep Well At Night) Dividend King |
| Risk Rating | Low Risk |
| DK Master List Quality Ranking (Out Of 500 Companies) | 270 |
| Quality Percentile | 47% |
| Dividend Growth Streak (Years) | 50 |
| Dividend Yield | 6.9% |
| Dividend Safety Score | 79% |
| Average Recession Dividend Cut Risk | 1.0% |
| Severe Recession Dividend Cut Risk | 2.10% |
| S&P Credit Rating |
A- negative outlook |
| 30-Year Bankruptcy Risk | 2.50% |
| LT S&P Risk-Management Global Percentile |
67% Above-Average |
| Fair Value | $67.65 |
| Current Price | $28.95 |
| Discount To Fair Value | 57% |
| DK Rating |
Potentially Ultra Value Buffett-Style “Fat Pitch” |
| PE | 10.1 |
| Cash-Adjusted PE | 9.7 |
| Growth Priced In | 2.4% |
| Historical PE | 18 to 22.5 |
| LT Growth Consensus/Management Guidance | 6.5% |
| 5-year consensus total return potential |
18% to 25% CAGR |
| Base Case 5-year consensus return potential |
22% CAGR (3X the S&P 500) |
| Consensus 12-month total return forecast | 39% |
| Fundamentally Justified 12-Month Return Potential | 141% |
| LT Consensus Total Return Potential | 13.4% |
| Inflation-Adjusted Consensus LT Return Potential | 11.1% |
| Consensus 10-Year Inflation-Adjusted Total Return Potential (Ignoring Valuation) | 2.87 |
| LT Risk-Adjusted Expected Return | 9.15% |
| LT Risk-And Inflation-Adjusted Return Potential | 6.86% |
| Conservative Years To Double | 10.50 vs 15.2 S&P 500 |
(Source: Dividend Kings Zen Research Terminal)
VFC is trading at 9.7X cash-adjusted earnings and is 56% historically undervalued. Analysts expect a 39% gain within a year, but 141% total returns are fundamentally justified in my opinion.
V.F. Corp 2025 Consensus Total Return Potential
(Source: FAST Graphs, FactSet)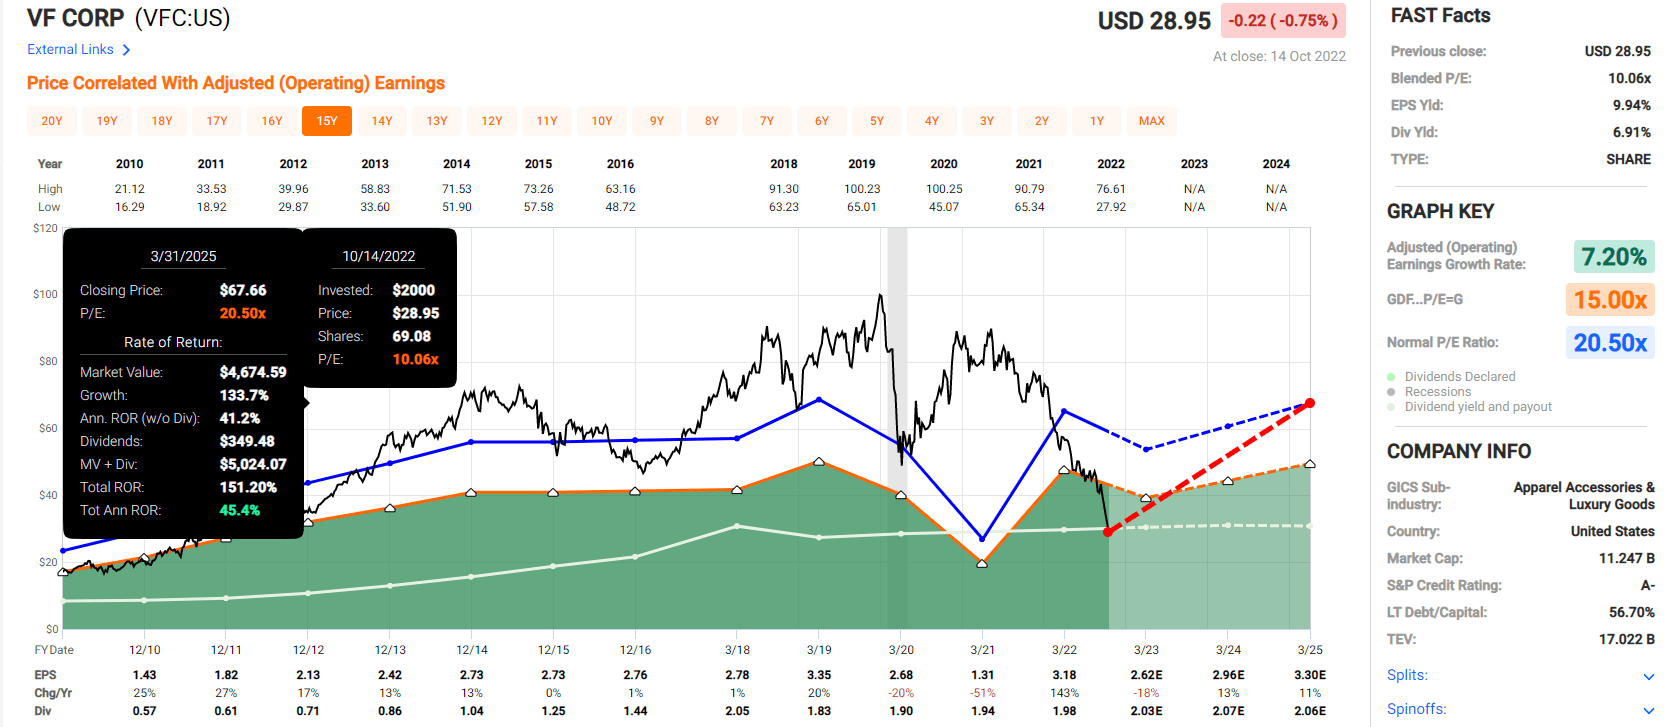
If VFC grows as expected and returns to historical mid-range fair value then it could deliver 150% total returns within 2.5 years, or 45% annually.
- almost 4X the return potential of the S&P 500
V.F. Corp 2028 Consensus Total Return Potential
(Source: FAST Graphs, FactSet)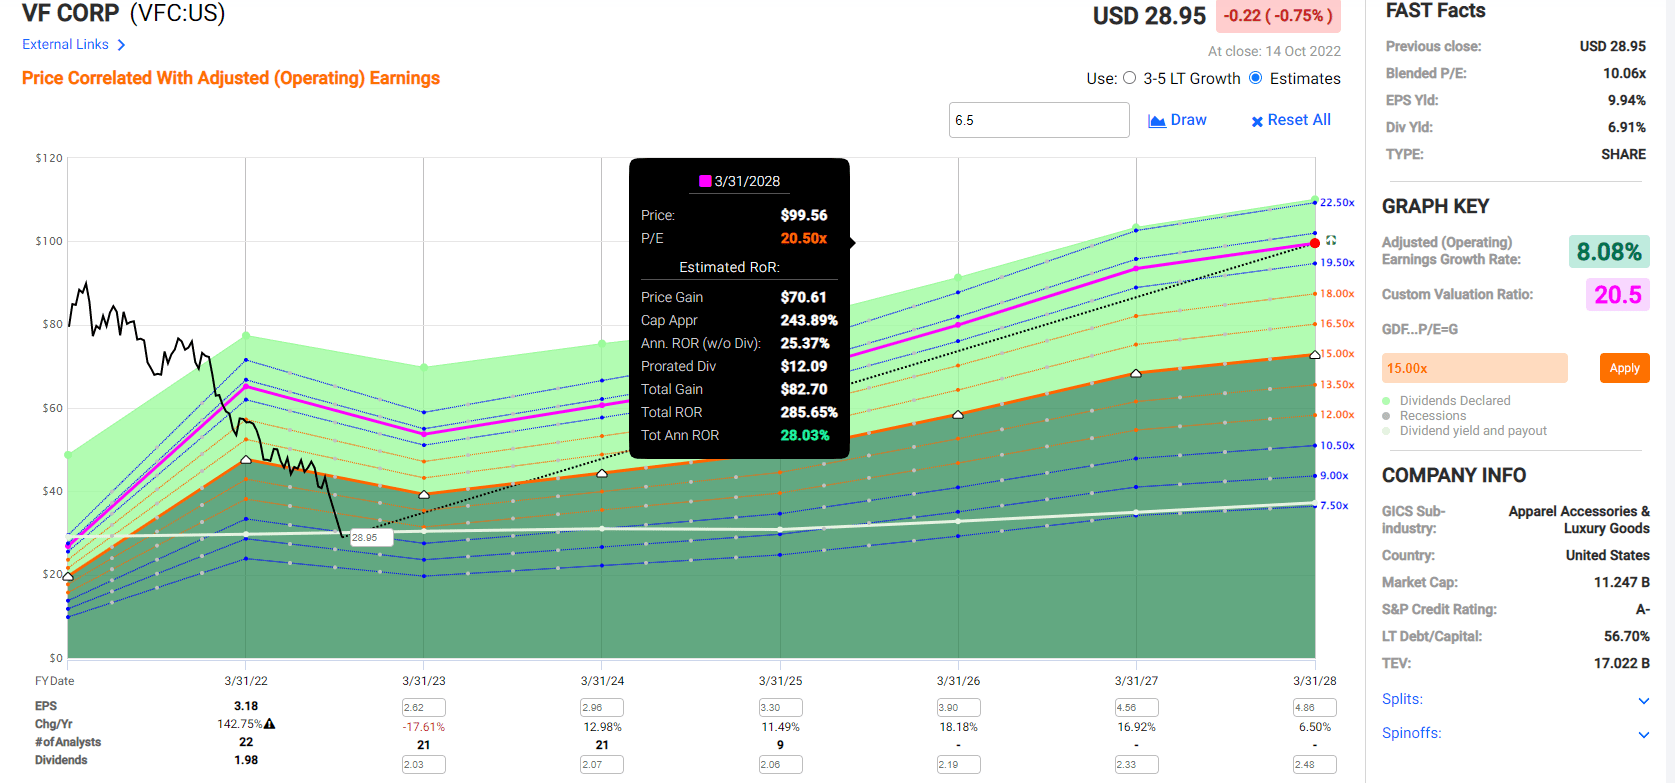
VFC could nearly quadruple over the next five years, delivering Buffett-like 28% annual returns.
- over 3X more than the S&P 500
V.F. Corp Investment Decision Tool
DK (Source: Dividend Kings Automated Investment Decision Tool) 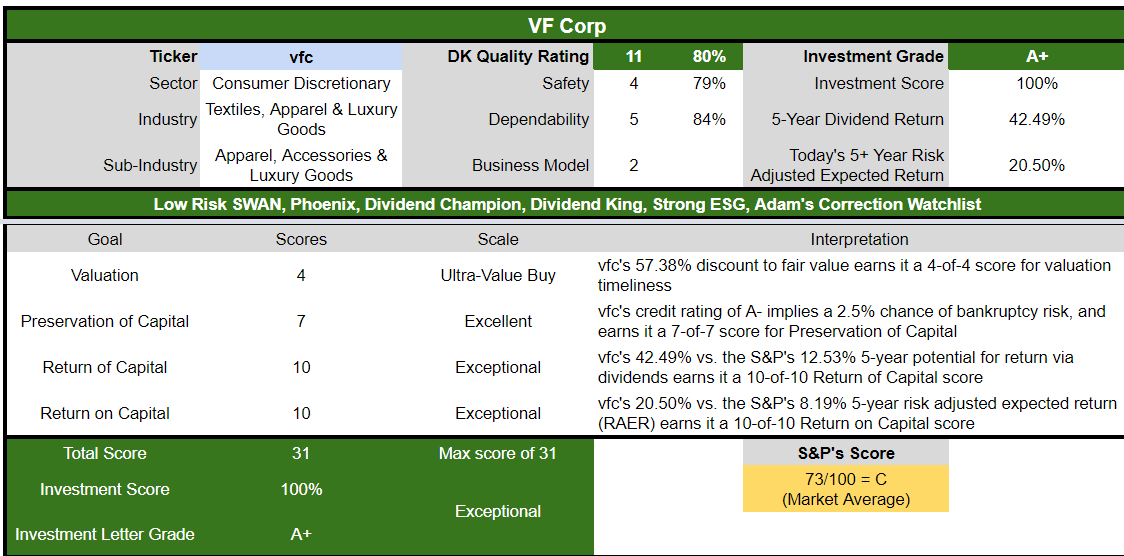
VFC is as close to a perfect ultra-yield aristocrat anti-bubble opportunity as exists for anyone comfortable with its risk profile. Look at how it compares to the S&P 500.
- 57% discount to fair value vs. 10% S&P = 67% better valuation
- 6.9% very safe yield vs. 1.9% S&P (3X higher and much safer yield)
- 30% higher annual long-term return potential
- over 2X higher risk-adjusted expected returns
- over 3X the consensus 5-year income
Bottom Line: These High-Yield Aristocrat Bargains Are Screaming Buys
I’m not a market timer and my goal isn’t to help you nail the bottom in any particular stock.
- over 30+ years, 97% of stock returns are a function of pure fundamentals, not luck
- in the short term; luck is 25X as powerful as fundamentals
- in the long term, fundamentals are 33X as powerful as luck
My goal is to help you make reasonable and prudent long-term decisions on the world’s best companies.
Today FMS and VFC are the two most undervalued dividend aristocrats on Wall Street.
- nearly 60% historically undervalued
- the best valuations in 21 to 31 years
No company is right for everyone, but if you like these businesses and don’t buy them today, then you’ll likely deeply regret it.
Be greedy when others are fearful and fearful when others are greedy” – Warren Buffett
Everyone likes to quote Buffett and say they want to be “greedy when others are fearful”. Well, for these two high-yield aristocrats, this is what terror looks like.
It’s also what potentially life-changing opportunity looks like. Remember that the last time these aristocrats were this undervalued they delivered 6X to 20X returns over the next 10 to 20 years.
- 2.5% or less max risk cap recommendation on FMS
- 10% or less max risk cap recommendation on VFC
For anyone buying FMS and VFC today, within a diversified and prudently risk-managed portfolio, I can say with 80% statistical confidence that you’ll be glad you did in 5+ years.
In fact, in 10+ years you’ll likely feel like a stock market genius. Because, while there are no risk-free companies, the margins of safety on FMS and VFC are so high, I think that you’re being more than adequately compensated for their respective risk profiles.
Be the first to comment