jetcityimage/iStock Editorial via Getty Images
Thermo Fisher Scientific (NYSE:TMO) is a leader in the scientific equipment space specifically with a focus on healthcare. TMO is organized in four segments (1) Life Sciences Solutions, (2) Specialty Diagnostics, (3) Analytical Instruments, and (4) Laboratory Products and BioPharma Services.
TMO Segments (TMO Investor Relations)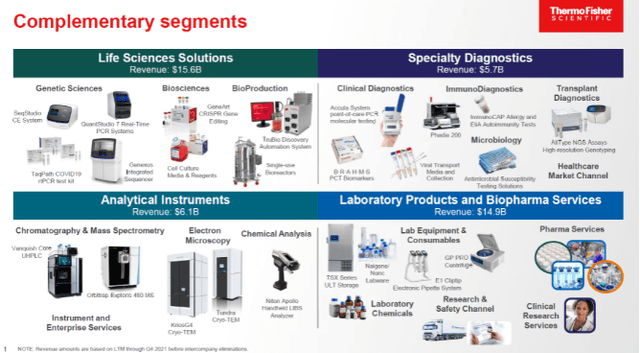
Their hands are in effectively every part of the R&D process for the global healthcare marketplace. If you’re bullish on healthcare R&D spending which I am as diagnostics and new therapies become more and more specialized, then TMO is poised to benefit on that spending.
TMO Revenue Profile (TMO Investor Relations)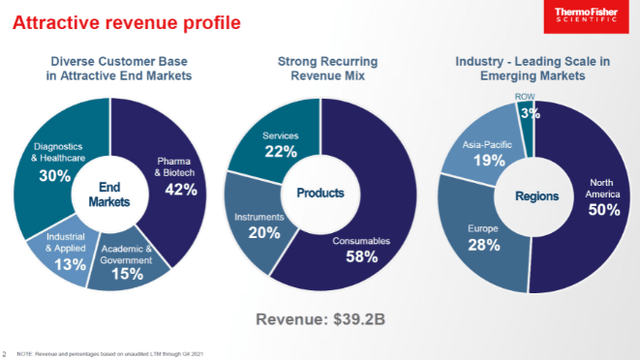
TMO’s revenues come from just about every sector of the healthcare R&D process. TMO also generates plenty of recurring revenues in the form of both consumables for their various equipment as well as servicing and maintenance.
Dividend History
Some of the best investments for dividend growth investors are those businesses that are just starting on their dividend growth journey. Typically those companies come with low payout ratios that can allow management to grow the dividend in excess of growth of the underlying business fundamentals.
Thermo Fisher Scientific Dividend History (Thermo Fisher Scientific Investor Relations)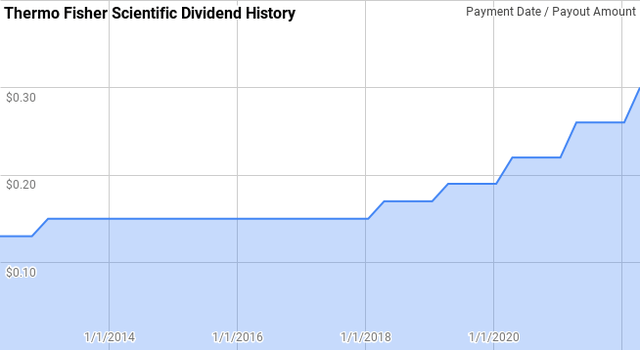
TMO doesn’t have the lengthiest of dividend growth streaks at just 5 years young. In fact after initiating a dividend in 2012 then raising in 2013 dividend growth took a 4 year hiatus. Since then TMO’s dividend growth has been fantastic coming in greater than 10% each year.
Dating back to 2012 TMO’s year over year dividend growth has ranged from 0.0% to 18.2% with an average of 8.6% and a median of 11.4%.
Over that same period the 5-year annualized dividend growth from TMO has ranged from 2.1% to 14.9% with an average of 7.3% and a median of 6.4%.
Considering that includes 4 years of no growth that’s rather impressive numbers.
The rolling 1-, 3-, and 5-year annualized dividend growth rates since 2012 for TMO can be found in the following table.
| Year | Annual Dividend | 1 Year | 3 Year | 5 Year |
| 2012 | $0.54 | |||
| 2013 | $0.60 | 11.11% | ||
| 2014 | $0.60 | 0.00% | ||
| 2015 | $0.60 | 0.00% | 3.57% | |
| 2016 | $0.600 | 0.00% | 0.00% | |
| 2017 | $0.600 | 0.00% | 0.00% | 2.13% |
| 2018 | $0.680 | 13.33% | 4.26% | 2.53% |
| 2019 | $0.760 | 11.76% | 8.20% | 4.84% |
| 2020 | $0.880 | 15.79% | 13.62% | 7.96% |
| 2021 | $1.040 | 18.18% | 15.21% | 11.63% |
| 2022 | $1.200 | 15.38% | 16.45% | 14.87% |
*Table Source: Author; Data Source: Thermo Fisher Scientific Investor Relations
The dividend payout ratio gives you two critical pieces of information. One how much cushion there is between the dividend and profits or free cash flow or in other words how susceptible the dividend payment is for the inevitable hiccups the business will face. Two, it sheds like on the potential dividend growth as a lower payout ratio gives room for the dividend to expand faster than the growth of the underlying business.
TMO Dividend Payout Ratios (TMO SEC filings)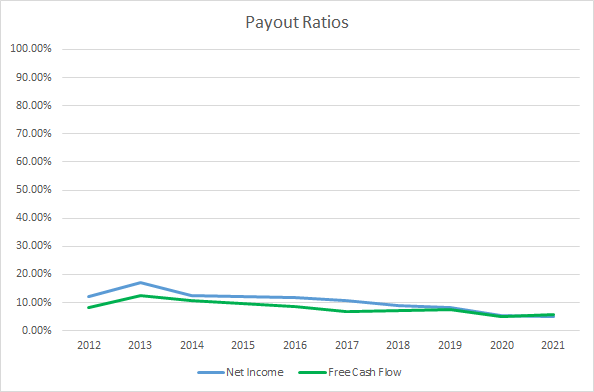
TMO’s payout ratio, along with it’s dividend yield, is pretty microscopic. Over the last 10 years TMO’s net income payout ratio has averaged just 10.4% with the 5-year average at 7.6%. Likewise the average free cash flow payout ratios are 8.1% and 6.4%, respectively.
TMO’s dividend is well covered by business fundamentals, at least historically, and is likely to grow from here.
Quantitative Quality
In conjunction with using a company’s dividend history I examine many other financial metrics before I become comfortable with a business. I want to see how the business has fared from a growth and profitability standpoint as well as how strong the balance sheet is.
TMO Revenue Profits and Cash Flow (TMO SEC flings)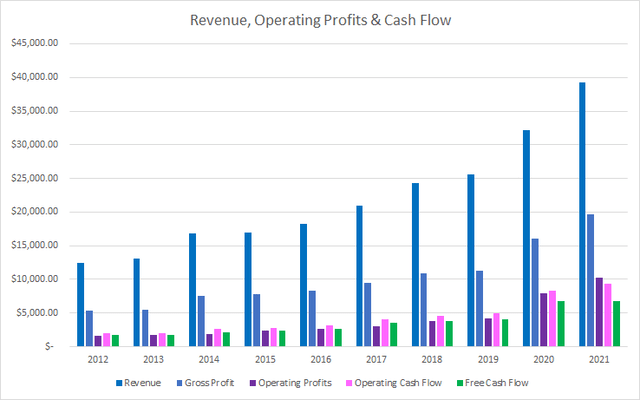
TMO’s revenues tremendously over the last decade increasing 213% in total of 13.5% annualized. Gross profits outpaced revenue growth rising 271% or 15.7% annualized.
Operating income showed incredible improvement as well increasing 554% or 23.2% annualized while operating cash flow rose 357% or 18.4% annualized. Free cash flow lagged behind operating cash flow, although still came in at an impressive 294% increase or 16.4% annualized.
The rolling 5-year CAGRs for TMO’s revenue, gross and operating profits, and operating and free cash flow can be found in the following chart.
TMO 5 Year Financial CAGRs (TMO SEC filings)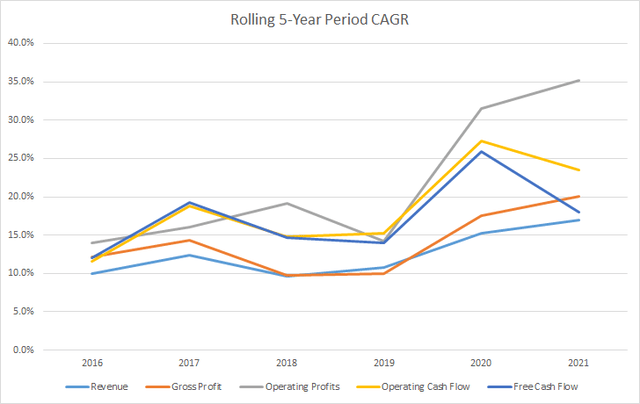
My expectation is that good businesses will be able to show at a minimum stable, and more likely rising, margins over time. With TMO’s gross profits and free cash flows growing faster than revenues during the last decade it shouldn’t be a surprise that TMO’s margins have been on the rise as well.
TMO Margins (TMO SEC filings)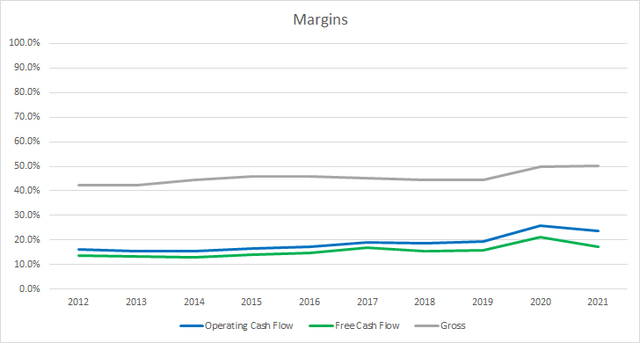
TMO’s gross margin just surpassed 50% in FY 2021 from already impressive levels of 42% in FY 2012. The 10-year average gross margin for TMO is 45.4% with the 5-year average at 46.8%.
Similarly, TMO’s free cash flow margins rose from the low-to-mid teens in FY 2012 up to the high teens for FY 2021. The 10-year average is an excellent 15.5% with the 5-year average at 17.3%.
My preferred profitability metric is the free cash flow return on invested capital, FCF ROIC. The FCF ROIC represents the amount of excess cash flow the business is able to generate for every dollar of capital invested already invested in the business. Once again my expectation is that good businesses will show stable or rising FCF ROIC’s over time.
TMO Free Cash Flow Returns (TMO SEC filings)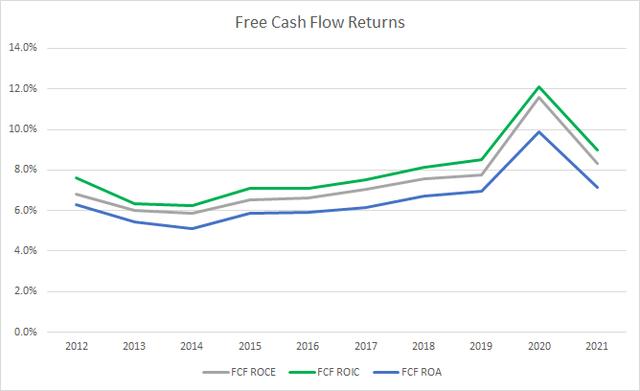
TMO has seen its FCF ROIC increase over the last decade and while it’s been stable, it’s at levels lower than I’d like to see. Much that has to do with the numerous acquisitions TMO has completed over that time.
The 10-year average FCF ROIC for TMO is 8.0% with the 5-year average at 9.1%.
To understand how TMO uses its free cash flow I calculate three variations of the metric, defined below:
- Free Cash Flow, FCF: Operating cash flow less capital expenditures
- Free Cash Flow after Dividend, FCFaD: FCF less total cash dividend payments
- Free Cash Flow after Dividend and Buybacks, FCFaDB: FCFaD less cash spent on share repurchases
TMO Free Cash Flows (TMO SEC filings)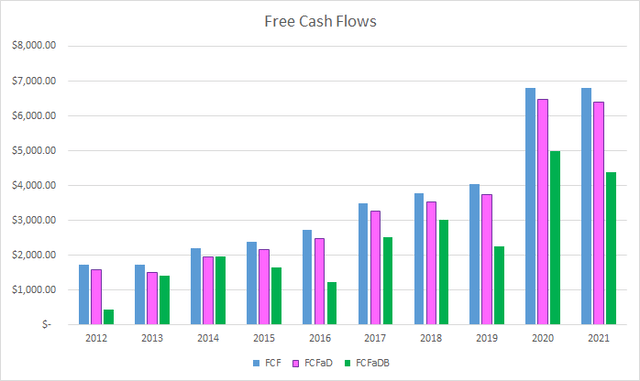
Over the last decade TMO has generated a total of $35.7 B in FCF. With that FCF management has paid out a cumulative total of just $2.6 B in dividends putting the 10-year FCFaD at $33.7 B. TMO has also spent a total of $9.2 B on share repurchases putting the cumulative FCFaDB at a very impressive $23.8 B.
That excess FCFaDB has helped TMO in funding the $46.4 B in acquisitions they’ve completed during that time as well.
Share repurchases are another way for businesses to return excess cash to shareholders. By reducing the shares outstanding the same business pie is divided into less pieces giving increasing the ownership stake for all remaining shareholders.
TMO Shares Outstanding (TMO SEC filings)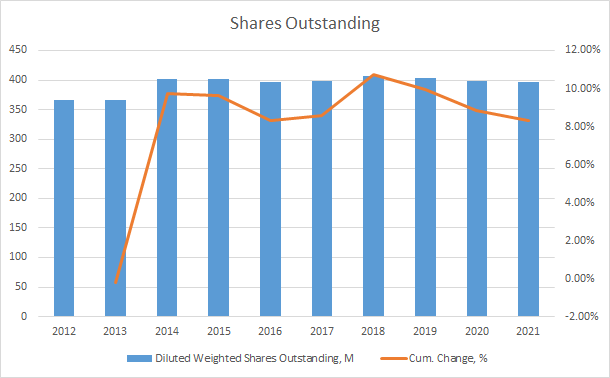
Despite spending $9.2 B on share repurchases during the last decade, TMO’s share count has actually risen 8.3% or around 0.9% annually.
My investing strategy is centered around buying a business that I can feel comfortable owning for periods spanning years or potentially decades as long as the business is performing adequately. Part of the process that I use to get comfortable with that decision is to see how much debt the business carries. The first step in that is to see how the debt-to-capitalization ratio has fared over time.
TMO Debt to Capitalization Ratio (TMO SEC filings)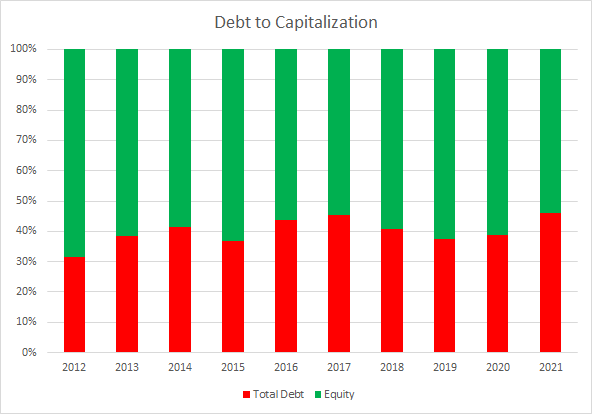
TMO’s debt-to-capitalization ratio has averaged 40% for the last decade and 42% for the most recent five years.
Additionally I track how much claim the debt load a business carries has on the profits and cash flows the business has generated. I do this by examining the net debt ratios which look at the total debt level less cash divided by various profit and cash flow metrics. For the debt ratios the lower the better as there’s less claim on the potential future profits.
TMO Debt Ratios (TMO SEC filings)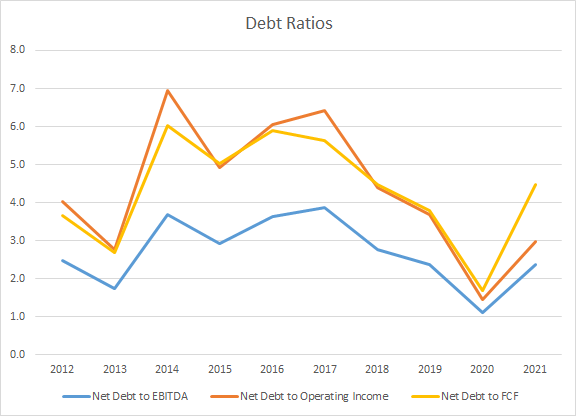
The ratios that I track are the net debt-to-EBITDA, -operating income, and -free cash flow. The 10-year average for those ratios are 2.7x, 4.4x, and 4.3x with 5-year averages of 2.5x, 3.8x, and 4.0x.
Valuation
TMO is definitely an interesting business and one that I’d like to add to my portfolio as I’m quite bullish on the healthcare sector over time. Of course identifying a good business is just part of the battle, the other part is being able to purchase shares at a reasonable valuation. In order to determine a range of prices that I’d like to purchase shares I employ a minimum acceptable rate of return, MARR, analysis, dividend yield theory, and a reverse discounted cash flow analysis.
The MARR analysis is a way to forecast what the share price could be in the future given that the business is able to hit certain levels of earnings and dividend growth. It requires you to estimate the future earnings for a period of your choosing, I prefer 5-year and 10-year, with conservative estimates. You then apply a reasonable expected terminal multiple and determine what the expected returns would be.
Analysts expect TMO to report FY 2022 EPS of $22.54 and FY 2023 EPS of $24.29. They also expect TMO to be able to grow EPS 10.9% annually over the following 5 years. I then assumed that TMO would be able to grow EPS 6.0% annually for the following 5 years. Dividends are assumed to track EPS growth to maintain a flat payout ratio.
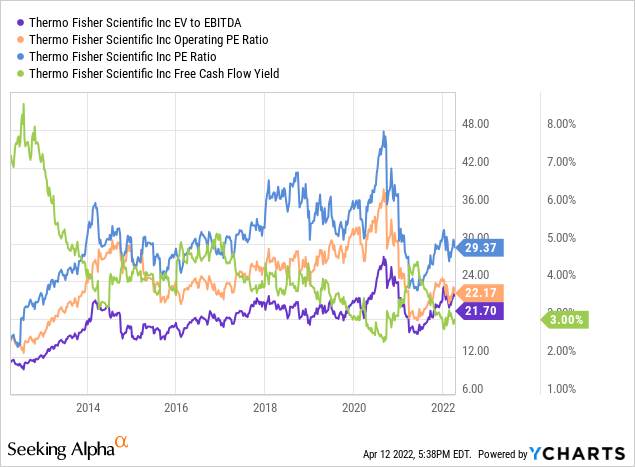
In order to determine a range of expected multiples that investors will value TMO’s EPS at I like to see how it has changed over the previous decade. As we can see in the following YChart, TMO has typically been valued between ~15x and 35x TTM EPS. For the MARR analysis I’ll examine terminal multiples spanning that range.
The following table shows the potential internal rates of return that an investment in TMO could generate if the assumptions laid out above prove to be reasonable forecasts for how the future plays out. Returns assume dividends are taken in cash and that shares are purchased at $570.94, Monday’s closing price.
| IRR | ||
| P/E Level | 5 Year | 10 Year |
| 35 | 18.8% | 12.2% |
| 30 | 15.0% | 10.4% |
| 25 | 10.7% | 8.4% |
| 20 | 5.6% | 6.0% |
| 15 | -0.6% | 2.9% |
Source: Author
Additionally I use the MARR analysis framework to invert the process in order to find out what price I could pay today in order to generate the returns that I desire from my investments. My base hurdle rate is a 10% IRR and for TMO I’ll also examine 8% and 9% return thresholds.
| Purchase Price Targets | ||||||
| 10% Return Target | 9% Return Target | 8% Return Target | ||||
| P/E Level | 5 Year | 10 Year | 5 Year | 10 Year | 5 Year | 10 Year |
| 35 | $834 | $700 | $869 | $764 | $906 | $833 |
| 30 | $716 | $602 | $746 | $656 | $778 | $716 |
| 25 | $597 | $504 | $623 | $549 | $649 | $599 |
| 20 | $479 | $406 | $499 | $442 | $521 | $482 |
| 15 | $361 | $307 | $376 | $335 | $392 | $365 |
Source: Author
Dividend yield theory is a simple valuation method based on the concept that investors will collectively value a business around a normal dividend yield over time. It’s a variation on reversion to the mean. For TMO I’ll use the 3-year average forward dividend yield as a proxy for the fair value.
Thermo Fisher Scientific Dividend Yield Theory (TMO Investor Relations and Yahoo Finance)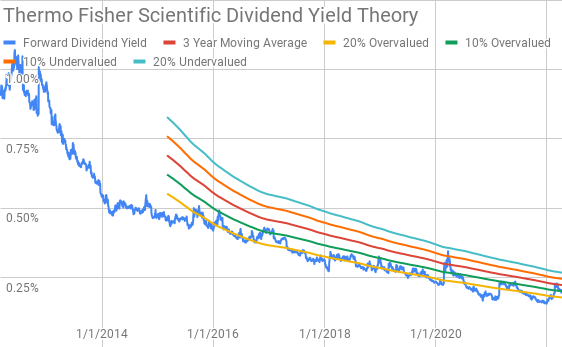
TMO shares currently offer a 0.21% forward dividend yield compared to the 3-year average yield of 0.22%.
A reverse discounted cash flow analysis can be used to try to reverse engineer the cash flows the business must generate in order to generate the returns that you desire. I use a simplified DCF model based on revenue growth, a terminal growth rate of 4.0%, an initial free cash flow margin of 18.1% that improves to 24.0% during the forecast period.
Under those assumptions TMO needs to grow revenues 10.7% annually from FY 2021 through FY 2031 with a 10% return threshold. Lowering the return threshold to 8% reduces the required revenue growth to just 5.0% annually for that same period.
Conclusion
TMO is a wonderful business that appears poised to continue growing as the global healthcare sector continues to expand. TMO is a picks and shovels play on that growth supplying the tools and testing equipment allowing other companies to perform R&D and manufacture.
Dividend yield theory suggests a fair value range between $480 and $600. The MARR analysis with a 10% IRR target 5 years out and assuming a terminal multiple around 25x puts the fair value for TMO around $600.
The reverse DCF suggests that 10% returns might be tough to come by as the required revenue growth through FY 2031 is quite aggressive at 10.7% annually. Although 8-9% returns do seem quite achievable for TMO with just modest revenue growth assumptions.
While most traditional dividend growth investors might forego a company like TMO due to the lack of current dividend yield of just 0.21%. However, that yield, or at least the dividend, is likely to grow at a very rapid pace for years to come. The expected payout ratio for FY 2022 is just 5%. What’s pretty intriguing is that TMO could grow it’s dividend 10% annually until 2040 before it gets to a payout ratio of 30% and that’s before accounting for future growth of the underlying business.
At TMO’s Investor Day in September 2021 management guided for pretty fantastic business improvement and expansion through FY 2025.
TMO Investor Day Growth Forecasts (TMO Investor Day September 2021)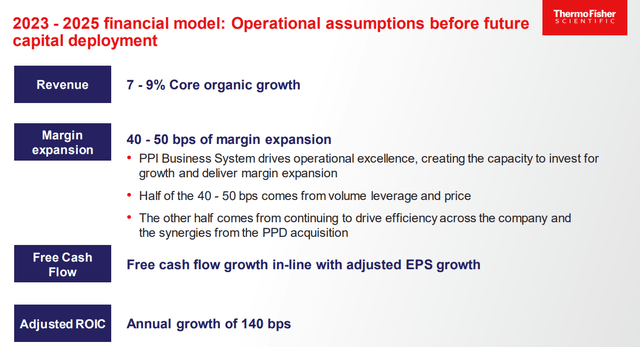
The question is what does growth look like after that period. Both the MARR analysis and DCF model generally follow management guidance through 2025; however, I’ve erred on the conservative side of growth expectations after that time.
TMO expects to take deploy significant amounts of capital towards future M&A. If they hadn’t had a long history of successful integration I’d be a bit concerned with the strategy; however, management has proven itself to be good stewards of investors capital and until proven wrong I’m willing to give them the benefit of the doubt.
According to TMO the scientific equipment industry is very fragmented with plenty of opportunities for future M&A. In that same investor day presentation management is expecting to deploy roughly $30 B in additional M&A through FY 2025.
As a dividend growth investor I’d prefer that TMO focus more on dividend growth or special dividends as opposed to share buybacks, but that’s a personal preference. If the share repurchases are done at reasonable valuations then I’m more than happy for TMO to buyback shares while increasing my potential stake in the business.
TMO doesn’t appear cheap at current valuations; however, given the expected growth it doesn’t necessarily seem to expensive either. At current market prices I believe TMO has a high likelihood of delivering at least high single digit returns even with roughly 20% multiple retraction coupled with annual dividend growth greater than 10%. Given the low dividend yield TMO is best suited dividend growth investors with a very long time horizon or those that are more focused on total return, as we should be.
I’ll be thinking about TMO and whether to initiate a position over the coming week. Although ideally I’d like to add shares around $500 which is a further decline around 12%.


Be the first to comment