

William_Potter/iStock via Getty Images
The purpose of this article is to examine the USA sectoral flows for March 2022 and assess the likely impact on markets as we advance into April. This is pertinent, as a change in the fiscal flow rate has an approximately one-month lagged impact on asset markets and is a useful investment forecasting tool and there are other macro-fiscal flows that can point to events many months ahead.
With a war between Russia and Ukraine, it does not matter to a large extent what the fiscal flows do. The negative sentiment and impact of sanctions and counter-sanctions are going to cause a lot of volatility and overmatch any other market movement consideration.
The table below shows the sectoral balances for the USA and is produced from the national accounts.
US Treasury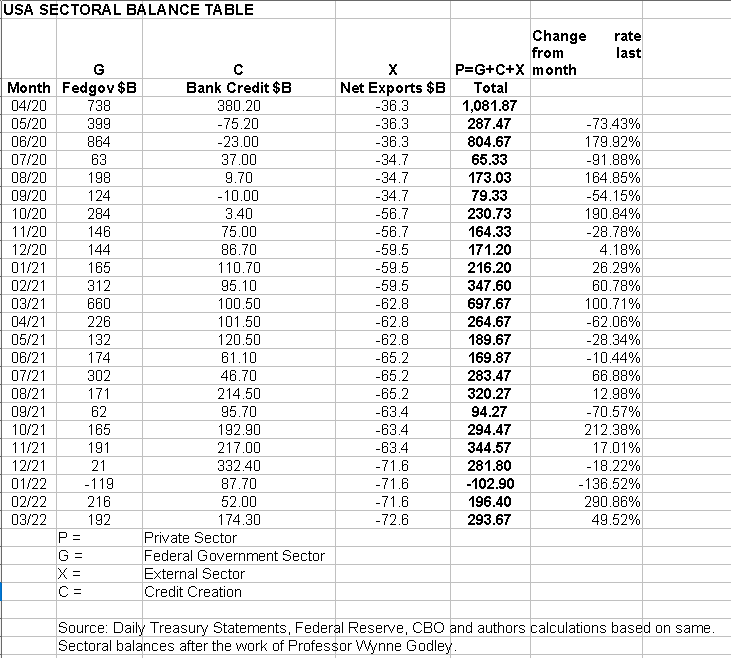
From the sectoral balances table above, we see that for March 2022, we have a positive nominal flow of $293B+ into the private sector and a large, positive change rate month over month. For markets, the change rate tends to be more important than the headline number, and in this case, both are positive, which is really positive for markets. But for the Russo-Ukraine war markets would be rising now simply from the seasonal strength of rising fiscal levels and would continue to do so until the next federal tax collection in mid-April.
This is a seasonal pattern that occurs at this time caused by the institutionalized spending and taxing pattern. The chart below shows the five-year average of the seasonal stock market patterns for the SPX (SPX), NDX (NDX), Dow (DIA), Russell 2000 (RTY), and Biotech (IBB) market indexes. The black circle shows where we are and the seasonal pattern now is for markets to trend flat to down into trading day 90-100 [end of April/middle of May].
US Treasury
The $293+ billion is made up of a $192+ billion addition of funds from the federal government, plus an impressive $174+ billion of credit creation from commercial banks and less the -$72+ billion that flowed to foreign bank accounts at the Fed in return for imported goods and services.
The following chart emerges when one graphs the change rate of the information in the USA sectoral balances table above and adjusts for impact time lags.
Robert Balan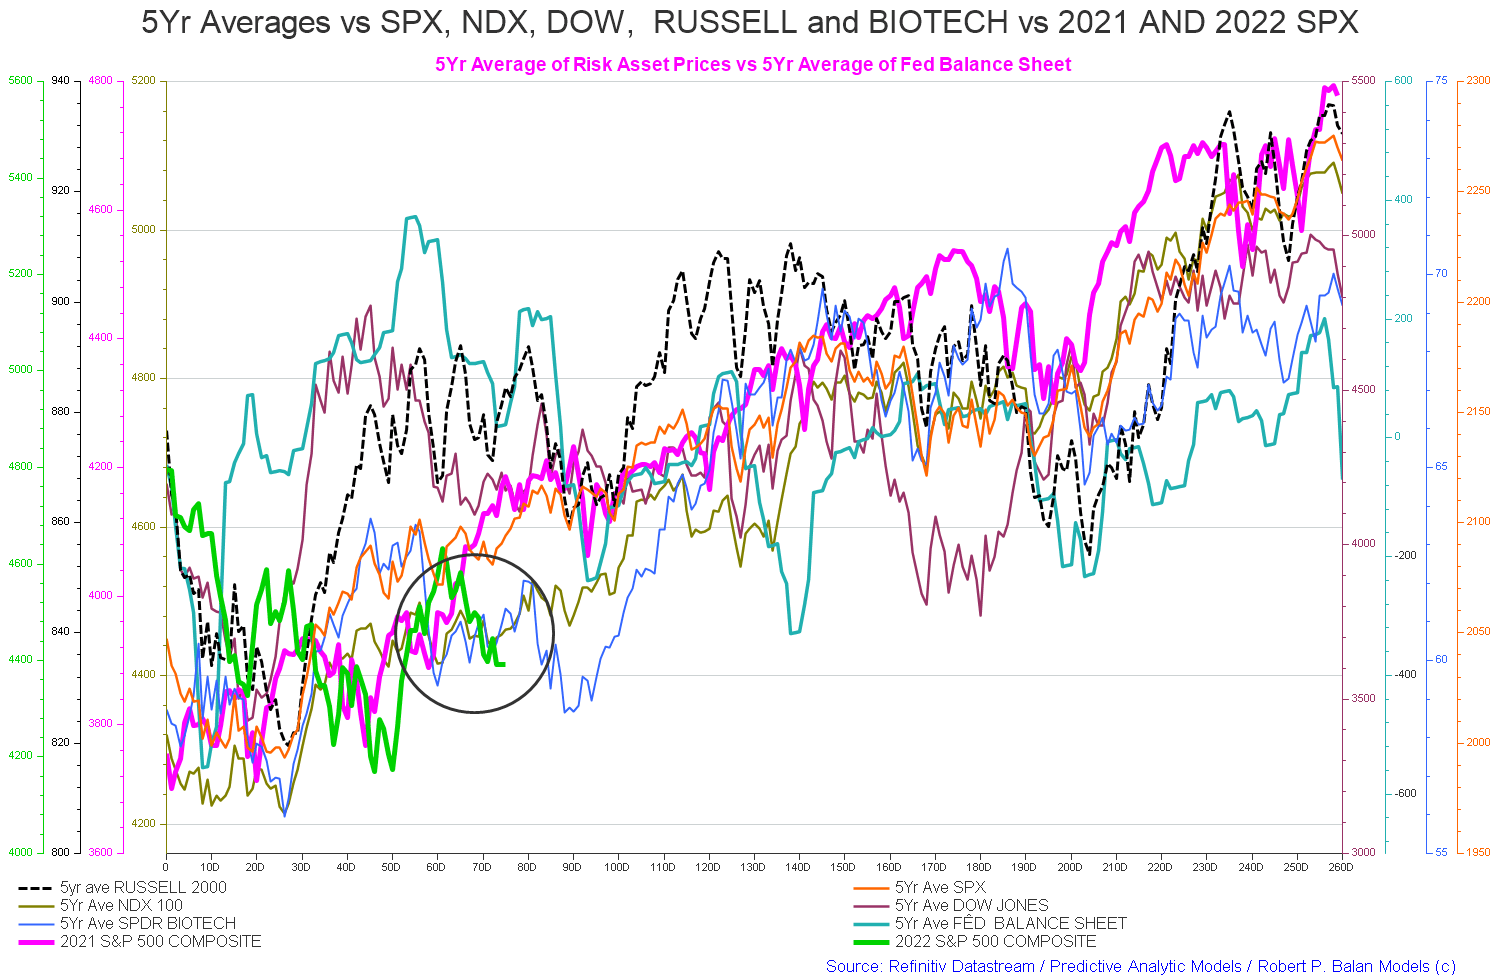
The blue line is the crucial factor and leads by about five quarters and points to a recovery in the next quarter. The end of the orange line is where we are now. One would expect a movement of markets back upwards following the blue line into the rest of the year in the near future.
The table below shows that the overall federal expenditures were slightly larger and a 14% increase from last month which was also an increase from the month before.
Robert Balan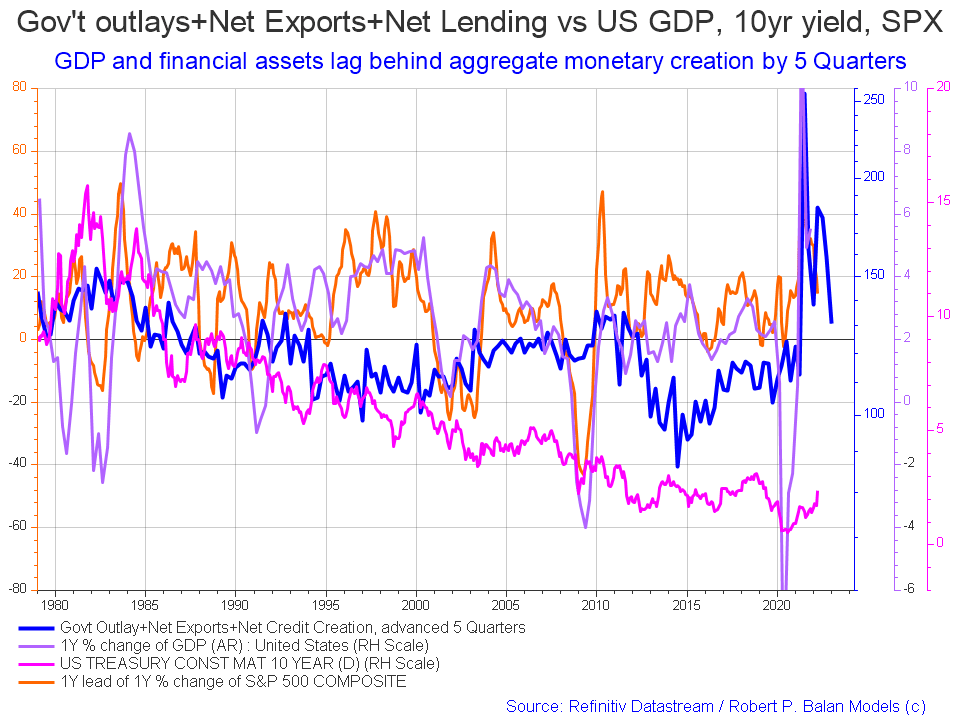
The change rate in both tables is upwards and this points to stronger markets over the next month in normal times free of war and international sanctions.
The table below is an extract from the monthly treasury statement and shows that this March is a lot weaker than last March.
US Treasury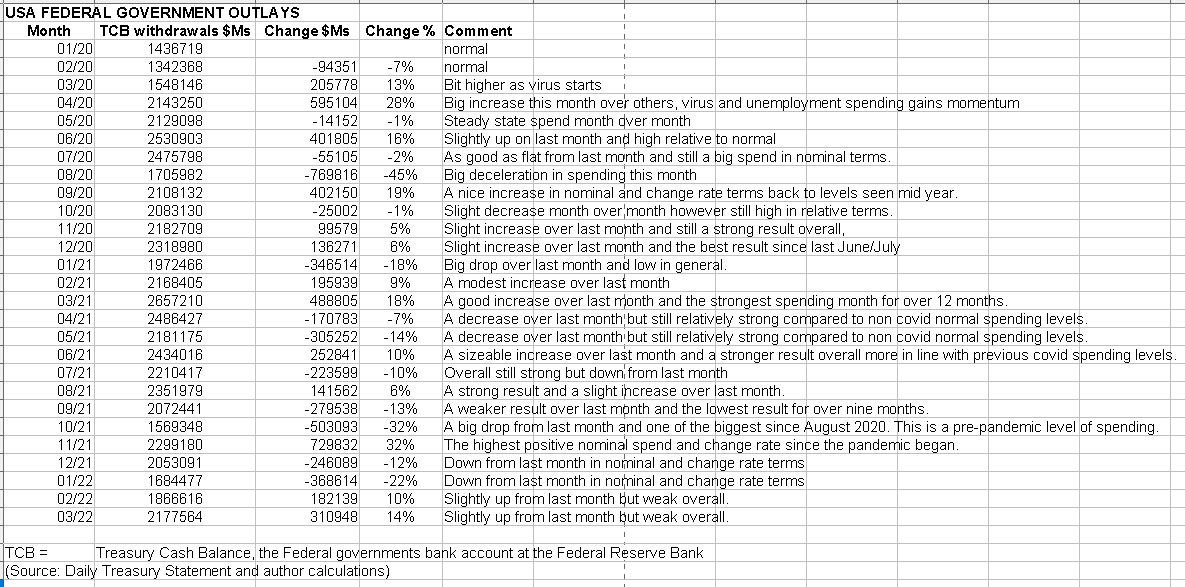
The chart below shows graphically the relationship between the federal government (currency creator) and the private sector (currency user) and is from ANG Traders of the Away from the Herd SA Marketplace service.
US Treasury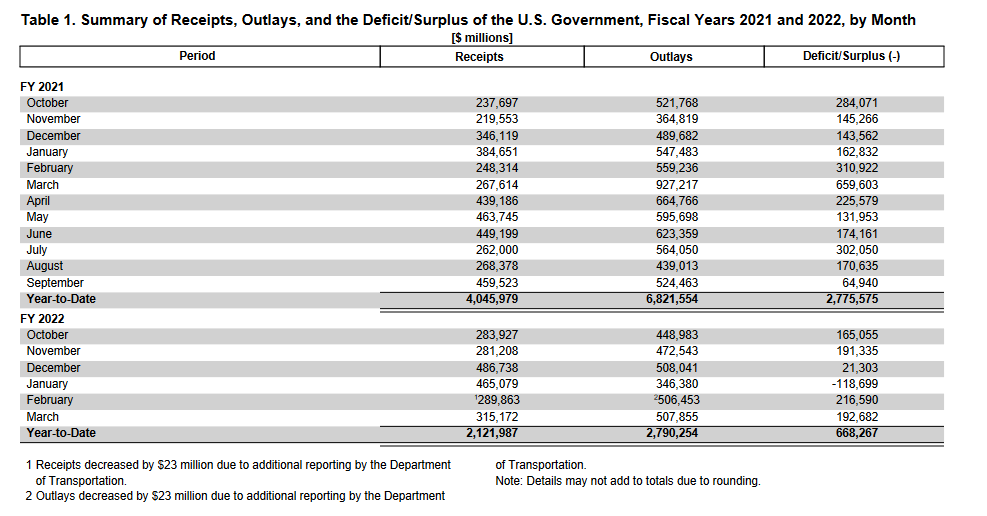
The 20-day average of the daily net-transfer from the government to the private sector remains positive, but is slowing down; it has gone from +$14B/day at the start of March, down to +$5.5B.
(Source: Mr. Nick Gomez, ANG Traders, Away from the Herd SA Market Service Weekly report)
The best results for markets are when the black line is moving in the green private sector surplus area on the chart. It is generally moving in that area now however the red moving average line is heading upwards towards a private sector deficit and did this all through March as fiscal flows weakened overall.
The next major fiscal event is the federal tax collection on the 18th of April whereupon the black line will move strongly into the red danger area and the private sector goes into deficit. When money is removed from the private sector assets markets must move downwards to reflect the loss of income and financial wealth.
ANG Traders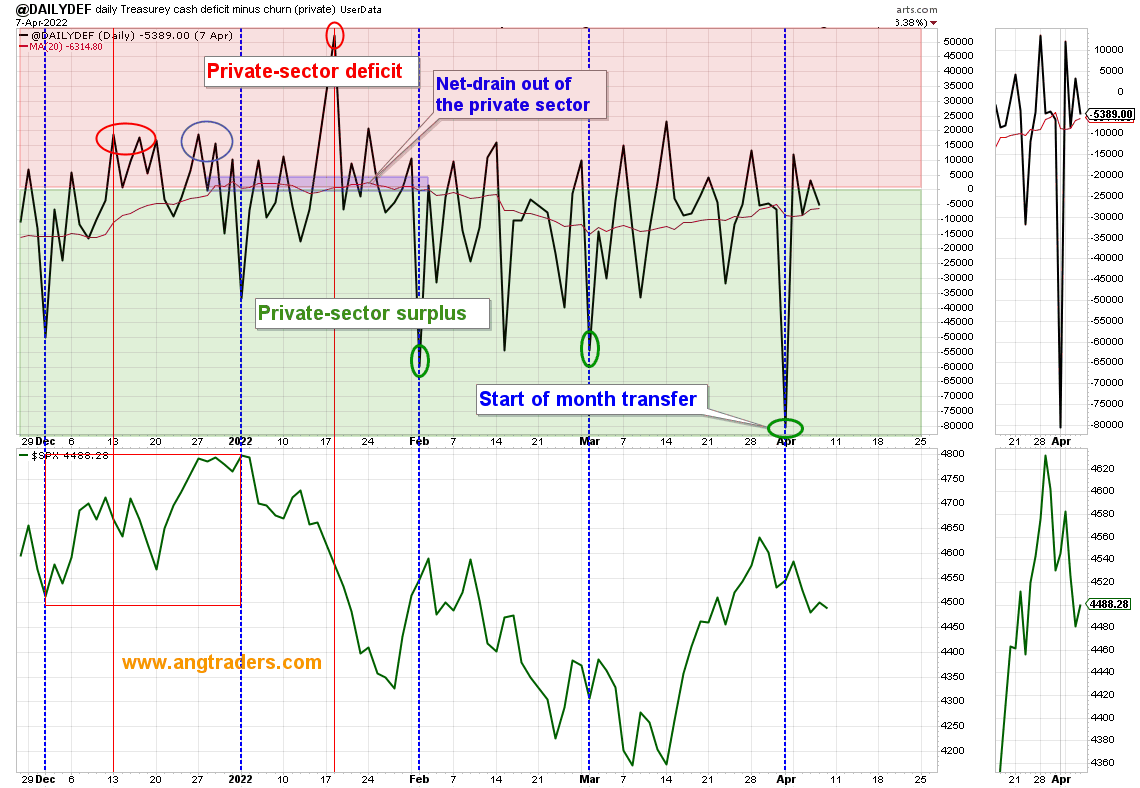
The above chart shows the stock of treasuries [AKA national debt] flattening off as liquidity overall dries up. Remember that for all practical purposes the stock of treasuries is the money supply and a growing economy needs a growing money supply to enable all the transactions that take place within it. The bottom panel is a zoomed-out version of the chart just above this one. Note the red boxes where the private sector went into deficit. There was a relatively long deficit period from December to February and that is largely responsible for the downward trending markets we are having now. The coincident Russo-Ukraine war simply made the retracement deeper than it would have been and the extra spending that is taking place now [at the moment about $800B+ defense spending bill, see quote below] will lift it out again, hopefully just as sharply.
At the White House, a major fiscal event of note is the military assistance package for Ukraine. This was mentioned as a likely possibility last month and has now come to fruition.
ANG Traders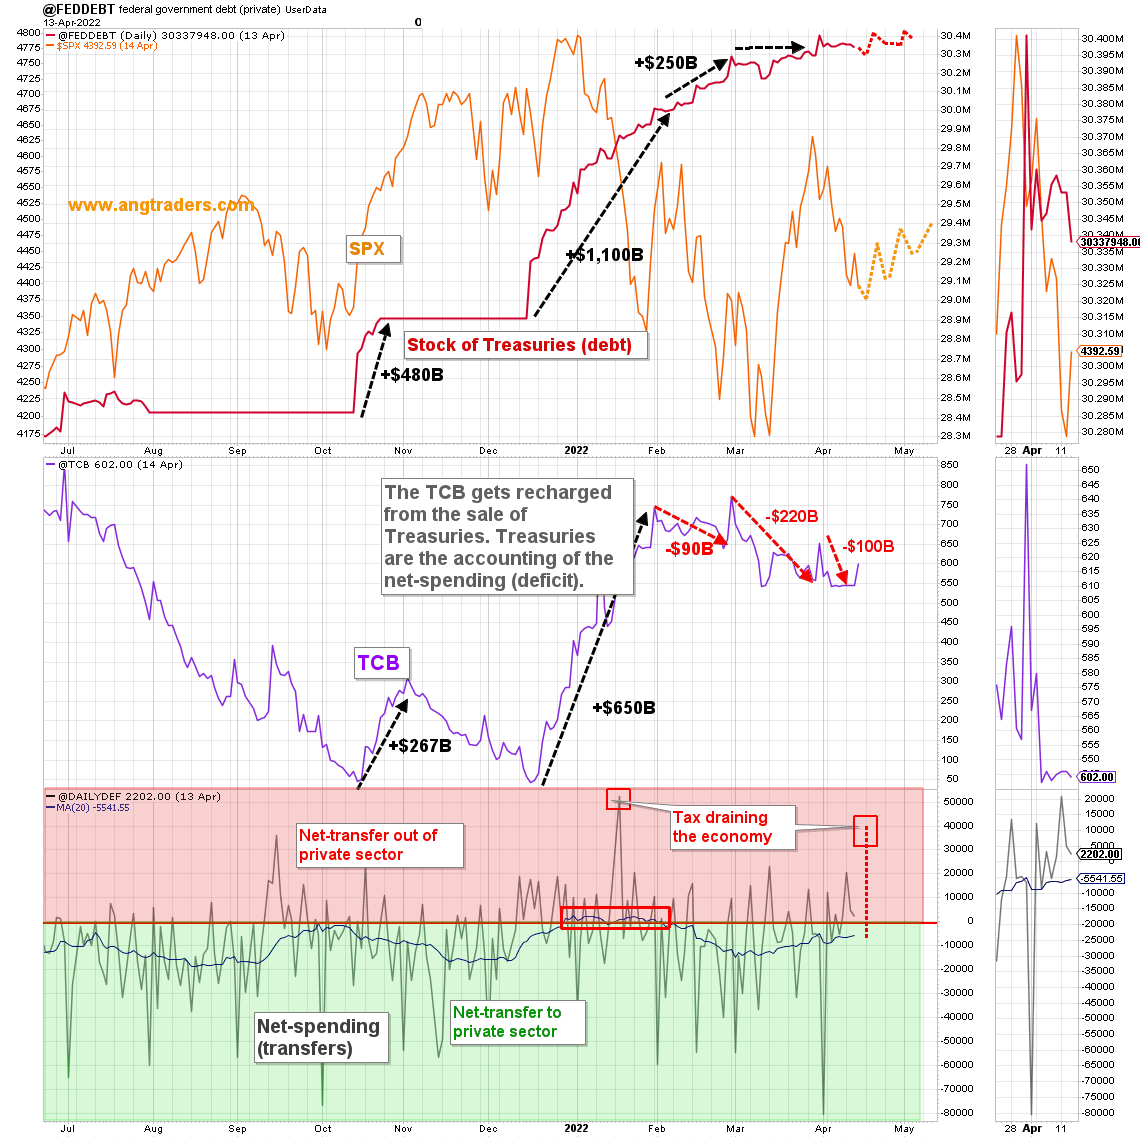
Another item worth mentioning is the President’s budget. An extract of the budget is shown below.
Los Angeles Times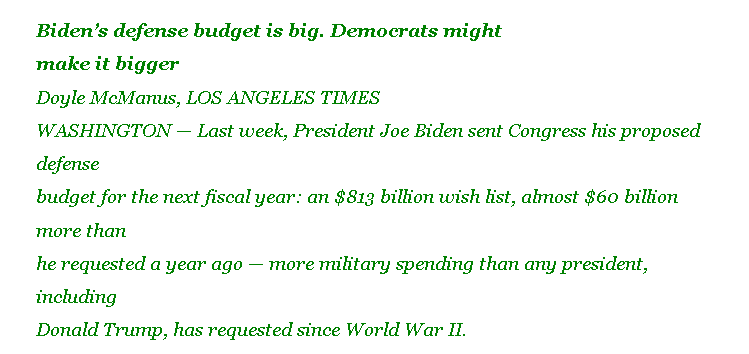
The important point is that after the big drop down in spending as the Covid pandemic comes to an end, federal government spending continues on steadily at a rate of 4.5% to 4.8% of GDP into the end of the decade. There is no federal government budget surplus planned that might remove financial assets from the private domestic sector. One can expect the private domestic sector to steadily expand and for financial assets to grow. A change of policy can turn this upside down but for now, we are safe.
The Fed continues to QE (buying bonds off banks in return for cash) now at a reduced rate and has raised the interest rate for the first time since the pandemic. There is an FOMC meeting early next month where it is expected that both a rate rise and further QT will be announced.
US Treasury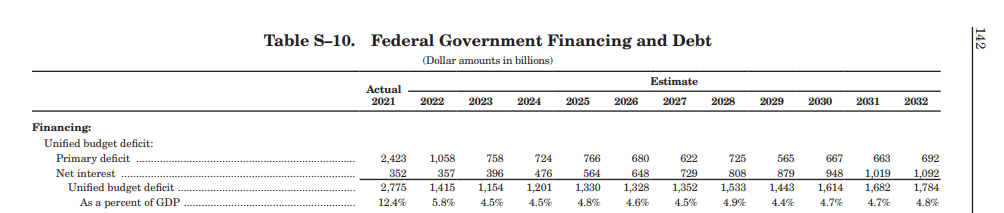
The chart above shows the Fed balance sheet juxtaposed with the SPX. The black line shows the end of QE. Note also the falling rate of change of SOMA on the bottom panel. None of these trends are good for markets.
Anything that drains bank reserves is negative for markets as the banks have fewer reserves with which to buy trading assets such as stocks and bonds. The tax collection money flows to the treasury cash balance where it is slowly drawn down by federal spending thus flowing back into the private domestic sector over time. It is the Federal Reserve that buys bonds to maintain its policy rate by absorbing bank reserves with bond sales and adding to reserves by buying bonds in return for cash. Bank reserves then reach a level where the interest rate is within the Feds target. A large April tax collection means the Fed will not have to absorb bank reserves with a bond sale to manage its policy rate given the tax has drained them out. If the drainage is too great and the policy rate rises too high as a result, the Fed may even have to buy bonds from the primary dealer banks to put more cash in the system [QE] and so bring the policy rate back down again to the target range. The fed and treasury play a constant complex balancing act that would be eliminated if they stopped issuing debt, set a fixed policy rate on reserves, and simply left the reserves in the system instead of converting them to treasuries. Any government that implemented this administrative change would, at the stroke of a pen, eliminate the dreaded national debt and all the scaremongering that goes with it.
On a similar note, on the subject of banks buying trading assets with excess reserves, is the impact of rising yields and a yield curve inversion, both of which are the talk of the town at present.
When the Fed raises rates what normally happens is the short end of the curve comes up to meet the long end and thus increases funding costs for banks buying trading assets borrowed at short maturities. Their funding cost goes up so they stop buying and so the demand for stocks and bonds drops all of a sudden like an aircraft hitting an air pocket.
The chart below shows that while we are heading for a yield curve inversion we are not there yet and also that it takes a grouping of all the major maturities to invert together before the rather reliable recession warning is triggered. A yield curve inversion in one or more of the maturities makes for good headlines but there is more to it than that. All the lines shown in the chart need to go below the zero line on the Y-axis for the yield curve to fully invert.
ANG Traders Robert Balan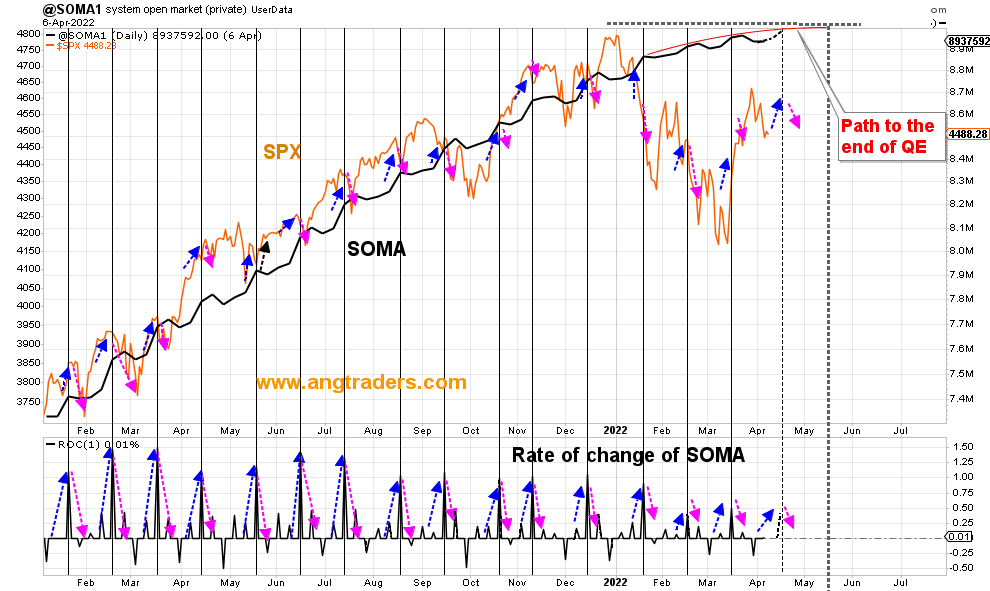
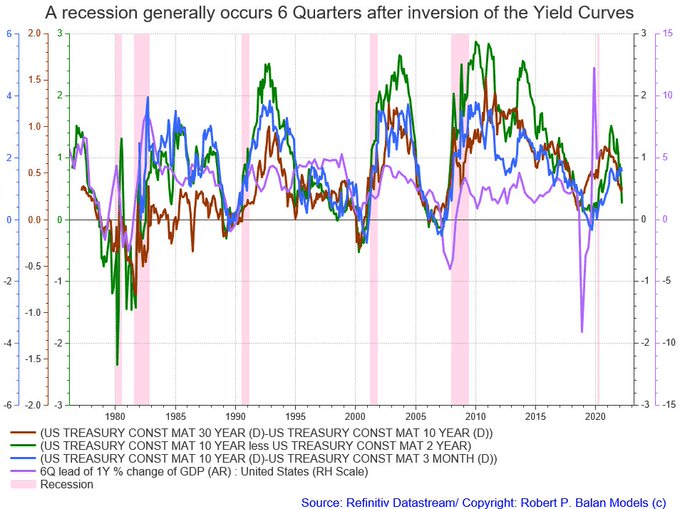
The 2Y/10Yr did not sufficiently get inverted enough to warrant a sure recession 5 Quarters hence but the 10Yr Yield is now prepped for a strong downside reversal.
(Source: Mr. Robert P Balan. PAM chat 16th April 2022)
We say the 10-year yield is prepped for a strong downside reversal because mechanically speaking the is a big April 18th tax drain will remove bank reserves from the federal reserve system, this will make interest rates at the short end rise and bond traders will jump on this opportunity to get a higher interest rate return at a lower term premium and time risk. To do this they will sell the 10yr and buy short maturities, this will make the face value of the 10yr fall and its rate rise, and then as the pendulum swings back the other way they will jump out of the short term maturities and back into the 10yr and this will make its face value rise and its interest rate fall.
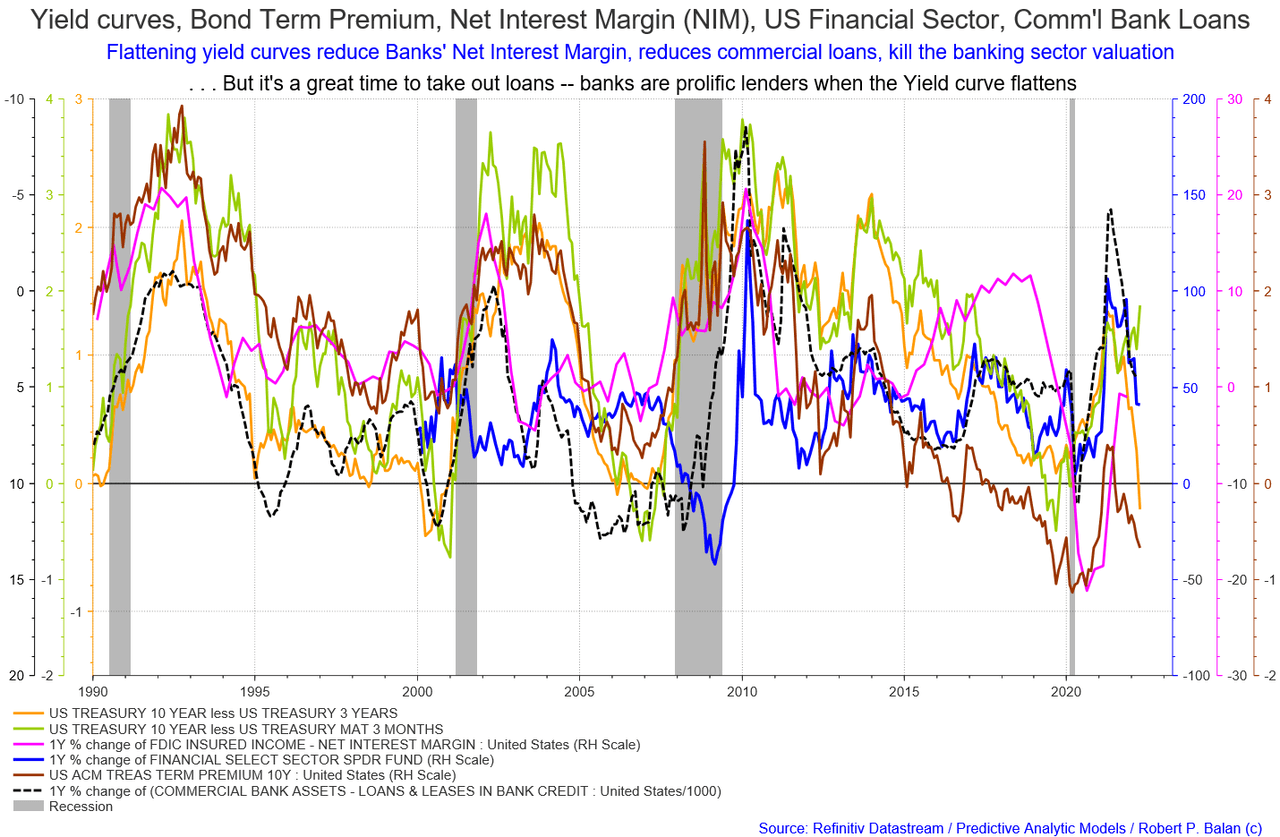
Another feature of flattening yield curves is the impact on the banking sector’s net interest margin [NIM]. While high at present, NIM [pink line on the chart below] is going to follow the other covariant factors downwards as rates are raised. The time to buy the banks is when NIM bottoms out. If you think that banks are cheap now, they are going to get even cheaper as time goes on and then really rally.
Robert Balan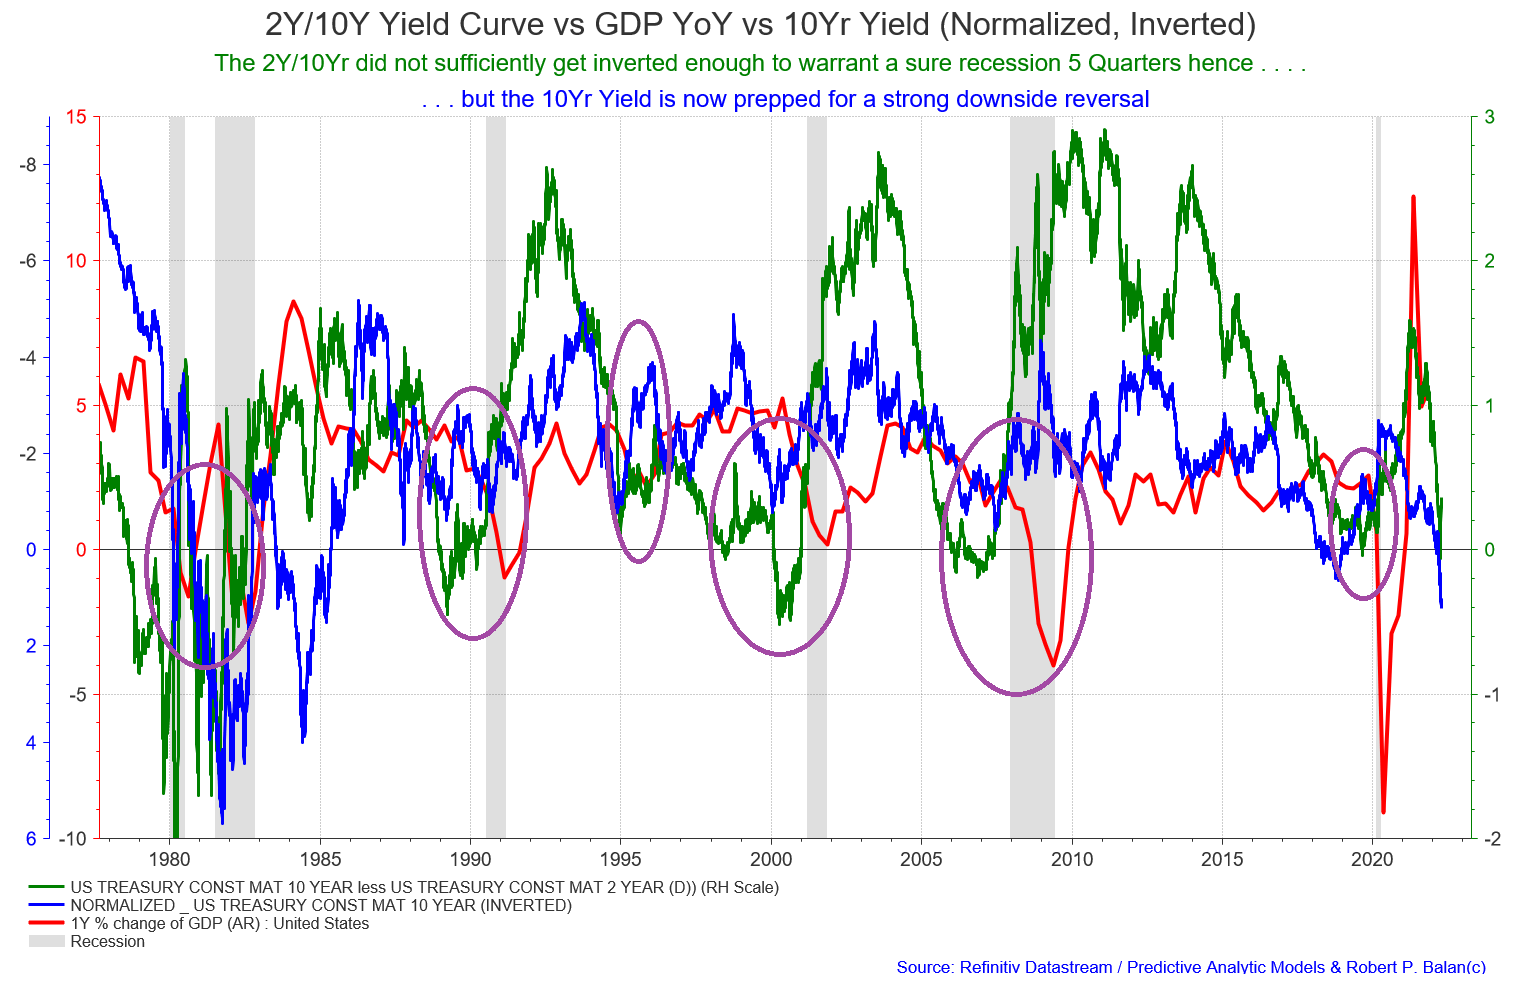
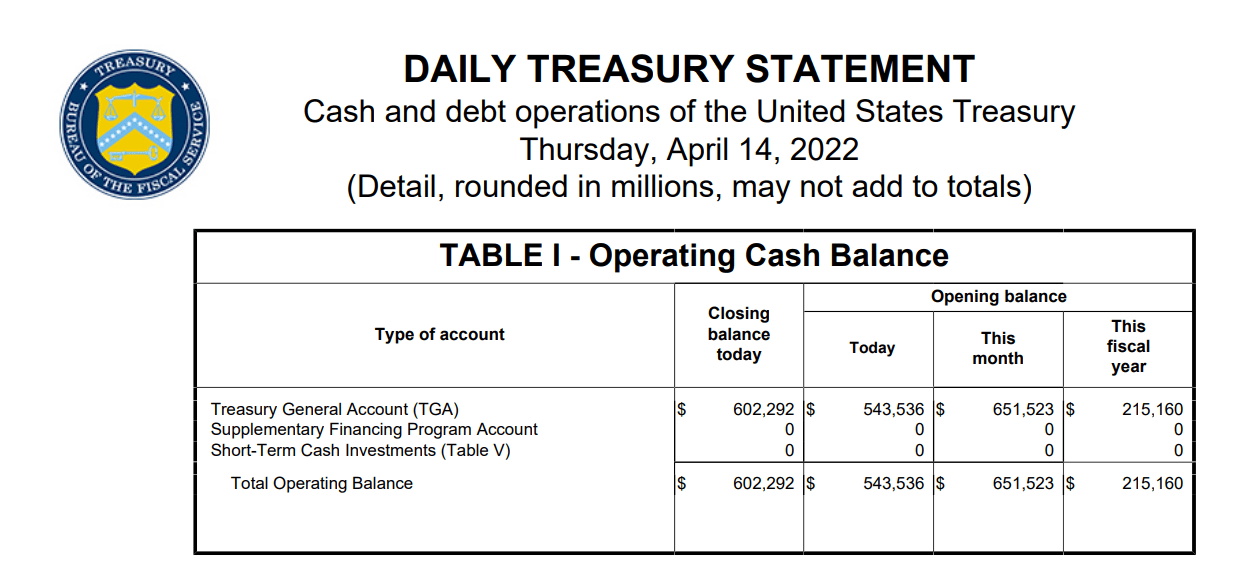
Below is an extract of the daily treasury statement showing the federal government’s bank balance at the Fed.
There you have it, $602B+ of QT equivalent. Money that has been taxed out of the private domestic sector and appears on no measure of any money supply until spent back out again.
On the world stage, the chart below shows the expected likely path of asset markets based on the flow of funds at the macro world level.
The chart below comes from Mr. Robert P. Balan of Predictive Analytic Models and is part of his SA Marketplace service information for subscribers. The chart shows the level of money creation by the top five world central banks in a change rate format along with a host of other indexes.
“Maybe we have one more shot at a test of the previous March 2022 lows, maybe even marginal lower lows. The change rates of the major liquidity flows bottom in May.
Rising equities and likely rising 10Yr Yield over the next two to three week period. Then another sell off for the rest of May 2022. The next upturn in liquidity flows thereafter should promote another bull phase in equities. This is also totally in consonance with the Big Picture of the seasonal upwelling of domestic and global liquidity as from late May, which lasts until late June-early July.”
(Source: Robert P Balan, PAM chat, 14th April 2022)
The chart shows that weak financial times are ahead and that these are magnified by international trends working in the same direction as the weak national trends with a bottom being reached in May.
Most likely this low will be made lower by appalling news coming out of the war in the Ukraine. The war in Ukraine is likely to rage all summer becoming more mobile and deadly as the ground dries out and more supplies arrive.
Be the first to comment