

24K-Production
“I believe that, young or old, we have as much to look forward to with confidence and hope as we have to look back on with pride.”
– Queen Elizabeth II
The view of the U.S. MACRO scene isn’t complete without speaking to what is brewing in the Eurozone. Since the Energy Crisis appeared, the economic warning signs started flashing yellow. The situation has deteriorated and we now have an elevated level of concern that is now flashing RED. Market historians will remind investors that a recession in the EU has never brought about a recession here in the US and so it is no cause for concern. The problem with following that train of thought is denying the POOR state of affairs in the US economy.
While the Federal Reserve has its fair share of challenges, the European Central Bank (ECB) is faced with a different set of dilemmas. In the US, inflation has at least stalled and recent commentary from corporate earnings suggests that the economic outlook might not deteriorate further. On the contrary, supply shocks continue to plague the eurozone economy and inflation pressures are showing no signs of abating with nearly half of the EU countries already experiencing double-digit inflation. Rapidly rising inflation was caused by an energy crisis.
Eurozone In Crisis Mode
The ECB halted its bond-buying program and lifted interest rates by 50 basis points last month—its first rate hike in over a decade. While the ECB is forecasted to raise rates by a similar magnitude in September, the European economy is inching closer to a recession. The euro has broken parity with the dollar, falling ~12% year-to-date to reach its weakest level since 2002.
On one hand, the weaker currency makes its goods more competitive in the global market and will likely boost last year’s record ~$400 billion of exports to the US. But on the other hand, it means a higher price paid for imported goods which will continue to pressure inflation to the upside. Just as important, a weaker euro compounds the upward pressure on key imports such as oil—which is priced in dollars. This has caught the attention of the ECB, which has led to further upward pressure on interest rates as the inflation dynamics and outlook for growth take a turn for the worse.
Energy prices in both the US and Europe reflect policy mistakes in the US and Europe that have now turned to outright panic in the EU. Power prices are now ~13x the seasonal norm. US natural gas prices are at 14-year highs of $10/Mcf, though not quite setting records (yet). Benchmark EU gas prices are a staggering $85/Mcf, near all-time highs, as the market continues to send price signals for all available LNG cargoes to be shipped to Europe. Even before this recent surge, European household energy bills were up 35% year-over-year in July (versus 15% in the US), and these bills are likely to move higher based on recent energy spikes and proposed usage levies. For example, Germany’s new levy allows energy importers, who are working to replace the Russian supply, to pass along some of the higher costs. This per kilowatt-hour usage fee for natural gas will cost households, on average, an additional ~500 euros annually.
Catastrophic Energy Costs
As bills skyrocket, European consumers continue to prepare for the worst-case scenario. Anecdotal evidence confirms that consumers have started to stockpile wood (imagine doing this during the summer heat) and are purchasing stoves in hopes of staying warm this winter. Even beyond the consumer impact, Europe’s energy-sensitive industries are struggling as well. Aluminum and zinc production has fallen by ~50% in the last year. While much of the focus has been on consumer impact (both sentiment and spending capabilities), it is important to consider these broader economic and industry-level impacts. The EU is discussing capping energy prices, but that amounts to subsidies that someone has to pay for in the form of increased taxes, etc. As reported last week, many analysts are now forecasting this situation to last longer than one winter.
Last month, the Euro Zone PMI Manufacturing Index entered contraction territory for the first time since June ‘20 and the preliminary August report showed further deterioration. For as much concern that has been voiced over the US economy, the situation is direr in Europe. recently we have seen the Eurozone release economic sentiment, PMI manufacturing, and the all-important inflation report. All painted a concerning picture.
None of this is a huge surprise, the die was cast when the Energy crisis arrived. Since late last year, the message has been consistent. Energy costs show up in EVERY facet of the economy. There is no way inflation is going to roll over and drop rapidly with energy costs at high levels. With energy prices yet to peak, Europe’s inflation reading is likely to set another multi-decade record and weigh further on consumer sentiment and business outlooks. The forecasts for inflation in the UK are now at 22%. The reason is HIGH energy costs.
Negative GDP
Circling back to the U.S., whether an investor wants to believe we are in a recession or not, a negative print on first-half GDP and subsequent data reports does not signal strength. In essence, two global dominoes are set to fall, or at the very least be so weak they will have no impact on any forecasted global growth. A situation that will continue to be reflected in the stock markets both here and in the EU.
My view that a “V” shaped recovery out of this bear market was a low probability has now changed to the chance of that happening is slim and none. So what we can expect is a typical back-and-forth trading pattern as equities try and rebuild themselves. The last two bear markets (2018 and 2020) saw sharp recoveries from the lows, but inflation was low then and the Fed was able to ease policy- we do not have that luxury right now. On top of that, if not already here, the chance of having one is a LOW probability.
Global Stock Markets
At the end of August, U.S. equities, as measured by the S&P 500 ETF (SPY), have been on a wild ride. At the mid-month high, SPY was sitting on a 4.3% month-to-date gain, but that was erased and finished the month down 4.4%.
The country ETF of each other major global economies is a similar story. Across these countries, on average, they had reached a 3.1% gain at their month-to-date highs, but they finished down an average of 3.5% for the month. Overall, developed markets have fared much worse than emerging market countries with average declines of 4.8% versus 1.2%, respectively.
There are only two ETFs—Brazil (EWZ) and India (INDA)—that were positive for the month. Meanwhile, China (MCHI) was unchanged. On the other end of the spectrum, Sweden (EWD) has been the worst performer nearing an 11% decline with several other European nations following up with the next worst performance. With stock markets around the world giving up the ghost in August, most have moved back below their 50-Day moving average technical support. At the moment, there are only four countries that remain above pre-COVID 52-week highs: Taiwan (EWT), India, the United States, and Canada (EWC). This exclusive group would need to fall substantially further to revert to those prior highs.
The Week On Wall Street
All of the Indices enter the shortened trading week on a three-week losing streak. The NASDAQ and Russell 2000 entered the day on a six-day losing skein. Post-labor Day trading looked similar to pre-labor trading in that rallies have no staying power. Another up and down session on Tuesday with the S&P closing down 0.41% at 3910. All of the indices lost ground while the NASDAQ and Russell 2000 made it seven straight days with losses.
Wednesday brought about a change in sentiment as the losing streaks were broken with every major index rallying. Strength was across the board with ten of the eleven sectors participating. Crude oil prices hit seven-month lows and the Energy sector was the lone loser on the day.
The rally continued as the prior seven-day losing streak was turned into a three-day winning streak that lifted all of the major indices to post gains for the week.
The Economy
The Atlanta Fed GDP Now report has Q3 GDP pegged at 1.4% down from the September 1st view of 2.6%. I’m sure we will see plenty of changes before the quarter ends. With negative growth in the first half and no change to the fundamental economic backdrop, it is my view that a slow to no growth backdrop continues.
The Services PMI report showed business activity contracting at the sharpest pace since May 2020 amid a solid fall in new orders.
US Services PMI 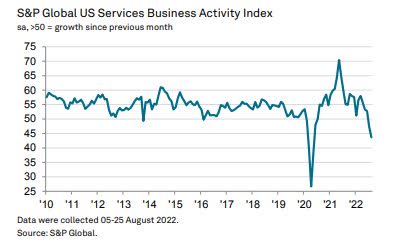
The index now sits at 43.7 in August, down from 47.3 in July and lower than the earlier released ‘flash’ estimate of 44.1.
Meanwhile, the ISM-NMI services index rose to a 4-month high of 56.9 from 56.7 in July. Similarly, the ISM-adjusted ISM-NMI rise to a 3-month high of 54.7 from 54.3 leaving that measure further above the 2-year low of 53.7 in June. Today’s upticks join gains for the Chicago PMI, Dallas Fed, and Philly Fed, but declines for the ISM, Empire State, and Richmond Fed, to leave a 9-month producer sentiment pull-back from robust peaks in November of 2021.
The Global Scene
The European Central Bank pushed up its key policy rate by 75 basis points on Thursday, as expected, and anticipates more rate increases as it strives to get inflation under control with a recession looming.
“This major step frontloads the transition from the prevailing highly accommodative level of policy rates towards levels that will ensure the timely return of inflation to the ECB’s 2% medium-term target.”
At the same time, the ECB raised its inflation forecasts for the rest of this year. Inflation is seen averaging 6.8% this year, well above the 5.1% predicted in March, while it is seen at 3.5% in 2023 and 2.1% in 2024 They also cut growth estimates for 2023 down to 0.9% from 2.1% and 2024 forecasts were cut to 1.9% from 2.1%. The forecasts appear to be optimistic, especially on the growth outlook
The J.P.Morgan Global Composite Output Index fell to 49.3 in August, from 50.8 in July. Output contracted in both the manufacturing and service sectors, the first time both categories have been in concurrent downturns since June 2020.
JPM Global PMI 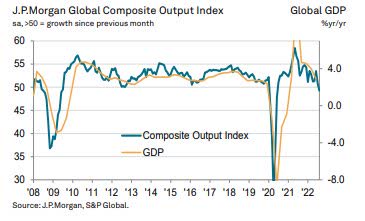
The Eurozone
Final Eurozone Composite Output Index at 48.9 (Jul: 49.9). an 18-month low.
Final Eurozone Services Business Activity Index at 49.8 (Jul: 51.2). a 17-month low.
Countries ranked by Composite PMI Output Index: August
Ireland 51.0 18-month low
Spain 50.5 7-month low
France 50.4 (flash: 49.8) 17-month low
Italy 49.6 2-month high
Germany 46.9 (flash 47.6) 27-month low
The U.K.
The UK Services PMI Business Activity Index once again posted above the 50.0 no-change mark during August. However, service sector growth continues to slide in August as the index fell to 50.9, from 52.6.
The data from China and their Asian counterparts show a completely different picture.
China
Chinese inflation data showed a collapse in producer prices for August with headline CPI falling at a 2%+ rate in August and core CPI (ex Food and Energy) up only 0.7% annualized following a decline that large in July. While the rest of the world struggles with inflation pressure, China is not.
Credit growth is also modest at around 7% annualized total; headline growth beat estimates. After seasonal adjustment, the best proxy for mortgage lending accelerated to the fastest growth rate in six months.
The seasonally adjusted headline Caixin Business Activity Index edged down from 55.5 in July to 55.0 in August, to signal a slightly softer, but still steep, increase in service sector activity. Notably, the rate of expansion was the second-quickest recorded since May 2021. Higher business activity was generally linked to improvements in customer demand and numbers, as disruption due to the pandemic and the impact of restrictions continued to recede.
Japan
The au Jibun Bank Japan Services PMI comes in at 49.5 in August, falling from 50.3 in July and signaling the first reduction in Japanese service sector business activity since March. That said, the rate of decline was only marginal and not as quick as those seen at the start of 2022.
ASEAN
The headline ASEAN Manufacturing PMI posted at 52.3 in August, up from 52.2 in July, marking eleven months of expansion. Moreover, the latest reading indicated a solid improvement in the health of the ASEAN manufacturing sector.
Political Scene
Congress is set to return to session later this month with defense authorization, Taiwan policy, permitting reform, government funding, FDA user fee reauthorization, and a year-end tax extenders bill leading the fall/winter schedule.
Of note will be the permitting reform that was agreed upon by Senate majority leader Chuck Schumer and Senator Manchin. It was the add-on that brought Mr. Manchin on board to pass the entire Tax and Spending bill. This legislation is now under scrutiny and there is plenty of doubt cast that it becomes law. That reform was a part of the agreement that was intended to streamline the permitting process. A process that can only be described as archaic and out of touch with reality.
There exists a HIGH probability that it remains that way.
Geopolitics
Newly elected U.K. Prime Minister Liz Truss’s team announced several initiatives to help alleviate stress from surging energy prices. In a more long-term measure, she announced a lift of the ban on fracking and plans to approve more drilling for oil. In a more short-term-based measure, the new PM also announced a price cap on energy prices for consumers to take effect for the next two years.
That plan would see household bills capped and utilities paid the difference (subsidies) by the government; some support for businesses is also being offered as UK electricity and gas rates explode as part of their regular reset pattern. Crushing energy prices are already working their way through to UK households; the UK has less consumer protection from power price swings than continental economies.
The problem with subsidies is two-fold, first, someone eventually will pay for subsidies in the form of taxes, etc., and there is no free lunch. The U.K. government will be paying 10s of billion in pounds by adding more debt. The Brits find the cost of subsidizing their failed “green initiative” will cost even more. They are now in the unenvious position of subsidizing all of their energy needs.
Second, shielding the consumers from the reality of the situation is a short-term fix. At the end of the day, if consumers feel “comfortable ” with their subsidized bills, they are apt to use more energy, creating more demand. However, policymakers are between a rock and a hard place, alleviate the cost pressure or face the growing civil unrest and backslash of these failed policies. I’ve warned that the “pushback” against this foolish agenda will eventually take place. That day is here.
I’ve recently read optimistic comments about this EU energy crisis, given the progress in reducing industrial demand and building inventories. Many are now saying there are reasons to be less pessimistic about the outlook for the winter. A cold winter, though, could mean extreme inventory challenges, and declines in one-sided markets can be read the same way as huge gains. I don’t believe watching Nat Gas futures is a good way to gauge whether the worst has passed for Europe. This issue is far from resolved and it’s very unlikely this will be the only winter that poses challenges.
Food For Thought
Welcome to “Battery World”
The U.S is on the same path that the Eurozone traveled and while the results may not be as dire, this too will play out as a failed plan that stifles the U.S. economy. In addition, it gives up energy independence.
The transition to “green energy” continues with some states and about 50 cities now banning Natural Gas as an energy source in new building construction. The US has ~100 years of proven Nat Gas reserves which helps keep the US “energy independent”. It is also considered one of the cheapest (1/4 the price of electricity) and cleanest burning fuels on the planet. Most alternative energy sources are dependent on China, so the “Green New Deal” would keep the US beholden to other countries.
In addition to being dependent on communist China, solar panels require more energy and fossil fuel-burning equipment to mine, manufacture, and transport than they save. They also contain toxic chemicals which are employed in the manufacturing process.
Solar and Nat Gas cost about $0.05-$0.06 per KWh but it’s the solar subsidies that bring down the costs. At the end of the day, someone is paying for those subsidies in the form of taxes, etc. Let’s not ignore the fact that one is reliable the other is “sketchy” at best.
Finally, energy demand is outstripping supply TODAY. That is forcing rolling blackouts and other restrictions. Ironically while the commentary is on the future, consumers are being asked to take a step back into the past. It’s 2022 and everyone should be questioning this “new era” that they find themselves in. At some point that reaches a level where consumers will push back.
On the current path, demand will outstrip supply even further, unless infrastructure catches up with demand. Everyone can now do the math and predict the outcome. Let’s also not forget that the current permitting process for these projects will take time. Even if the process does get streamlined, “Battery World” will be lucky to get a small fraction of what they expect permitted. Among other things, the green new deal hasn’t factored in this process. As each day goes by the economic consequences multiply, and that will reverberate throughout financial markets. While that is occurring the pain for consumers will increase, and it isn’t just financial pain.
The EU is about to propose a “mandatory target” for reducing electricity use at peak hours. Here in the U.S., California is the poster child for what is wrong with “green”, and one can only wonder what mandates will be enacted while the “transition” occurs.
Energy independence in 2023 and beyond depends entirely on fossil fuels whether the “green” movement wishes to embrace that or not. Failure to do so is going to have grave consequences for the global economy and markets. Prime Minister Truss has taken the first step (removing the fracking ban) in what will could very well be the slow dismantling of the failed Green Energy transition. I’m not suggesting that “green” be scrapped entirely, BUT it is going to become abundantly clear that fossil fuels MUST be part of the transition. Policymakers had it wrong from day one and MANY continue to have it wrong. You don’t become energy independent by scrapping fossil fuels and going to a source that isn’t ready.
The War on Fossil Fuels
Energy policy and the ability to increase oil production here in the U.S has been tossed around since 2021. Let’s finally end this debate about leasing, permitting, and all of the back-and-forth nonsense about US energy production and acknowledge the FACTS.
“President Biden’s Interior Department leased 126,000 acres for drilling in his first 19 months in office. Truman was the last president to lease out fewer acres (in 1945-46), when offshore drilling was just beginning & the government didn’t yet control the deep-water leases.”
Oil leases (Bureau of Land Management)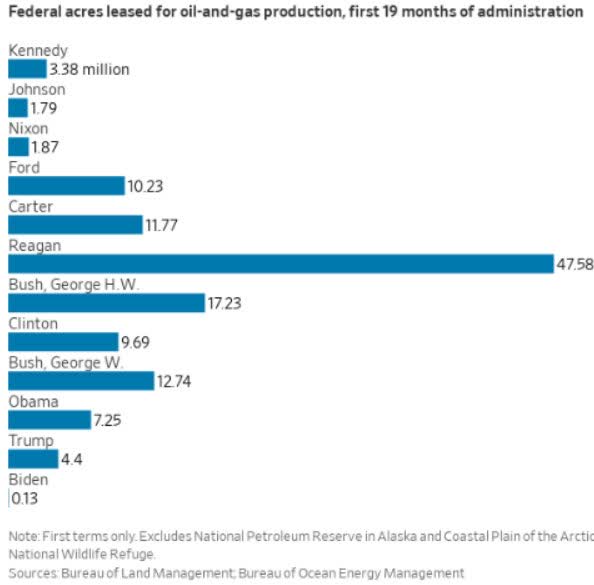
The other presidents on that list all have “millions” of acres next to their names. The Mineral Leasing Act of 1920 requires onshore oil and gas leasing at least quarterly. While the Biden administration has been in office for 6 quarters, it has conducted auctions in just 1 of them. That was in late June after the pressure increased to control soaring gasoline prices.
There is only ONE way to solve the current energy crisis. Increase production and distribution of our current energy sources. We’ve already seen the “initial” consequences of the energy policy that is in place today. This situation will keep inflation elevated, and among other negatives has the potential to morph into severe energy shortages, that will stunt economic growth.
Don’t take my word for any of this, just go take a look at what is occurring in the Eurozone today. Those that have, and control “ENERGY Resources” will rule, all others leave their economic futures to others.
History shows that to be FACT, not OPINION. U.S Energy policy plans to continue with the release of oil from the Strategic Petroleum Reserve. That is hardly a long-term plan. Continued policy mistakes will play a HUGE part in where the global economies and markets are headed in the near term.
China is patiently watching this nightmare play out and has to be smiling. While the “greenies” will never admit it, their selfish strategy has handed China the keys to the kingdom.
Sentiment
In the latest update, only 18.1% of responses to the weekly AAII sentiment survey were reported as bullish. That marked the third consecutive decline in bulls resulting in the weakest reading since the end of April. Meanwhile, Bearish sentiment has rocketed higher, climbing back above 50% last week and rising further to 53.3% this week. That is the highest level of bearish sentiment since the week of June 23rd and ranks in the top 2.5% of all weeks on record.
From a contrarian standpoint, I’d like to think this was all a positive, but during this BEAR market, these contrarian signals have not worked. Maybe this report will produce a different result.
The Daily chart of the S&P 500 (SPY)
Here we go again. A move off the trend line that I have penciled in and the rally has taken the S&P 500 above one resistance level.
S&P 500 9-9 (www.FreeStockCharts.com)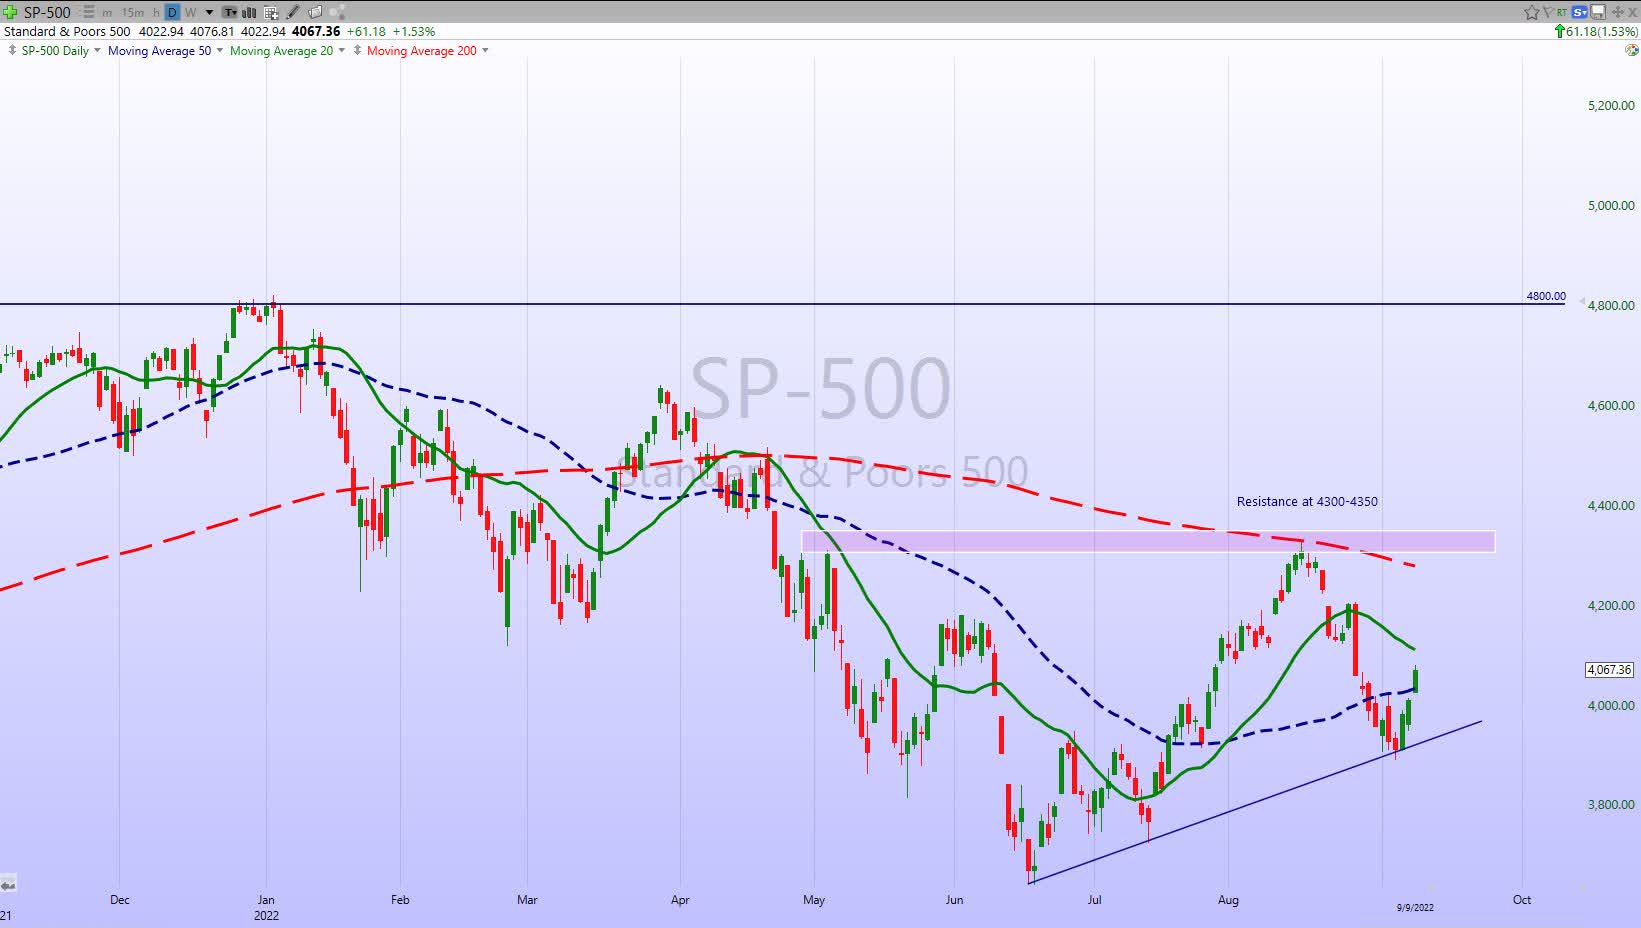
However, there are many more resistance levels to deal with if this rally is to continue.
Investment Backdrop
As noted the major indices entered the week on losing streaks. However, after all of that selling, the S&P 500 wasn’t at oversold levels. Just three sectors – Consumer Staples, Health Care, and Communication Services – were oversold while Energy was the lone sector at overbought levels. The Weak remain in BEAR market trends, and the Strong get stronger. The message stays the same, the latter are the areas of the market where I’ve concentrated attention.
I keep hearing analysts pundits and investors continue to talk about stocks like Microsoft (MSFT), Nvidia (NVDA), Google (GOOG) (GOOGL), Amazon (AMZN), and other popular names as places to be in this market. There is no doubt they are CORE holdings but they aren’t the place to be focusing attention because they are all in BEAR market trends. Unless an investor has a multi-year time horizon there is no reason to be interested in any stock in a BEAR trend.
Ironically I don’t hear anyone talking about “hedges”. All during the BULL market, investors were always putting on “hedges”, citing that the rallies had gone too far. They were all “playing” for a pullback. Unfortunately, they were also playing against the primary UP trend. Now that the trend is in their favor most have lost interest in hedging. Interesting how the average investor’s mind works, and it happens every time. Emotion creeps in and tells them the stock market is stretched to the downside. So there is no reason to be positioned for any more downside. When the Bull market hedgers come back in and start telling me it’s time to play the downside, I will know the market has reached a bottom.
Thank you for reading this analysis. If you enjoyed this article so far, this next section provides a quick taste of what members of my marketplace service receive in DAILY updates. If you find these weekly articles useful, you may want to join a community of SAVVY Investors that have discovered “how the market works”.
The 2022 Playbook is now “Lean and Mean”
Opportunities are condensed in Energy, Commodities, Utilities, and Healthcare. Along with that, I’ve defined two meaningful Bearish to Bullish reversals. The message to clients and members of my service has not changed. Stay with what is working.
Each week I revisit the “canary message” which served as a warning for the economy. The focus was on the Financials, Transports, Semiconductors, and Small Caps. I used them as a “tell” for what direction the economy was headed to help forge a near-term strategy. Unfortunately, all of the canaries remain ill.
Sectors
Energy
OPEC has taken another step in an attempt to keep Oil prices at these levels by announcing a small production cut. However, market participants took it as a signal that they are concerned about a global recession killing demand. Crude oil dropped to a seven-month low before stabilizing and closing the week at $83
I continue to buy weakness in the group.
Natural Gas
The same analysis applies to the dip we saw this week in the Nat Gas ETF (UNG). Both of these energy plays remain in BULL market trends.
Commodities
Uranium (URNM) and Lithium (LTHM), (SQM) were strong (new highs) this week. While Agriculture stocks dipped they made a comeback later in the week. Areas of the market that continue to “work”.
Financials
The “talk” this week was about the strength exhibited in the Financial ETF (XLF) While that is a positive for the overall market any talk of a new BULL trend in the group is very premature.
Healthcare
The Healthcare ETF (XLV) continues to hover just below its Long Term bullish trend line. It is a group that I have “selectively” been active in recently.
Biotech
The Biotech ETF (XBI) had a volatile week but it remained above the trend line that has marked this Bearish to Bullish reversal pattern. At the close on Friday that uptrend has returned 34% since it was brought to readers’ attention in June.
Semiconductors
The semiconductors (SOXX) suffered a seven-day losing streak that led the entire tech complex lower. There is plenty of overhead resistance and the emphasis is on the BULLS to prove their case.
ARK Innovation ETF (ARKK)
Last week I thought the ARKK ETF was going to be challenged to keep this Bear to Bull reversal pattern in place. After moving down to the July lows, the ETF staged a rebound that has kept the series of HIGHER lows in place since the Bear to Bull reversal rally started.
For those that have held the gains have been diminished (now only +16%) but this “trade” is still alive.
Cryptocurrency
While equities and other risk assets have made a sharp pivot lower this week, cryptos have been largely left out. The major cryptos have stabilized, as they are mostly coming off of oversold levels meaning this could simply be mean reversion. Looking ahead, seasonality is not in favor of the asset class as September has tended to be a terrible month for Bitcoin and Ethereum.
While cryptos are slightly higher in the past week, any movement is within a range. Since mid-June, Bitcoin has traded in a tight range between roughly $17,700 and $25,000. While a few thousand dollar ranges may sound like a lot, in the grand scheme of things that is a historically narrow spread.
Bitcoin (www.bespokepremium.com)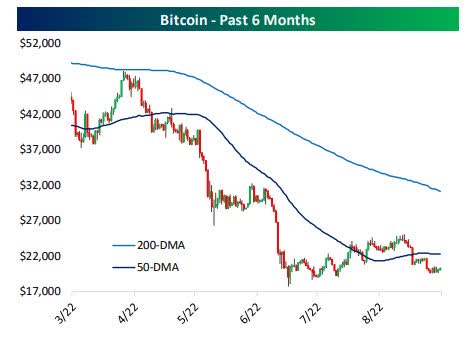
Assuming Bitcoin does not reach a new high or low in this trading range by the end of the month, it will be the tightest three-month range since the spring of 2019. My new Alert service issued two trade signals to members on Friday for the Grayscale Ethereum Trust (OTCQX:ETHE), and Grayscale Bitcoin Trust (OTC:GBTC).
Final Thought
It’s been a tough year, a tough August, and now a volatile start to September with the S&P still down 16% YTD. Meanwhile, several economic hurdles are weighing against stocks and will continue to do so. My approach to the backdrop presented to investors this year has worked out well. I’ve avoided the urge to catch falling knives and disdained the temptation to pile into a stock or sector just because it’s popular. Instead, I thought it was prudent to remain skeptical and force the market to further prove itself. Despite the bouts of FOMO that appear from time to time so far, it has failed to do so. The end-of-week rally is encouraging in the short term, but is it the unwinding of the massive short position that was built up recently, OR is it new buyers entering the scene?
While there could be turning points (up or down) ahead, I refrain from guessing the market’s reaction to the next headline event. The Fed may raise by 50 or 75 basis points, the next inflation report may come in at 6 -7%, and energy prices may fall. The primary trend is down, and until that changes my strategy and positioning (other than tweaking) will remain the same.
I’ll leave it to other pundits to debate the headlines.
A moment of silence to pay respects to Queen Elizabeth II, who passed away this week.
15 different prime ministers served under Queen Elizabeth II. During her reign, there were also 13 separate bear markets in the US (20%+ declines from a high on a closing basis with no rallies of 20%+ in between), including one where the S&P 500 declined over 50% and another where it dropped over 48%. Besides those, there were five other bear markets where the S&P 500 lost more than one-third of its value. In economic terms, there have been eleven confirmed recessions in the US since the Queen was coronated in 1953, and we could be on the verge of a twelfth now.
During the Queen’s 70 year reign, the S&P 500 rallied more than 16,000% or more than 7.6% annualized before even taking dividends into account. With dividends, the annualized rate of return is over 10%. US Real GDP per capita over that same period increased by three and a half times rising from $17,093 to $59,288. With the benefit of all that experience, if you had told the Queen that the economy was contracting or that stocks were on the verge of a bear market, rather than pull her hair out and freak out, instead, in her normally calm demeanor, she would have likely responded with something along the lines of “been there, done that”.
A truly remarkable woman, may she rest in peace.
Postscript
Please allow me to take a moment and remind all of the readers of an important issue. I provide investment advice to clients and members of my marketplace service. Each week I strive to provide an investment backdrop that helps investors make their own decisions. In these types of forums, readers bring a host of situations and variables to the table when visiting these articles. Therefore it is impossible to pinpoint what may be right for each situation.
In different circumstances, I can determine each client’s situation/requirements and discuss issues with them when needed. That is impossible with readers of these articles. Therefore I will attempt to help form an opinion without crossing the line into specific advice. Please keep that in mind when forming your investment strategy.
Thanks to all of the readers that contribute to this forum to make these articles a better experience for everyone.
Best of Luck to Everyone!
Be the first to comment