

hallojulie
“There is no more miserable human being than one in whom nothing is habitual but indecision.” – William James
It’s the same message and the same script week after week. The repetitive negative commentary in this BEAR market is just the opposite of the positive analysis we talk about during a positive market backdrop. So investors better get used to this message.
I’ve stated my case regarding this notion that the Fed is going to “pivot” anytime soon, and in doing so remain opposed to a strategy that is based on “Fighting the Fed”. Trying to time a major pivot by the FOMC has led many investors to losses. The message from the Fed has been clear from Day One. Yet, there are so many market analysts and pundits that continue to pound their message of an upcoming Fed pivot, despite what the Fed is saying. Numerous FOMC members keep hammering out two key themes. First, there is no interest in slowing rate hikes.
Cleveland Fed President Mester:
“I have not seen any evidence to warrant slowing the pace of hikes, and doesn’t “see the Fed cutting rates next year.”
Another theme is that inflation needs to come down before the FOMC will be willing to accept a change of course.
Fed Governor Waller:
“We have not made meaningful progress yet on inflation.”
Fed speakers are placing all the conditionality about the future policy rate around realized inflation rather than less hot labor market data.
Minneapolis Fed President Neel Kashkari:
“The bar to shifting our stance on policy is quite high”.
Of course, the situation can change and so will the Fed’s stance, but in the meantime, it is foolish to try and guess about conditions that are so volatile, and unpredictable. It won’t be long before the market accepts the fact that the Fed is in the game for a while, and eventually prices all of this in. That is exactly what it is doing during these volatile trading days.
Financial conditions have undoubtedly tightened, and are now the least supportive of growth in a decade with two exceptions (2015 and the COVID crash). But what about inflation? Until CPI/PPI/PCE starts to come down, the FOMC is not going to reverse its course. Therefore equity markets, which are already having one of their worst years in history, remain at risk until this rate scenario is completely priced in.
Is everyone putting too much emphasis on the Fed? Is a 4-4.5% Fed funds rate really that restrictive? Ok, let’s jump ahead and give everyone the Fed pivot that they’re clamoring for. What is that going to accomplish? The real issue is the shape of the economy coming into this cycle (back-to-back negative quarters). More importantly, the investment community needs to realize what is missing from the economist’s playbook as they try to forecast the future economy. The question I have posed since the 4th quarter of last year. Where exactly is the growth going to come from? Other than stimulus checks and handouts where are the growth initiatives?
How is inflation going to be quelled when energy costs remain high and there are no initiatives to bring them down? Sure the headlines remind us every day about interest rates and the Fed. From a Macro perspective, this isn’t about the Fed, it’s about the economic backdrop that we were force-fed due to poor decisions and anti-business policies. The markets do have lingering injuries and are trying to recover from inflation, higher interest rates, a stronger dollar, and downward earnings growth revisions. They remain headwinds and were all caused by the same issue. Anti-business, no growth policies.
Market pundits and analysts keep harping on the Fed. The Fed wouldn’t be in the picture if a better business environment were in place. Energy policy has led to high energy costs, high energy costs lead to inflation. Do not lose sight of the poor economic data that has been reported recently. Let me be the first to remind everyone that this entire “NO growth” scene (first half negative GDP) started and is occurring before the Fed’s rate hikes have hit the economy. That confirms the poor policy backdrop that created all of these issues, it isn’t the Fed raising interest rates.
Manufacturing and Services have been in decline and show no signs of a turnaround. This downturn didn’t start yesterday. September ISM Manufacturing showed order backlog, supplier delivery times, and prices paid all at their lowest levels since the Covid shutdown. While Services rebounded last month the index remains in contraction territory, now for the third straight month. I’ll note that Services started to turn down in December 2021. The Fed embarked on this interest rate cycle by increasing rates by 25 basis points in March 2022. The more economists, market pundits, and policymakers concentrate on the Fed, the greater their mistakes when assessing the stock market.
Jobs
The employment scene has remained resilient. But most of what we’ve seen in ’22 are simply the job gains that offset the losses from the pandemic. People went back to work, there has been no real job growth.
In addition to the more lagged official JOLTS report, job postings website Indeed.com published their latest data reaffirming the weaker-than-expected JOLTS number. The number of job postings put up on Indeed’s website remains well above pre-pandemic levels (49% higher than baseline) but that is also well off the peak of 64% reached at the end of last year after postings have gradually fallen throughout 2022.
Job Postings (www.bespokepremium.com)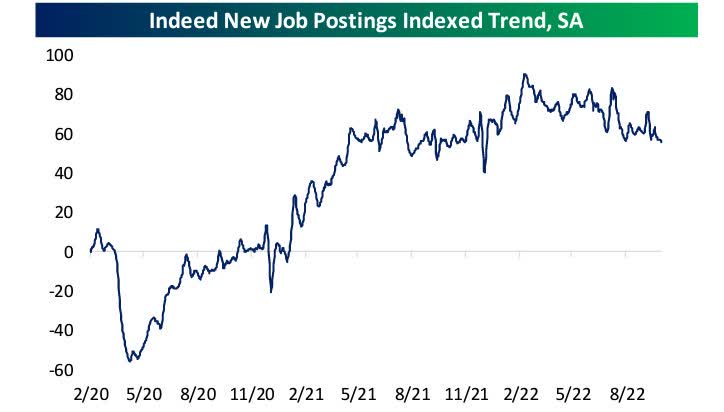
New postings (those that have been on the website for 7 days or fewer) have also been on the decline this year and are 55% above the February 2020 baseline. Both readings are now down to some of their lowest levels since late 2021.
The employment picture has been positive against this negative backdrop, but we are starting to see cracks as employers start assessing this economic picture. In my view, “employment” will eventually roll over and that will put a lid on the growth commentary.
Housing
There is one kink in the economy that is a direct result of higher interest rates. The price of homes may have stabilized but affordability is a huge drag on the sector. With housing, prices stabilized the payment facing new buyers have soared.
Mortgage rates (www.bespokepremium.com)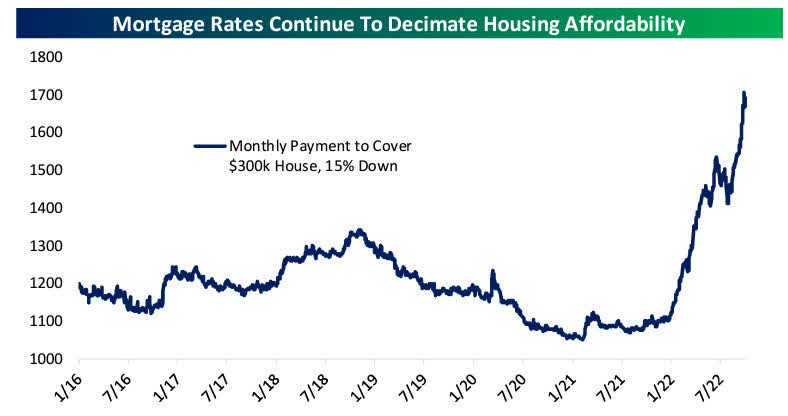
Housing has rapidly gotten very expensive, and the result is a collapse in demand across new and existing homes. However, let’s not forget the warning posted here back in 2021.
If/when inflation comes into the picture due to spending, the Fed comes in immediately to fight inflation.”
We know what happened next. The Fed was forced to enter the picture as spending and policies that increased energy costs gave rise to inflation.
It’s The Economy
It should be abundantly clear. Economic data has been supportive of the Bear market move in stocks. It has been poor and the price action reflects that. That data has come well before the Fed’s interest rate increases. That leads us to a Macro scene that is still loaded with uncertainty.
Now with inflation staying high for so long, it has increasingly weighed on the backbone of the US economy- the consumer. Low disposable income levels and savings rates, combined with weak asset prices, are headwinds to purchasing power. And the Fed, which has come to the rescue in weak economic times over the past decade, does not have that ability right now due to its objective of bringing inflation down to a more reasonable level.
Therefore, the path of inflation will remain highly influential on the economy. Based on what the latest PPI/CPI data reveals inflation remains firmly entrenched. Overall, I can envision inflation moderating slightly over a period of time that in my view is far longer than the pundits suggest. The timing and degree are still unknown. Also, the path to improvement is unlikely to be smooth. What happens to the economy when rates do have an impact, and a no-growth anti-business backdrop is still in place? Investors know that the stock market does not like uncertainty, the price action tells me it’s searching for answers.
During that process, it also has to weigh the potential catalysts to help balance the picture in the short term. A better-than-feared third-quarter earnings season could go a long way in balancing the scales which are firmly tipped to the negative side. During the second quarter earnings season, results surprised on the upside and helped the S&P 500 rally 14%—the best earnings season return since 1Q97.
The Bulls need another “earnings surprise” to make their case that the indices have priced in the worst.
However, over the longer term, all of the issues are going to take a long time to be resolved. Inflation, the global economy, the EU crisis, energy policy, et al are hardly going to be fixed overnight.
Global Scene
There is plenty of poor economic data signaling a recessionary backdrop.
We’ve seen the recent Global Purchasing Manager index results and this chart depicts the poor global manufacturing scene. The Eurozone and China, which along with the US are the three largest economic blocs in the world, both had readings below 50 indicating that manufacturing activity is contracting in both areas.
Global PMI (www.bespokepremium.com)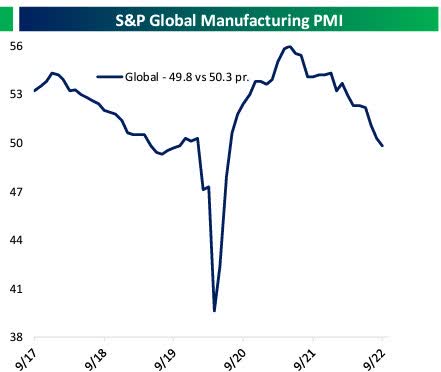
High energy price inflation, weakening demand for inventories, slowing global consumer spending, and other factors are all at work, but the basic trend of weaker manufacturing activity is clear. That pushed the Global Manufacturing PMI into contraction for the first time since the COVID shock; the gauge was also below 50 during the middle of 2019.
Eurozone services PMIs broadly confirmed the story told by manufacturing: a weakening global economy continues to slow. In Europe, that means a fresh decline from just inside contraction last month to a fresh low this month.
Global services (www.bespokepremium.com)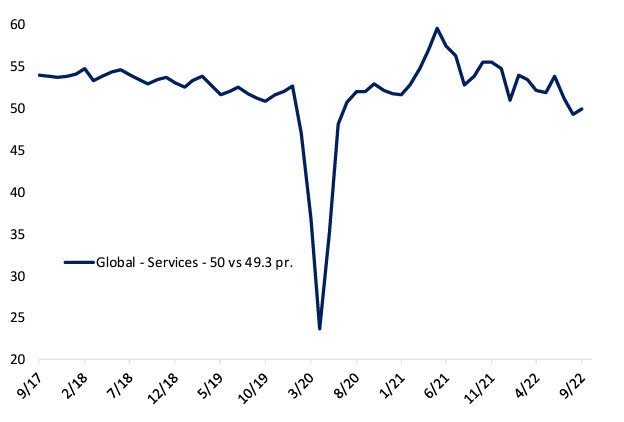
In the US, services PMI recorded an absolutely brutal 43.7 last month, which left room for a material bounce this month. Still, US services PMI remains in contraction per the S&P Global data. Globally, the big bounce in the US helped push up total services activity sequentially but the broad pattern of declines is intact.
The Week On Wall Street
The US dollar and the 10-year Treasury yield were both weaker at the start of the trading day and that presented a catalyst for a strong opening rally. All of the indices rallied, with the NASDAQ (+3.4%) and the Russell (+3.1%) leading the way. The S&P added 2.6%, and all eleven sectors were higher.
After that strong move on Monday, everyone including myself was wondering if this was going to be another one of those one-day wonders. That question was answered with a resounding No. For the moment the obsession with interest rates, inflation, and recession took a back seat to corporate earnings which were offering pleasant surprises. Another session where all of the indices posted gains.
After a 2-day 3.7% rally, a period of digestion is not unexpected and that is what the price action revealed on both Wednesday and Thursday. Investor indecision is still very evident in the markets. The S&P and all of the other indices finished the week on an Up note. Friday’s rally (2+%) solidified the gain for the week in all of the indices. While the S&P has been up and down in the last three weeks, the DJIA has now quietly posted three consecutive weeks of gains. This is an indication that investors are seeking what they believe to be “value”.
The Bulls made a statement on Friday and it remains to be seen if the BEARS are now discouraged.
The Economy
My argument all along has been that the economic data is the reason for the condition of the stock market, and it’s being confirmed once again.
Leading Indicators Continue to Fall
U.S. leading index fell 0.4% to 115.9 in September following a 0.3% slide to 116.4 in August. The index has not posted an increase since the 0.8% bounce in February and has declined in seven of the nine months so far this year. The weakness harkens back to the slump from 2007-2008. The components were mixed.
LEI (www.conference-board.org/topics/us-leading-indicators)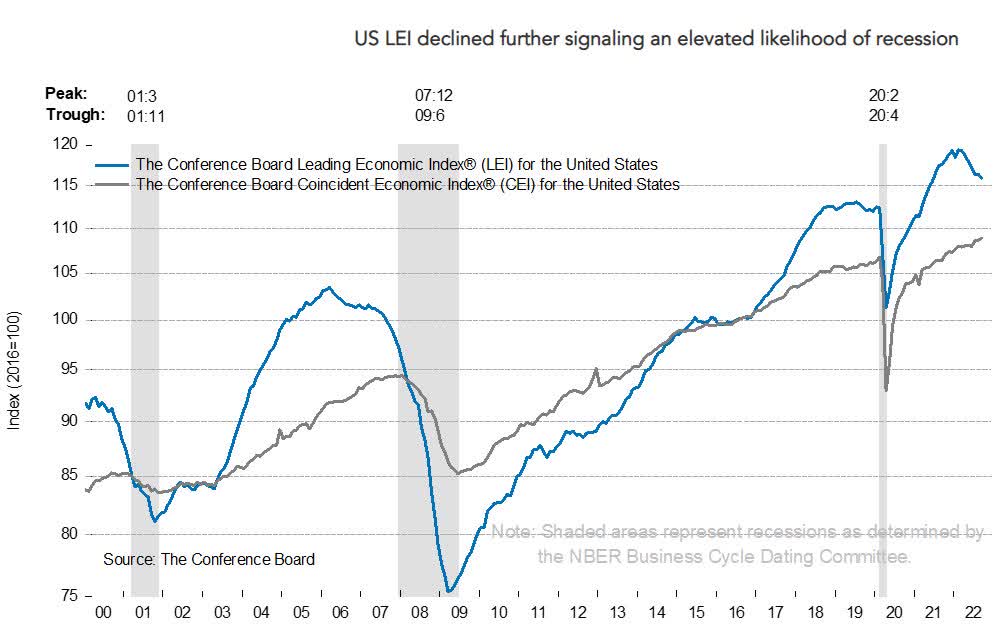
Generally, that kind of consistent drop leads to a recession, which some would argue that we’re already in. I’m not going to quibble on the definition of a recession. The fact of the matter is that the economy still appears to be heading in the wrong direction at a time when the stock market really doesn’t need it to be.
I continue to remind all, the Fed and the interest rate increases entered this scene well after the data turned sour.
Inflation
The eye-popping Year over Year CPI number of 8.2% grabbed the headlines last week. As shown below, YoY CPI first ticked above 8% back in March, and it has remained there in each of the last six months.
Inflation (www.bespokepremium.com)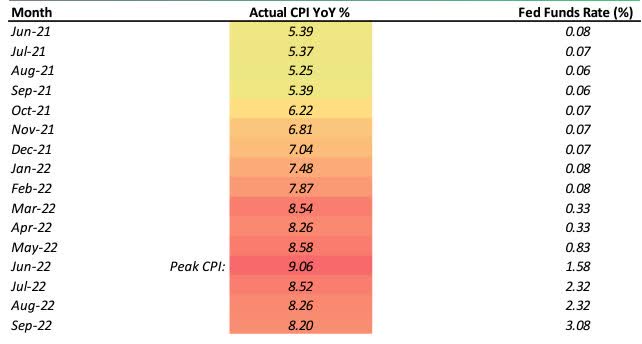
There has been plenty of commentary and some “internal indicators” that have led economists and market analysts to suggest inflation would be on its way down. Many economists then state that we need to “see a Year over Year CPI number somewhere in the 7s” for the equity market to rally.
For that to happen, though, we would have needed the monthly CPI print to come in decidedly negative, which was pretty much never going to happen. Looking ahead, the new forecast says we are more than likely to finally see a YoY CPI reading in the 7s next month.
Stay tuned.
Housing
The NAHB housing market index dropped 8 points to 38 in October after falling 3 ticks to 46. It is a tenth straight drop since rising to 84 in December and is the lowest since August 2012 (the record low is 8 from 2009). The record high was set at 90 in November 2020. The current single-family sales index tumbled 9 points to 45 after slipping 3 points to 54 in September. The NAR noted this will be the first year since 2011 that single-family starts will have declined, and cautioned that 2023 is likely to see a slump too, given the current interest rate outlook.
Housing starts undershot estimates, yet permits remained firm and both completions and starts under construction beat estimates, leaving an encouraging report overall. The data reinforce the view that home builders will continue to deliver products to market and will benefit from reduced supply chain disruptions even as sales prices fall. Given this data, analysts expect GDP growth of 2.0% in Q3 and 0.5% in Q4.
September existing home sales dropped 1.5% to 4.71 million, not as weak as forecast and following a 0.8% dip to 4.78 million. But it is an eighth consecutive monthly decline, the longest since the housing collapse in 2007, to the lowest clip since May 2020. The housing market faces major challenges from surging mortgage rates, now at 20-year highs, which will also limit the willingness of families to move, further exacerbating supply, near record home prices, inflation dynamics (with spillover to slumping builder sentiment), and recession fears.
Manufacturing
The 0.4% U.S. industrial production rise in September beat estimates. Capacity utilization rose to a 14-year high of 80.3% in October which was also seen in July, and previously in August and September of 2018. The persistent industrial production climb suggests an upside to GDP forecasts of 2.0% in Q3 and 0.5% in Q4, after GDP contraction rates of -0.6% in Q2 and -1.6% in Q1.
The Philly Fed Manufacturing Index inched up 1.2 points to -8.7 in October, a little weaker than expected, following the 16.1-point plunge to -9.9 in September. The index has moved sharply this year from a peak of 27.4 in March to a low of -12.3 in July.
Philly Fed (www.tradingeconomics.com/united-states/philadelphia-fed-manufacturing-index)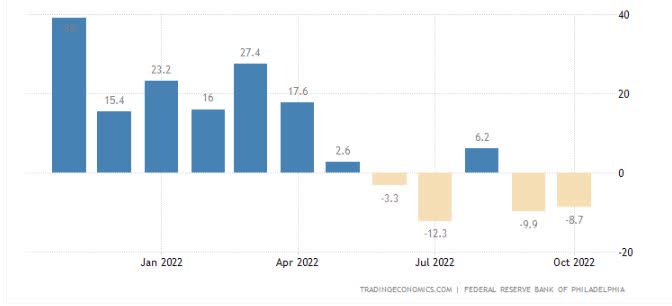
Four of the last five months have posted negative results. Hardly an example of growth.
The Global Scene
China
The outcome of the weeklong National Congress of the Chinese Communist Party will almost certainly include the precedent-breaking reappointment of Xi Jinping as general secretary but will also signal the future direction of Chinese policy through the composition of the Politburo standing committee (the highest decision-making body in the Party) and the end-of-Congress communique.
We can expect Xi’s likely reconfirmation to maintain the current tension in U.S.-China relations, with his consolidation of domestic political power allowing him to continue to pursue controversial signature policy objectives including zero-Covid and a hardline stance on Taiwan. The National Congress is convened every five years to appoint senior members of the party, set China’s policy agenda, and discuss changes to the party constitution. The new premier (who will be announced later in March) and composition of the new Politburo standing committee will additionally be indicative of potential moderating influence— or a lack of moderating influence—on Xi’s policy agenda, particularly with regard to wider market reforms.
China still has yet to release the economic statistics held back during the National Party Congress; no indication of when the data might become available has been offered.
The Eurozone’s Energy Crisis
European gas storage reached 91% of capacity recently this week, that said, Europe’s energy crisis—compounded by the record drought this past summer impacting their hydroelectric grid —is far from over. In this context, some coal-fired and nuclear power plants are getting a second lease on life. Rather than being mothballed as part of mandatory phase-outs, certain plants will be allowed to continue operating for at least through the current winter. Germany is a case study. Three German nuclear plants were shut down at the end of 2021—as it happens, just two months before Russia invaded Ukraine. The remaining three were due to be shut down at the end of 2022, though two are expected to remain in standby mode until April 2023.
The U.K.
Political turmoil has been in the headlines for a while now. Just over three months ago, Boris Johnson resigned as UK PM, and now this week, his successor, Liz Truss, announced she will be stepping down as PM. A Margaret Thatcher phrase seems appropriate now, “She went wobbly”. A new leader will be chosen over the course of the next week, and one wonders if Boris Johnson will make a comeback.
Food For Thought
It’s the same story week after week. The anti-fossil fuel, anti-business backdrop that spawned the weak economy continues.
The Biden administration announced additional releases of oil reserves (as needed) from the Strategic Petroleum Reserve in order to Increase supply and lower the cost of Energy. Specifically the cost of gasoline.
It’s apparent policymakers are aware that an increase in supply can lower costs, but there are no overtures to streamline permitting processes for energy projects unless they are “green”. Unfortunately, what isn’t understood is the fact that “green” projects won’t solve today’s energy cost issues.
The administration intends to repurchase crude oil for the SPR when prices are at or below about $67-$72 per barrel, adding to global demand when prices are around that range. The plan is being touted as a “win” for taxpayers. The prior administration offered to add reserve to the SPR at $24 /barrel in March of 2020 but it was blocked by the democrats who called it a “payoff” to big oil.
This recent announcement came with another admonishment of the oil industry citing the industry’s record profits. The fossil fuel jihad continues amidst record energy costs. In a capitalist society, the government shouldn’t be dictating how any private enterprise runs its business as long as that business is following all legal guidelines.
Those that believe there are no impediments to producing oil in this country simply need to review recent regulatory history, then focus on the additional taxes levied on the industry in the infamous “inflation reduction” act passed in August. During this unnecessary war on fossil fuels, the American Petroleum Institute which represents the US Energy industry has laid out a 10-step plan that has been dismissed by green energy disciples. It details the existing roadblocks to increase production.
Each investor can draw their own conclusions. I watch price action and therefore remain resolute in my position to keep “Energy” (all fossil fuel) as an overweight position in the near term. SPR buying will de-risk crude production substantially because the downside skew in price is largely removed by the looming buys. All else being equal, it should justify a higher multiple on US crude production cashflows. Energy stocks responded to the announcement by rallying 3% on a day when the indices were all in the red.
The war on the sector has produced economic woes and the ills of the overall stock market and it’s why my positioning (other than energy) has been predominantly bearish since February.
The Eurozone is about to enter a recession due to a failed energy policy, as they turn to all energy sources now during the “green energy crisis”. Irony or just plain wrong planning? Turning to “green” when “green” isn’t ready is the root cause of the economic woes in the EU, and now some of the answers to their energy crisis will create more of what they were trying to prevent in the first place. Carbon Emissions. How ironic.
Earnings
EPS reports are coming in ‘better than expected” and that helped stabilize the stock market this week. We’ll get a sense of whether this continues to be a positive catalyst as the Super Bowl of earnings, “big cap” tech reports next week.
My emphasis on EPS remains focused on companies that are raising guidance, and they are highlighted in my Savvy Investor Service available here on Seeking Alpha every week.
The Daily chart of the S&P 500 (SPY)
The S&P spent this past week trying to maintain the rally off the recent lows.
S&P Oct 21 (www,FreeStockCharts.com)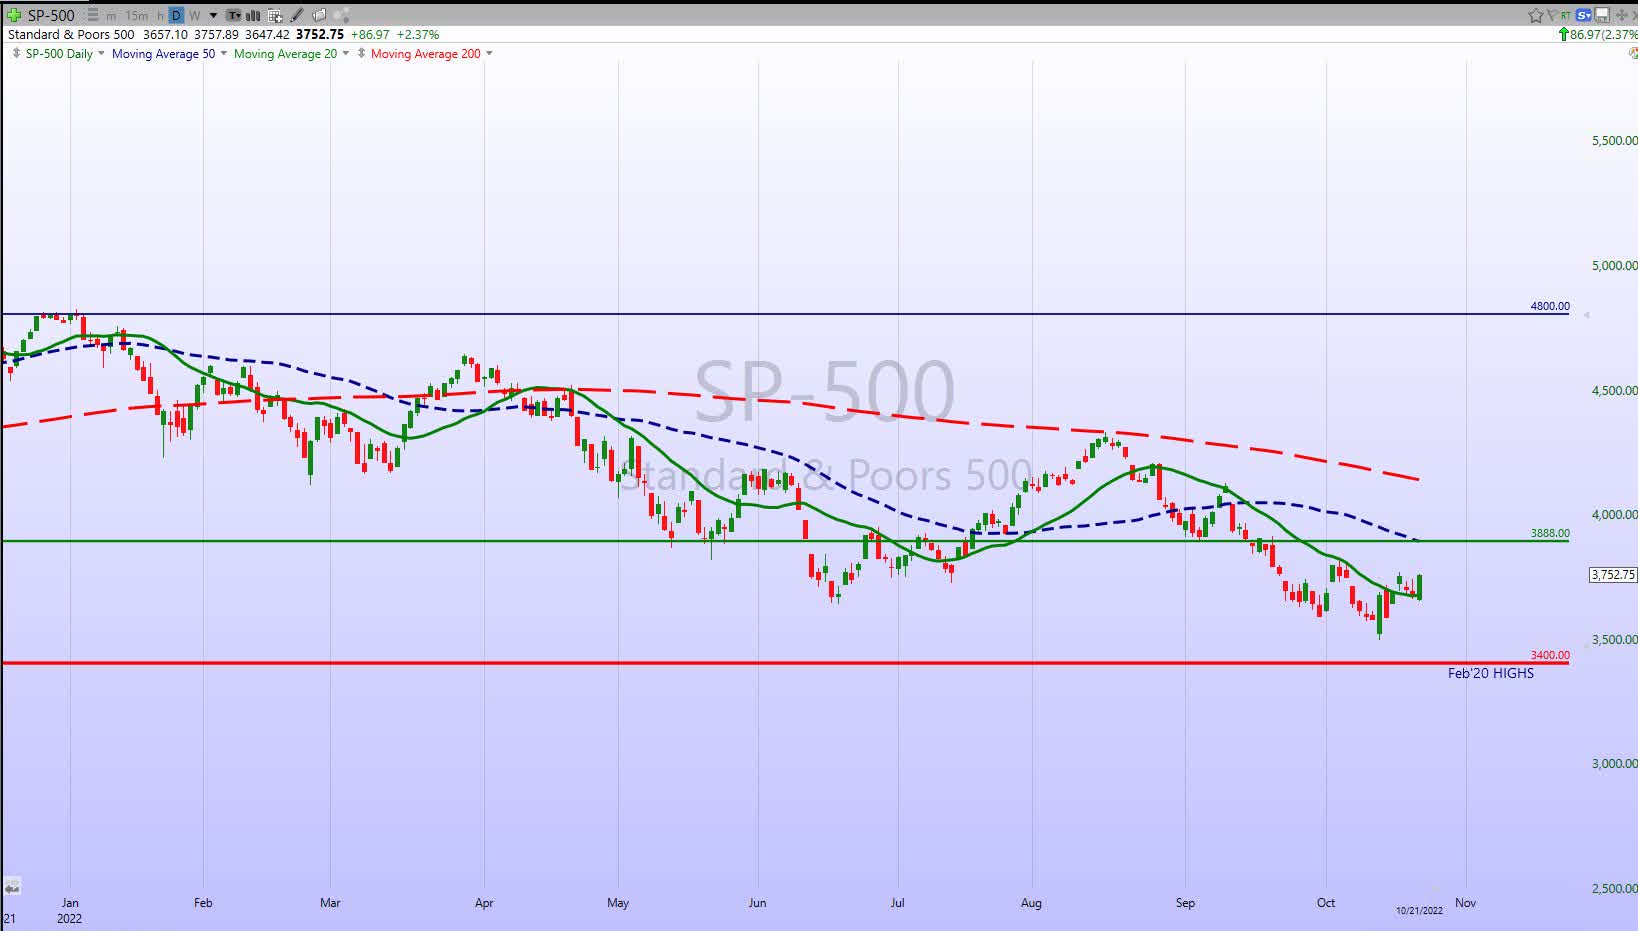
Friday’s rally has now taken the index up to a point where it will test the early October highs. It’s a very fluid situation now as investors are pondering whether we see a replay of the June rally, or more “back and fill” price action.
We already know what the negative catalysts are. Potential positive catalysts are the mid-term elections and solid EPS reports.
Investment Backdrop
The S&P 500 closed on October 14th with yet another 1% decline to close out that week. How markets perform heading into the weekend says a lot about the current state of “risk-taking.” Since traders must wait more than two days to take action on market bets made on Friday, strength into the weekend is suggestive of a more “risk-on” environment, while heavy selling into the weekend means traders are in “risk off” mode.
Bespoke Investment Group;
The S&P 500 has already seen 15 weeks end with a 1%+ down day in 2022, which is tied for the record seen back in 1974 and 2008. A nother 1%+ down day on a Friday today would make it a record 16, and there are still 10 weeks left in the year. Keep in mind that we’ve also seen four straight weeks end with a 1% down day coming into this week, but the streak was borkne thsi Fiday with the S&P closing higher.
So far this year, 36.5% — more than a third – of all trading days to end the week have seen the S&P drop more than 1%. No other years really even come close to seeing this kind of Friday weakness. 1974 and 2008 are the closest comps to 2022 with both seeing 1%+ down days to end the week 29% of the time. Both 1974 and 2008 saw 15 weeks end with a 1% decline, and 2022 has already seen 15 with 11 trading weeks left in the year.”
Another example of the horrible price action this year.
Over the last 200 trading days, only 43% of days have been up days. That may not seem too bad, but it’s actually one of the weakest readings seen over the last 70 years. The only prior periods that saw so few up days occurred in mid 1970, late 1974, late 1982, and early 2003. At least historically, those ended up being some of the best times to buy. Once the trend finally reversed, the script flipped to seeing a lot more up days than down days.
The only thing positive about 2022 is that it will eventually come to an end.
When I look over the situation now I continue to believe (and stress) the technicals will continue to drive the bus in the near term. Recent volatility that contributed to large market swings definitely has the “look” of more mechanical, robotic action. Algorithmic trading and institutional trading platforms are all geared around key technical levels.
As far as the fundamental backdrop, it’s very simple. We’ve known the poor economic scene is already here and with growth incentives absent, it’s a fair assumption a Low/No growth backdrop remains in place. How much of that is already priced in remains a question mark.
A Market Bottom Is A Process
It seems every market participant is walking around looking and waiting for stocks to bottom. We don’t need to see one last waterfall decline and a spike in fear to mark THE bottom. We will need to see the low (whatever level that eventually is) kick off a sideways market that settles into a trading range. When I start to see a series of higher lows Over an Extended period of time, I will get more comfortable that the market has established a durable bottom. I will repeat what has been said earlier. I do not believe there is any “V” recovery in the cards for the economy or the stock market.
Thank you for reading this analysis. If you enjoyed this article so far, this next section provides a quick taste of what members of my marketplace service receive in Daily updates. If you find these weekly articles useful, you may want to join a community of Savvy Investors that have discovered “how the market works”.
The 2022 Playbook is now “Lean and Mean”
Ten of the eleven sectors are in a BEAR market trend, with Energy (XLE) the lone survivor. That leaves investors looking for near-term “long” opportunities with a very limited playing field.
Savvy investors have expanded the playing field, and that is a Must in a Bear market. They benefited from the use of the Index and select sector Inverse ETFs during the recent decline, piling up double-digit gains and acting as a hedge against exposure on the “Long” side. The Inverse ETFs benefit from the primary trend that is in place.
Sectors
With all sectors, (except Energy) residing in BEAR market trends, there isn’t much that interests me these days except a few names in Healthcare, which I added this week as longer-term positions.
Energy
Last week I mentioned that the Energy sector (XLE) was at a resistance level as it was about to encounter the August/September highs which could signal a pause in the rally. XLE was able to poke above those highs this week and now looks poised to assault all-time highs set in June. There is no doubt that the sector has been the clear winner. Just when there was talk that this trade was over, the XLE gained 21% in October and is up 53% this year.
Natural Gas
It’s been a nail-biting time for investors that own the Natural Gas ETF (UNG). The ETF was on a tightrope as it hugged the 200-day support trend line until it fell off and dropped 22% this week. The ETF is now at the July lows and a break here indicates that the ETF was on the tightrope without a net as the next move lower can kill the Bull trend established this year.
It’s a different story for LNG (liquified Natural Gas) as stocks in this sector remain quite resilient and in strong Bull uptrends. An area of the investment scene that has produced profits this year. The fundamental picture remains robust. LNG will remain in High demand as the EU struggles to dig out of its dependence on Russian energy supplies.
Financials
The week started out on a positive note as EPS reports were quite good. However, the “technicals” took over and the sector ETF (XLF) pulled back right at a key resistance level. The group rebounded on Friday, but until prices can break out above resistance, the downtrend remains in place. The group has been in a Bear trend since June.
Commodities
When I look at the chart of the Commodity ETF (BCI), I see a short-term sideways pattern while it struggles to hold on to its Longer term Bullish trend. This sub-sector demonstrates that despite inflation running Hot the effects of a Bear market have nullified any significant uptrend. Then again, in a BEAR market sideways is a “win”.
Healthcare
Healthcare (XLV) is another sector that continues to outperform by the simple fact that it is moving in a sideways pattern. Of the 10 sectors that have lost ground this year, Healthcare has dropped the least. The ETF is just below its long-term trend line as it tries to hang on to its Bull trend. I’ve uncovered select opportunities in the Medical Device group recently, and I’m convinced most names in Healthcare can withstand a slowing economy much better than many other groups.
In the interim, the sub-sector of large-cap pharma has been a steady outperformer with many individual stocks posting solid gains in ’22. Merck (MRK) and Eli Lilly (LLY) have been mentioned here this year and they set new all-time highs on Friday.
Biotech
The Bear to Bull reversal pattern has been tested but so far has not been broken. We have now witnessed a series of LOWER highs in the ETF since August. That downward pressure is about to meet up with a potential test of the September lows. What occurs after that will likely determine the next big move for Biotechs. I have not given up on this reversal pattern.
Technology
The NASDAQ and the Technology ETF (XLK) remain in steep downtrends. Until the series of lower highs that we’ve experienced since the August peak is broken, it could be more back-and-forth trading in a defined Bear trend that frustrates everyone.
Semiconductors _ Sub-Sector
The once market-leading Semiconductor Index (SOXX) were showing some possible green shoots recently. Unfortunately, those green shoots are in a severe test as the ETF struggle at resistance levels.
The SOXX made a new low on October 13th and that was also a new relative low vs the S&P 500. Neither is suggestive of a market bottom and sends up more red flags in the near term. The ETF closed right at a downtrend line that has capped all rallies since late August. Next week could determine if any late-year rally attempt has a chance of occurring.
ARK Innovation ETF (ARKK)
When ARKK sank to a new low last week it removed another potential positive divergence in the market. Unless there is a very quick snapback it has also nullified the Bear to Bull reversal pattern. It had been interesting that even as the S&P 500 and other indices made new reaction lows, the ultra-speculative ARKK did not. However, that is no longer the case and it helps confirm the recent weakness across the general market.
ARKK continues to be the poster child for the speculative bubble that has now burst, down 78% from its all-time high in early 2021. Many have not received that message, however. Cathie Wood’s marketing remains on point, with ARKK bringing in another $100 million in inflows over the past month and $1.2 billion year-to-date (source: Eric Balchunas @Bloomberg).
Anything is possible, of course, but it’s just hard to believe that we’re going to hit a major market bottom with people still piling into ARKK and similar funds.
Cryptocurrency
Bitcoin is slightly lower over the past week as it moved above and below the $19,000 level at various points intraday. While that level has been eyed in headlines, perhaps more importantly from a technical perspective, the world’s largest crypto is once again attempting to move back above its 50-Day moving average. As shown below, the past few months have seen Bitcoin trade in an increasingly tight range having held up at support while making a series of lower highs.
Bitcoin (www.brespokepremium.com)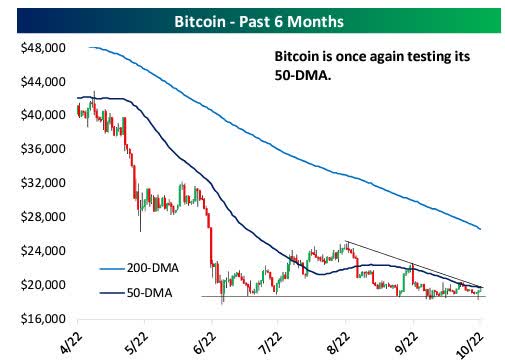
While Bitcoin eyes a breakout (potentially higher or lower), we should note that although Bitcoin has not made any considerable progress moving higher or lower, volumes have held up relatively well.
Final Thoughts
The opening quote reminds us all that he who hesitates is lost, and with the uncertain and confusing backdrop, many investors are hesitating. Making investment decisions based on facts instead of bias or conjecture helps with the “indecision” factor. Listening to the noise and rhetoric that accompanies the investment scene increases the “indecisiveness” level of every investor.
I have made it a point to state how economic policy errors in the last two years have impacted the economy, and I’ve based my observations on the data. Data that is unquestionably poor in an inflationary backdrop. No one has to agree with my assessment. However, market participants need to agree with the message from the stock market, and that message is very clear. The Bear market started this year and has taken the major indices down ~25-30%. I continue to believe that unless there is a change in economic policy, the economy will struggle. We don’t need to be a Ph.D. to realize that a struggling economy is bad for the stock market. At times it is necessary to go back in history to make a point and look at how economies and markets work.
What Is Needed Today
Bill Clinton’s presidency is marked by an epiphany of sorts when he came to realize what needed to be done to keep the economy strong. Once he abandoned the failed “Hillarycare” health reform (socialist) ideas, he “changed” to a pro-growth (capitalist) agenda.
The history books tell us that during his presidency, his objective became one that looked to make government smaller, less wasteful, and more agile in light of a newly globalized era. “Clintonomics” cut welfare programs, enacted a Small Business Job Protection Act, and the result was a Rise in revenue. Between January 1993 and September 1999, the number of welfare recipients dropped by 7.5 million (a 53% decline) to 6.6 million. During his tenure, the economy could boast the longest economic expansion in history; the lowest unemployment since the early 1970s; and the lowest poverty rates for single mothers, black Americans, and the aged. The Bull market during his Presidency was a sight to behold.
It should be clear to all investors that a “change” in “Bidenomcs” will be needed to stabilize the economy and bring growth back into the picture. Some will disagree based on their beliefs, but the economic data and the stock market confirm my views. Therein lies the dilemma for investors as they ponder the realistic probabilities of a repeat of the Clinton epiphany. Perhaps the first step comes in the form of the mid-term elections. Pollsters now have updated election outcome probabilities as follows:
- GOP Sweep (50% ) — GOP controls the House and the Senate.
- Split Decision (35%: ↑5%) — GOP takes the House and Dems maintain control of the Senate.
- Status Quo (15%: ↓5%) — Dems maintain control of the House and Senate.
In today’s MACRO backdrop this isn’t about politics. It’s about trying to enact a combination of ideas that will promote growth. If nothing else the “gridlock” scenario that is being presented with these results, might be enough to stabilize the situation for investors. For those that are looking for a reversal in trend, I’ll leave investors to ponder this.
Political gridlock is fine when the economy and the financial markets are in growth mode. That is because the probability of a change to a winning formula is Low. During a poor economy saddled with inflation, political gridlock can then mean the chance for any positive change is remote.
Therein lies a situation that can easily snowball into a very deep recession that lasts a long time. In my view, the probability of any “Clintonesque epiphany” is extremely Low.
It’s your move, give it some thought but don’t hesitate too long.
Postscript
Please allow me to take a moment and remind all of the readers of an important issue. I provide investment advice to clients and members of my marketplace service. Each week I strive to provide an investment backdrop that helps investors make their own decisions. In these types of forums, readers bring a host of situations and variables to the table when visiting these articles. Therefore, it is impossible to pinpoint what may be right for each situation.
In different circumstances, I can determine each client’s personal situation/requirements and discuss issues with them when needed. That is impossible for readers of these articles. Therefore I will attempt to help form an opinion without crossing the line into specific advice. Please keep that in mind when forming your investment strategy.
Thanks to all of the readers that contribute to this forum to make these articles a better experience for everyone.
Best of Luck to Everyone!
Be the first to comment