Darren415
By John Welling
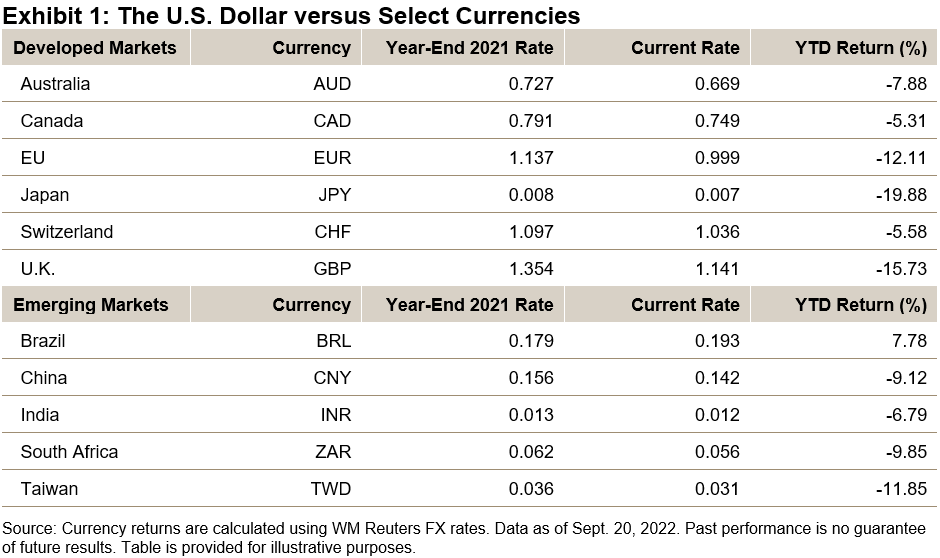
U.S. dollar strength has led to parity in EUR-USD exchange rates in recent days, with the value of the euro equaling 99 U.S. pennies at its low. While 114 U.S. pennies were still required to equal the British pound sterling, “cable”—the GBP-USD rate—has reached its lowest since 1985.
In Asia, the Japanese yen has suffered the most YTD of any developed market currencies versus the U.S. dollar. Meanwhile, the Chinese yuan has surpassed 7 to the U.S. dollar, while the Brazilian real gained in contrast.

Year-to-date, the Dow Jones FXCM Dollar Index, which measures the U.S. dollar versus the most liquid currencies, was up 9.03%, capturing the general trend in U.S. dollar strength.
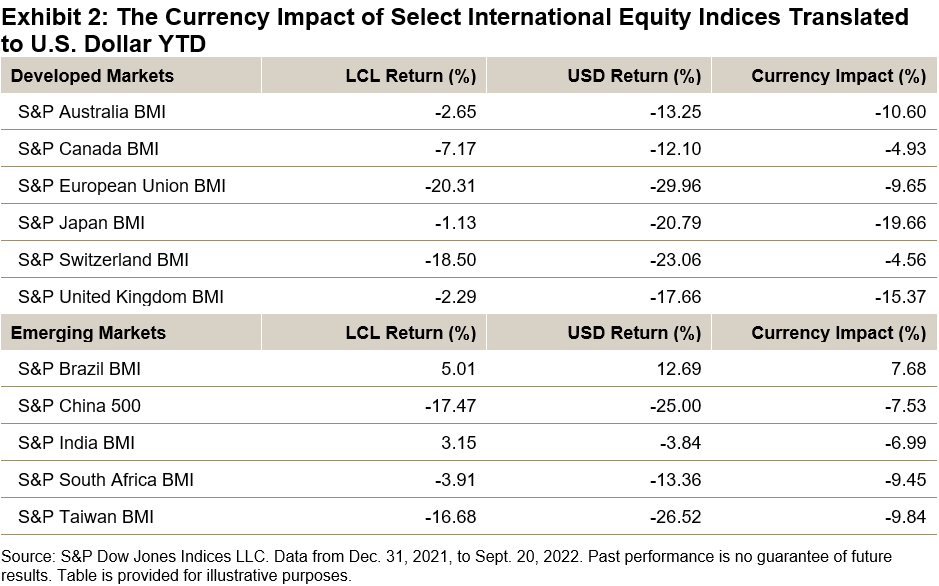
For U.S. investors holding equities from these markets, this means returns of these holdings have decreased when translated back into a stronger U.S. dollar, compounding the weak underlying market performance. To estimate the impact of this broad currency weakness versus the U.S. dollar, Exhibit 2 shows country index returns in both U.S. dollar and the local currency (LCL).

In aggregate, developed market indices have been most affected, with the performance relative to the local currency return decreasing by more than 11% YTD. Meanwhile, currency losses were more mitigated across emerging markets, in part due to the offsetting gains in the Brazilian real.

Exchange rate moves can have a meaningful impact on international equity performance. While recent global market performance has been weak, U.S. investors have been doubly affected by currency underperformance versus the U.S. dollar. If the current trend reverses, a weakening U.S. dollar would become additive to international equity returns for these investors.
Disclosure:
This post is an opinion, not advice. Please read our Disclaimers.
This material is reproduced with the prior written consent of S&P DJI. For more information on S&P DJI please visit www.spdji.com. For full terms of use and disclosures please visit Terms of Use.
Copyright © 2022 S&P Dow Jones Indices LLC, a division of S&P Global. All rights reserved.
Editor’s Note: The summary bullets for this article were chosen by Seeking Alpha editors.


Be the first to comment