

JasonDoiy
Introduction
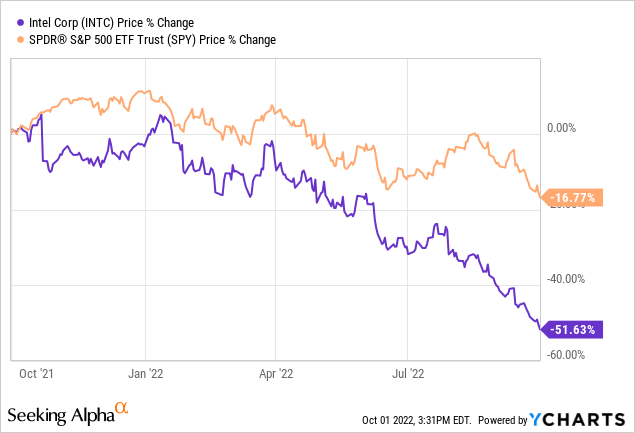
Intel Corporation (NASDAQ:NASDAQ:NASDAQ:INTC) is an American technology industry leader and the world’s largest manufacturer of semiconductor chips, a product commonly found in your own laptop and other electronic devices. The company operates in a fairly competitive Semiconductor Industry with U.S. and global chip makers. Year-to-date, Intel’s stock price has performed substantially worse than the broader market, with it declining as much as 51.63% and the S&P 500 (SPY) losing 16.77% in market value.
As you may know, the drop in economic activity has had a significant impact on Intel and shares are currently cheap. Despite this, I still see potential in Intel stock as a good long-term investment because of its excellent financials, quick product adoption and expansionary plans, strong dividends, and many other factors. Let’s begin with an in-depth company activity analysis of what has occurred thus far.
Company Activity
After the stock price declines in Q2 2022, management has been quick to adjust primary business focuses and organizational changes to bring the company back to a meaningful growth trajectory. Intel CFO David Zinsner recaps us on this in the Q2 2022 Earnings Release:
We are taking necessary actions to manage through the current environment, including accelerating the deployment of our smart capital strategy, while reiterating our prior full-year adjusted free cash flow guidance and returning gross margins to our target range by the fourth quarter… We remain fully committed to our business strategy, the long-term financial model communicated at our investor meeting and strong and growing dividend.
Intel has been finding growth in large traditional and high-growth emerging markets. I still noticed that in Intel’s Financials section, the company is generating strong operational results. Below is a history of Intel’s TTM financial metrics such as gross profit, EPS, and EBITDA. To start off, Intel, a mature company, has been keeping up with inflation growth at a CAGR of ~3% (calculations from December 2012 to December 2021) in their gross profit metrics. This is no surprise as demands in the semiconductor industry have been high and the company is an industry leader.
Seeking Alpha (Gross Profit) (Seeking Alpha)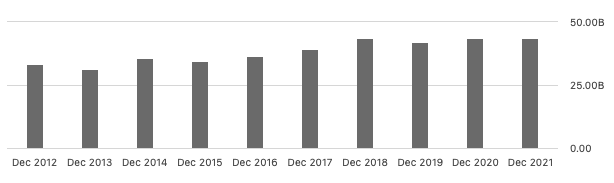
I am also seeing a continuous pattern of stabilized growth in EPS and EBITDA as a result of Intel’s profitable business strategy. To achieve a more realistic growth percentage, I calculated the 10-year CAGR on Intel’s Normalized Basic EPS from December 2012 to 2021 to get a solid growth of 6.3%. I also calculated EBITDA’s 10-year CAGR growth from December 2012 to December 2021 to be a 4.3% CAGR. These growth rates are solid results for a mature company in a cyclical industry, and I strongly believe that we will be seeing solid CAGR growth in the coming years despite the uncertain economic outlook.
EPS (Seeking Alpha)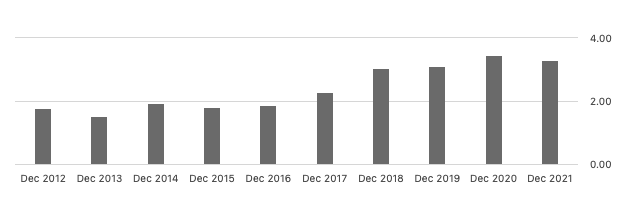
EBITDA (Seeking Alpha)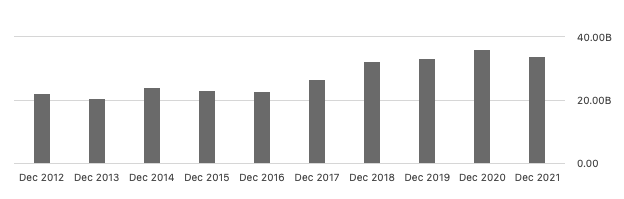
Now onto the balance sheet. Intel’s balance sheet is robust and management has been quick and effective in minimizing debt since debt levels reached an all-time high on September 30th, 2020. The debt to equity ratio was 0.40 during that time, and as of June 30th, 2022, management has reduced the ratio to a mere 0.32 (representing a -20% reduction). Intel also has been growing their cash on hand at a 17.2% 5 year CAGR (calculations from June 30th, 2018 to June 30th, 2022) and they currently have $27.044 billion. Finally, it is my view that Intel will be able to maintain this trend, especially with an effective and agile management providing great results.
Debt to Equity (MacroTrends)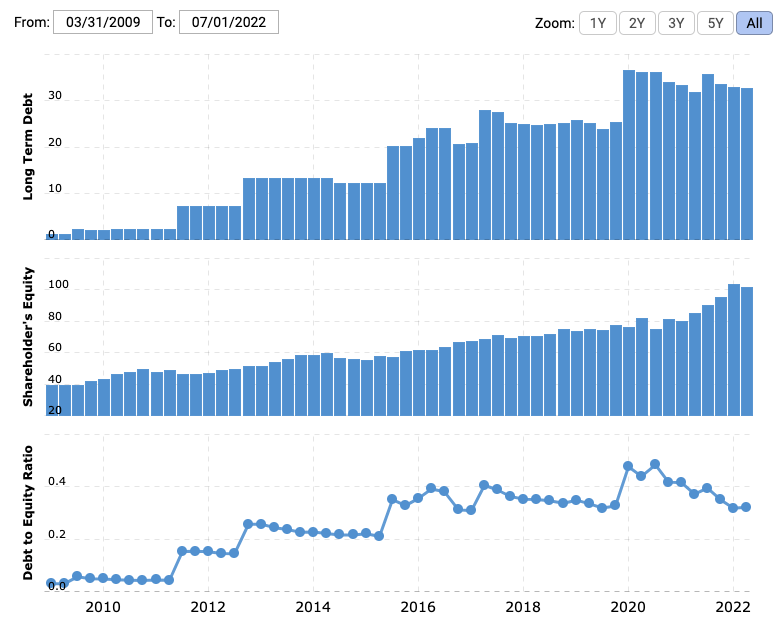
Cash on Hand (MacroTrends)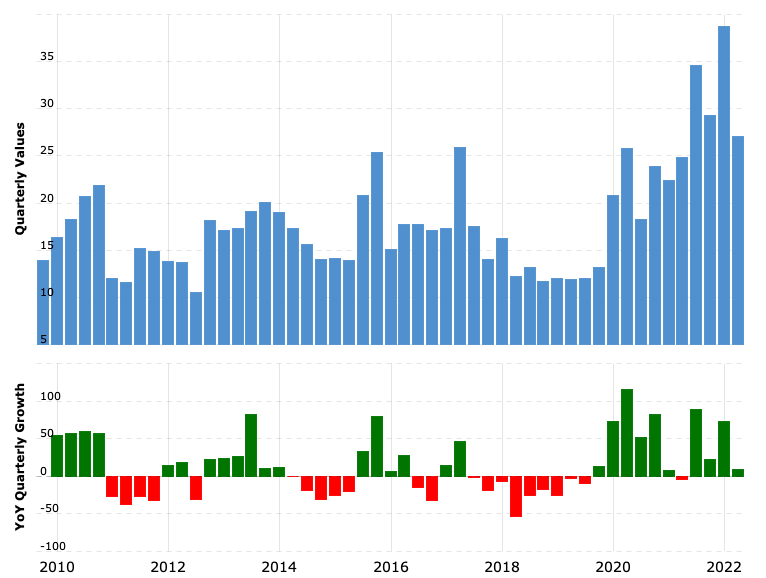
New 13th Gen Core Processor Family Potential
Intel is constantly innovating and taking great leaps to push forward the Semiconductor Industry. Starting off on September 27, Intel launched their 13th gen core processor family which comprises 22 processors and more than 125 partner system designs. Executive Vice President and General Manager of the Client Computing Group, Michele Johnston Holthaus on their launch puts it this way:
We are raising the standards of PC performance once again with our latest generation of flagship 13th Gen Intel Core Processors… The 13th Gen Intel Core family is the latest example of how Intel is enabling amazing experiences to happen on the PC – at scale and across all PC product segments. Combine this with an industry-leading partner ecosystem and new solutions like Intel Unison, and together we are showing the world what’s truly possible with the PC experience going forward.
Intel’s new 13th Gen Core desktop processor builds upon their Intel 7 processor, and overall enables a much better system performance than ever before. It also has up to 24 cores (including E-cores) and 32 threads with an unmatched overclocking experience to further consumer needs. Constant innovations with industry-leading capabilities in these new chips demonstrate Intel’s ability to maintain its industry-leading position and set the bar high for competitors to overcome. Below is a visual from HotHardware on what the chip includes.
HotHardware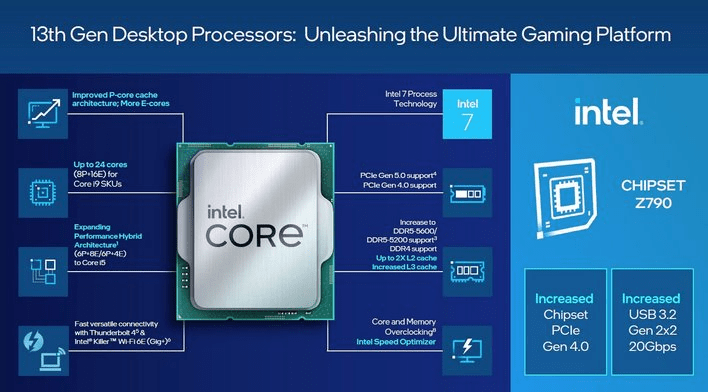
Furthermore, on August 23rd, Intel also unveiled their Semiconductor Co-Investment Program (SCIP). This joint initiative includes its first partner, Brookfield Asset Management (NYSE:BAM), to fund $30 billion for 2 new semiconductor factories in Chandler, Arizona. Furthermore, SCIP allows Intel to keep debt capacity available for other projects and development all while advancing their IDM 2.0 growth strategy. Demand for semiconductor GPUs and CPUs still remains robust and these launches demonstrate Intel’s swift and proactive approach to capitalize off and position themselves for future growth that I believe the market has not realized yet.
Q2 2022 Earnings Presentation
Soaring Dividend Yields
I think that the best part about this stock lies in its strong dividends growth overall. It is no surprise that Intel has been a high dividend yielding stock with excellent shareholder returns. As of August 3rd, Intel paid shareholders 36 cents per share and when annualized, the yield amounts to 3.69% based on its current stock price. In the past 10 years, Intel has never cut its dividend, and has paid out dividends consistently for 28 years. 10-year dividend growth has had a CAGR of 5.37% which I believe to be a meaningful growth rate as it outpaces inflation. I fully trust Intel CFO David Zinsner’s quote mentioned above on “We remain fully committed to our business strategy, the long-term financial model communicated at our investor meeting and strong and growing dividend”.
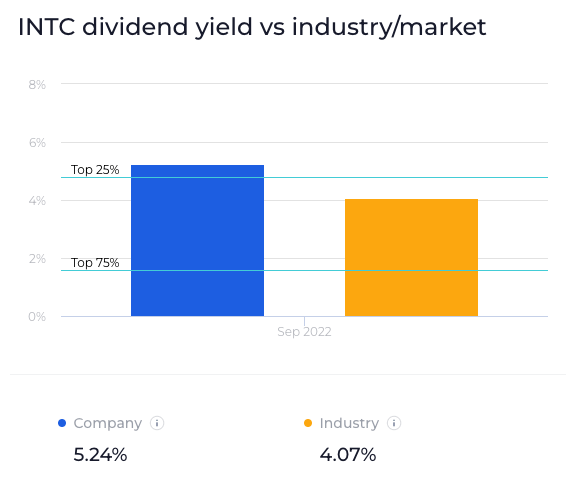
Intel now pays an annual dividend of $1.48 per share (based on previous quarterly dividend payouts), translating to a 5.67% annual yield—this is much higher than S&P 500’s 1.64% annual yield. Furthermore, I noticed that Intel’s 5.67% yield ranks them well over the top 25% of US-listed companies and the semiconductor industry. A robust TTM EPS of $2.05 covers the yearly dividend per share expenses, resulting in a high but still sustainable payout ratio of ~72%. This ongoing growth and solid momentum moving forward makes me believe that the company is well-positioned to further a) grow dividend metrics for the foreseeable future and b) provide returns to fulfill investor’s needs in this current inflation-heavy environment.
WallStreetZen WallStreetZen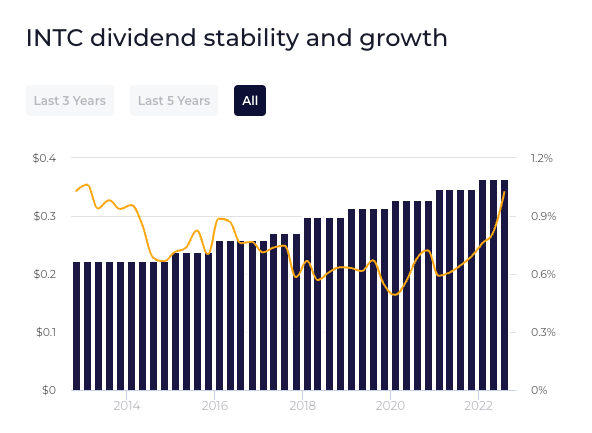
YCharts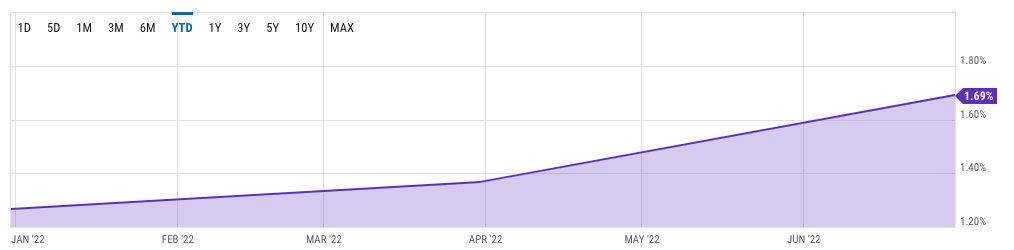
Stock Valuations
As a mature company with robust FCF, Intel was valued using the Discounted Cash Flow (‘DCF’) method with a more conservative approach to yield a more accurate base case result. Intel’s Free Cash Flow (‘FCF’) metric has seen some losses in previous years, so I based this DCF model on the 10-year average FCF value from 2009-2018 to produce a more consistent FCF metric rather than utilizing the TTM Free Cash Flow number. The 10-year average FCF value was $10.5 billion. I then estimated a 2% terminal growth rate and a moderate 7.39% FCF growth rate (derived from 2009-2018 FCF CAGR), which I believe shows a reasonable assumption in the future that’s in line with the company’s previous historical performance. Finally, with a high WACC of 10%, my DCF model resulted in an intrinsic price of $39.50 which presents a 53.3% upside from its current stock price.
Google Sheets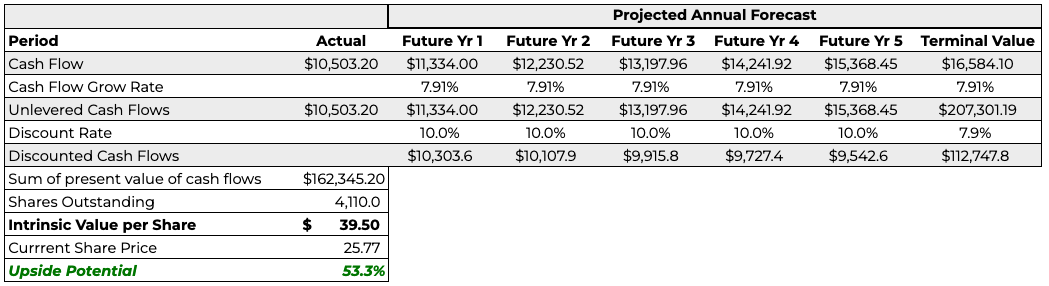
Next, because of Intel’s excellent dividend yield, I also valued the stock using conservative dividend assumptions from the Gordon Growth Model (‘GGM’). The GGM valuation approach works by assuming a constant sustainable dividend growth rate and discounting it back into the current stock price with a required rate of return, summed up into this equation: “value of the stock” = “dividend per share” divided by “discount rate – dividend growth rate”. GGM often undervalues stock prices in general as dividend growth is conservatively assumed to be constant.
Using this methodology, I first based my model on an annualized $1.48 dividend per share from the previous 4 quarters (price history from Seeking Alpha). Then, I reasonably derived a discount rate of 7.0% from the cost of equity based on a 3-year levered-beta of 0.73. To be very conservative, I estimated that dividends will grow in-line with inflation, so I calculated the average 5-year growth rate of the 10-year treasury yield to be 3.83%. Plugging these 3 key values into the equation, which I found reasonable given the stable growth trends so far, resulted in an intrinsic value of $46.69 per share representing a 81.2% upside from the current price of $25.77.
Google Sheets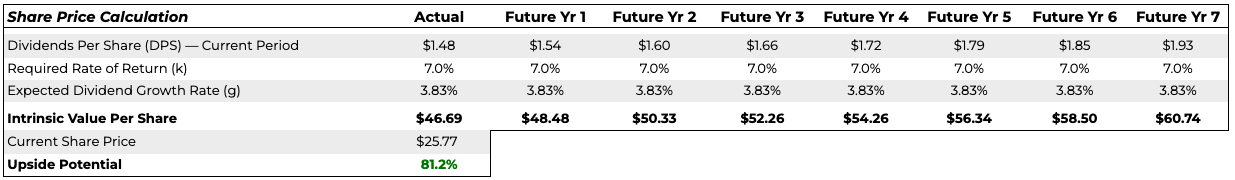
Finally, to further support my valuation, I noticed that Wall Street is also bullish on Intel. Yahoo Finance reports 34 analysts having a mean price target of $37.51 with the range spanning from as low as $20.00 and $72.00. My conservative DCF and dividend models fall short of the mean price, and I believe that this is comparable to the price ranges among professional analysts’ methodologies. This is all evidence that INTC stock is currently undervalued by the market as it is already below the lowest price target.
Yahoo Finance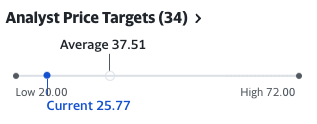
Risk Headwind
The biggest systematic risk that I see standing for Intel is the impact of the rising inflation rates on the markets as Intel’s stock price has seen volatility because of it. Here is a visual on just some of the key results from the economic environment that affected Intel from Q2 2022 Earnings Presentation.
Q2 2022 Earnings Presentation
Additionally, interest rates are still likely to rise as the economy worsens. As Federal Reserve Vice Chair, Lael Brainard, puts it in a recent article covering this:
Weather conditions in several areas, including China, Europe, and the United States, are exacerbating price pressures through disruptions to agriculture, shipping, and utilities.
However, after witnessing sustained rise in dividend yields and profitability of its continually evolving business strategy, I believe Intel is a stable investment that can weather the economic storm. For investors, the dividend will also function as an inflation hedge and moat. Intel is also actively building collaborations with well-known companies in order to keep inflation from having a significant impact on the corporation. Here’s what has happened so far from the Q2 2022 Earnings Release:
In DCAI, Intel expanded its supply agreement with Meta, leveraging its IDM advantage so that Meta can meet its expanding compute needs. In the quarter, Intel agreed to expand its partnership with AWS to include the co-development of multi-generational data center solutions optimized for AWS infrastructure,and Intel as a strategic customer for internal workloads, including EDA.
Competitor Comparisons
The last part of my thesis is formulated on Intel’s strong global competitive positioning within the Semiconductor Industry. To visualize this, I created a table below showing key semiconductor financial metrics from Intel and top competitors such as Advanced Micro Devices (NASDAQ:AMD), Nvidia (NASDAQ:NVDA), and more that investors could seek out as an alternative investment.
My table of financial metrics such as P/E, P/S, and EBITDA derived from Yahoo Finance data yielded solid results. Intel has a cheap valuation compared to peers in terms of P/E and P/S. In terms of EBITDA, Intel has the highest number, with Broadcom (AVGO) coming quite close at $18.16 billion. So, where do we go from here? Intel has a lot of opportunities to grow and I think that the company can maintain its industry-leading position for the foreseeable future with all of the reasons covered above.
|
Company |
Ticker |
P/E |
P/S |
EBITDA (Billions) |
|
Intel |
INTC |
8.98 |
1.97 |
25.33 |
|
Advanced Micro Devices |
AMD |
13.04 |
4.08 |
5.64 |
|
Nvidia |
NVDA |
36.10 |
10.34 |
10.68 |
|
International Business Machines |
11.78 |
1.81 |
12.16 |
|
|
Qualcomm |
8.81 |
3.11 |
16.79 |
|
|
Broadcom |
AVGO |
10.89 |
6.08 |
18.16 |
|
Applied Materials |
10.94 |
3.04 |
8.27 |
Conclusion
Intel stock is an appealing buy opportunity for investors following their second quarter report and an unfair market beatdown by the markets. Their financials with still-strong dividends, as well as fresh industry-impacting product prospects, are all reasons to buy this stock. Based on conservative assumptions, my Discounted Cash Flow and GGM Dividend Model resulted in a minimum intrinsic price of $39.50, or a 53.3% undervaluation by the market. This view is also supported by 34 experts from Yahoo Finance. With all of these supporting arguments, as well as those discussed above, I recommend a “Buy” on INTC stock as shares are too cheap to ignore.
Be the first to comment