

gremlin/iStock via Getty Images
Introduction
As a dyed-in-the-wool value investor, I have a natural interest in the investment-related actions of value investing legends like Charlie Munger and Warren Buffett. Hardly surprising, I own stock in several businesses that are also owned by Berkshire Hathaway (BRK.A, BRK.B), notably those that are characterized by wide economic moats and highly profitable business models. However, with names like Coca Cola (KO), Johnson & Johnson (JNJ), Procter & Gamble (PG) and Visa (V) in mind, it seems rather surprising that Berkshire Hathaway built a stake in information technology company HP Inc (NYSE:HPQ) in the first and second quarters of 2022. According to its most recent 13-F filings with the SEC, and a Form 4 filing from April, Berkshire now owns nearly 121 million shares of HPQ, representing a stake of more than 10% and therefore requiring compliance with fairly stringent reporting rules.
The news that Berkshire has built a position in HPQ, currently valued at $3.2 billion, making it a reasonably significant position (by comparison, BRK’s stake in KO is currently worth $25.3 billion), surprised me, especially given that the company operates in a highly competitive and largely commoditized industry – it manufactures and distributes desktop computers, laptops, workstations, displays and printers, and competes with Lenovo Group (OTCPK:LNVGY, OTCPK:LNVGF) and Dell Technologies (NYSE:DELL).
In this article, I will compare HP to Dell. As a long-term investor who values reliable and growing cash flows, both companies are in principle potential investments because they operate in an industry characterized by constantly replaced equipment due to end of (service) life or ever-increasing performance requirements (Wirth’s law seems to apply after all). I will compare the business models of the two companies, their growth prospects, current profitability, balance sheet quality and dividend safety, key risks and current valuations.
However, I will not discuss Lenovo, even though it’s the current market leader in estimated personal computer (PC) units shipped, according to technology research and consulting firm Gartner, with a 25.2% market share vs. 18.7% for HPQ and 17.7% for Dell. While I concede that I could be missing out on a solid value opportunity by not looking into Lenovo, the mere fact that investor rights in China are highly uncertain leaves me uninterested. At least, however, those interested do not have to resort to shares in dubious variable interest entities as for example with Alibaba Group (BABA), but can actually invest in ordinary shares listed on the Hong Kong Stock Exchange (ISIN HK0992009065), or in American Depositary Receipts (ADRs, ISIN US5262501050, ticker OTCPK:LNVGY), according to Lenovo’s website.
HP & Dell: Overview Of The Two Companies And Growth Expectations
Former technology behemoth HP Inc. has narrowed its business lines over the years. After spinning off its Enterprise Services division in 2017, which has since operated as Hewlett Packard Enterprise Company (HPE), what remains is a company focused on PC systems, components, printers and related supplies. The Personal Computers segment accounted for 70% of revenue in fiscal 2022. In this segment, HP sells notebooks, desktops, workstations and other products. The continued success of notebooks is reflected in the segment’s 66% contribution to total revenue and 18% year-over-year revenue growth in fiscal 2021, with people increasingly adopting working remote due to the measures implemented to contain the spread of SARS-CoV-2. The overall segment grew 11.2% year-over-year in fiscal 2021 and 1.7% year-over-year in fiscal 2022, driven by stronger sales of desktops and workstations and a modest decline in notebook sales. Personal computers are HP’s main revenue driver, but the printer segment is far more profitable (three-year average of 17.2% vs. 6.6%). In fiscal 2022, HP generated 56% of its operating profit in the Printing segment. The printer business is extremely competitive and in secular decline, and HP is increasingly focusing on subscription-based models to stabilize the business. Revenue contribution from the Corporate Investments segment, which includes HP Labs and business incubation projects, is negligible at just $2 million compared to total fiscal 2022 revenue of nearly $63 billion. HP’s fiscal year ended October 2022, and for fiscal 2023, analysts expect net revenue and adjusted earnings per share to decline 9% and 18%, respectively, which does not seem unreasonable given a widely anticipated recession on the one hand and a normalization of increased pandemic-related demand on the other. In fiscal 2024 and 2025, analysts estimate that EPS should grow in the high single digits, largely due to aggressive share repurchases. Analysts’ estimates have become more accurate since the spin-off of HPE, but the expectations for fiscal 2024 and 2025 should still be taken with a grain of salt, also because HP generates around two-thirds of its revenue in international markets.
HP is undoubtedly heavily dependent on the sale of client and consumer hardware. Desktops, notebooks, monitors, and especially printers are commoditized products, but the industry is quite consolidated, as highlighted in the introduction. In this context, Dell’s diversification into enterprise solutions seems important to me because I believe that on-premise server hardware is in principle stickier than for example client hardware. The fact that the company generates about 20% of its revenue from services also is quite reassuring. Of course, cloud-based solutions are expected to make on-premise servers increasingly obsolete, but Dell also is active in this area through its Infrastructure Solutions Group. Dell owned a majority stake in virtualization specialist VMware (VMW) until it spun off its 80% stake in late 2021, but the two companies will continue to work closely together. Revenue from multi-cloud and Big Data solutions and on-premise servers accounted for 36% of fiscal 2022 revenue (ending Jan. 28, 2022). The segment grew 4.1% year-over-year in fiscal 2022, while revenue declined 4.0% year-over-year in fiscal 2021. Operating profitability is fairly stable at 11.2% (three-year average). Like HP, Dell generates most of its revenue (64% in fiscal 2022) from sales of branded desktops, notebooks, workstations, displays, etc., but its segment margin is slightly higher than its competitors’, with a three-year average of 6.9%, and less volatile (standard deviation of 0.2% vs. 0.6%). Like HP, Dell sells its products and services globally, but with about 50% of international revenues, it’s less vulnerable to recessions in international markets and to exchange rate fluctuations.
Dell has been taken private in the past and went public again in 2018. Michael Dell is the company’s largest shareholder. In recent years, profit growth has been very good and was only partly attributable to acquisitions. For fiscal 2023, which ends in January 2023, analysts expect total net revenue of $100.88 billion, in line with fiscal 2022. Adjusted earnings per share are expected to be nearly $7.5, representing 20% year-over-year growth. Analysts expect an 18% decline in fiscal 2024, followed by 10% growth in fiscal 2025. However, given the cyclicality of the business and the commoditized nature of most of the products offered, I would not over-interpret these expectations.
Assessment Of Profitability
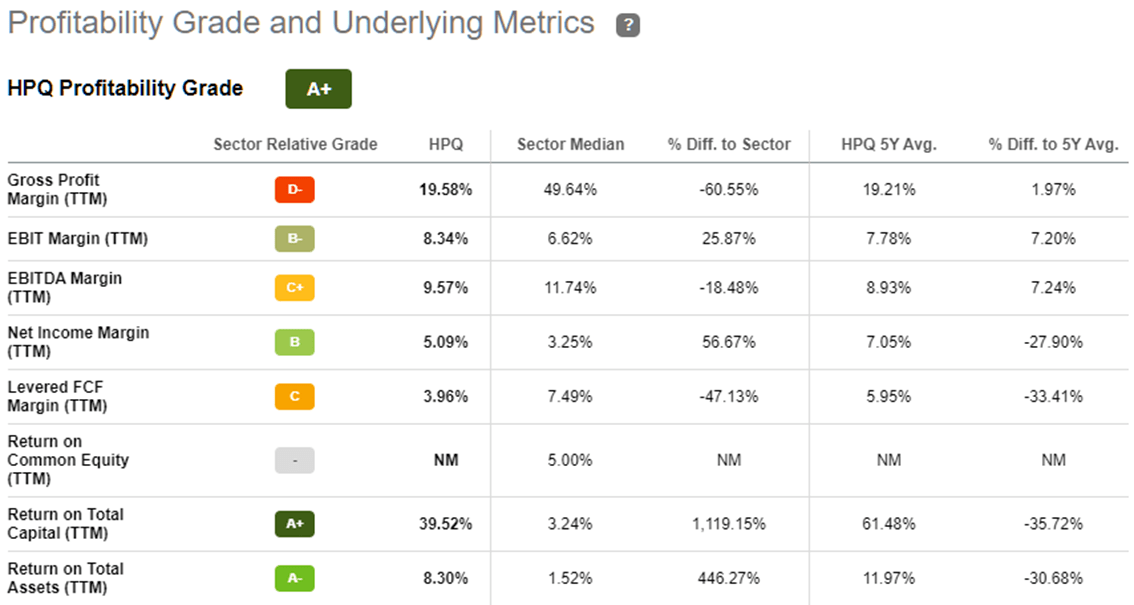
As already noted, the profitability of the two companies’ client hardware segments is largely similar, but Dell has a slight edge. Printing solutions are HPQ’s profitability pearl, but due to intense competition and high churn rates (printer vendors make it extremely easy to switch, switching costs are de facto zero), I would not bet on HP maintaining its high profitability in this segment. All in all, the two companies are similarly profitable, as shown by the data published on the two companies’ stock quote pages on Seeking Alpha:
Figure 1: Profitability metrics for Dell Technologies Inc. [DELL] (taken from the company’s stock quote page on Seeking Alpha) Figure 2: Profitability metrics for HP Inc. [HP] (taken from the company’s stock quote page on Seeking Alpha)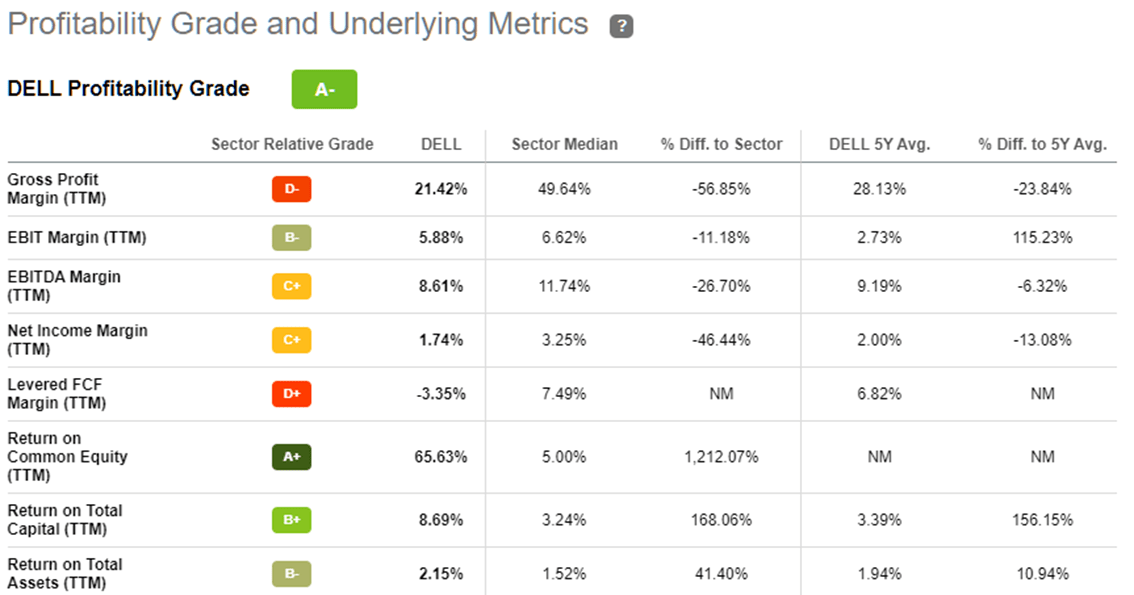
From a cash flow perspective, when normalizing free cash flow to account for working capital movements, stock-based compensation (significantly higher for Dell, Figure 3), and recurring restructuring charges (HPQ regularly reports ~$300M in annual restructuring costs), Dell has an edge, although its 5.9% free cash flow margin nonetheless indicates that it operates in a largely commoditized industry. Nevertheless, HPQ’s normalized free cash flow margin of 4.0% is considerably weaker, as is its cash flow conversion.
Figure 3: Stock-based compensation at HPQ and DELL, in percent of pre-compensation normalized operating cash flow (own work, based on the companies’ fiscal 2017 to 2022 10-Ks)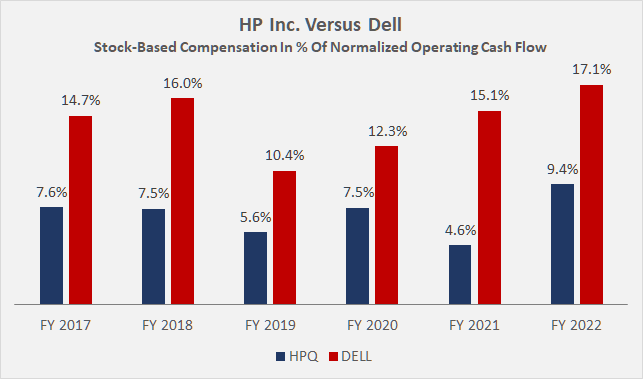
From a working capital management perspective, the two companies are largely tied, but Dell’s cash conversion cycle is slightly better at -43 days versus -31 days for HPQ (five-year average). The difference is largely due to inventory days, which have increased at HPQ from 44 days in fiscal 2017 (HPE spinoff) to 56 days in fiscal 2022. Because of HPQ’s more modest asset base, however, its return on invested capital is higher than Dell’s. Both companies generally generate a return on invested capital that exceeds their weighted average cost of capital as determined by the capital asset pricing model (CAPM). As noted, HPQ’s cash conversion is weaker than Dell’s, but the leaner asset base still results in a better cash return on invested capital (CROIC) of 14% vs. 8% using normalized free cash flow expectations of $2.6 billion and $6.0 billion, respectively. However, it should be borne in mind that ROIC and CROIC are relatively volatile for both companies due to their pronounced sensitivity to economic cycles.
Balance Sheet Quality And Dividend Safety
Leverage is substantial at both HP and Dell. Equity is currently negative in both cases, but since cash flows are quite strong for the time being, the notional debt repayment periods of the two companies appear manageable at around four to five years. It seems worth noting that about one-third of Dell’s debt is non-recourse. The company maintains financing programs for leases, loans, and alternative payment structures (referred to as DFS debt, pp. 111 f., fiscal 2022 10-K). In terms of interest coverage, I would favor HPQ over DELL, as the company’s ratio is currently 9.5 times normalized free cash flow before interest, compared to Dell’s 5.0x. However, Dell’s ratio has improved in recent years as interest expense has declined from $2.3 billion in fiscal 2020 to $1.5 billion in fiscal 2022.
Moody’s upgraded Dell’s long-term unsecured debt rating two notches from Ba2 to Baa3 (BBB- S&P equivalent, the lowest investment grade rating) in October 2021. Currently, the long-term rating has a stable outlook. HP’s long-term debt has a slightly better rating (Baa2, BBB S&P equivalent) with a stable outlook after a downgrade in 2015, which occurred well before the Enterprise Services business was spun off.
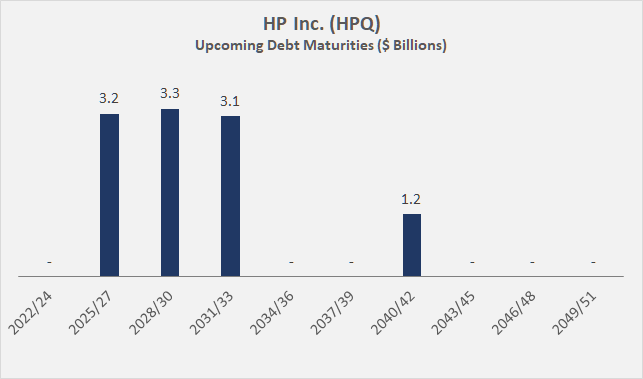
Figure 4 and Figure 5 illustrate the upcoming maturities of Dell’s and HP’s debt, respectively. Dell’s near-term maturities should not be over-interpreted given that annual normalized free cash flow is typically around $6 billion and that the 2022/24 and 2025/27 buckets include maturities of DFS-related debt. Dell’s approximate weighted average interest rate is still higher than HP’s, at 4.6% vs. 3.7%. However, given that HPQ is currently engaged in a fairly aggressive share buyback program and that interest rates could remain elevated for the foreseeable future, this differential is likely to narrow.
Figure 4: Upcoming debt maturities of Dell Technologies Inc. [DELL] (own work, based on the company’s fiscal 2022 10-Q3) Figure 5: Upcoming debt maturities of HP Inc. [HPQ] (own work, based on the company’s fiscal 2022 10-K)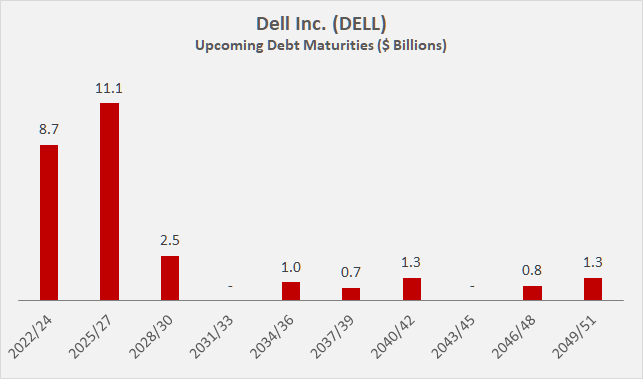
HPQ and DELL currently pay fairly generous dividends of $1.05 and $1.32 per year, respectively, on a quarterly basis, representing current yields of 3.9% and 3.4%. Dell has only been paying a dividend since 2022 and therefore does not have a history against which to judge its reliability. HP’s dividend compound annual growth rate is very enticing at 14.2% on a three-year basis and 12.0% on a six-year basis. HP’s payout ratio to normalized free cash flow is higher (40% vs. 16%), but far from worrisome. On a side note, according to several websites, Dell’s payout ratio for fiscal 2023 seems rather scary, as the company’s free cash flow will be very low that year. This is due to the fact that Dell is aggressively reducing accounts payable ($4.5 billion year-to-date), which will impact the company’s free cash flow if working capital movements are not taken into account.
As an income-oriented investor, I’m somewhat ambivalent. Dell’s non-existent dividend history is not very reassuring, even if the payout ratio is very modest relative to normalized free cash flow. As a conservative and long-term-oriented investor, I take comfort in companies whose dividend histories span several decades and include periods of economic contraction. HPQ’s dividend history is quite reassuring, but if interest rates remain elevated for longer, the company will face higher debt service costs that could force it to moderate or abandon its share buybacks altogether. In such a case, dividend growth is likely to be dampened as well. In the event of a severe economic downturn, the cash flows of both companies are likely to decline significantly, but the dividends appear to be reasonably secure. During the Great Financial Crisis, HPQ was able to maintain its dividend. Nevertheless, due to the cyclicality of the cash flows, I would want to hold companies like Dell or HP only in a broadly diversified portfolio and make sure that the associated dividend income represents only a small part of my total income.
Risks
In addition to the balance sheet risks already mentioned, there are several other risks worth discussing. Switching costs are generally low in the industry, but I believe HPQ is at a slight disadvantage compared to Dell because it focuses on commercial and consumer desktop and notebook PCs, monitors and printers, while Dell has a solid infrastructure segment that is somewhat stickier. The secular decline in consumer PCs has been evident for several years, so it is reasonable to assume that it is reasonably priced into the stocks.
HP’s significant exposure to printers and related devices (30% of fiscal 2022 revenue, 56% of operating profit) suggests that the company would suffer disproportionately from a decline in this segment. HP is trying to stabilize this segment through subscription-based models, but this does not change the fact that the printer business is extremely competitive. All major printer manufacturers offer subscription-based models, so it is only reasonable to expect that the margins – currently still solid – will erode over time.
Less than 35% of HP’s fiscal 2022 net revenue was generated domestically, suggesting that the company is quite sensitive to exchange rate fluctuations since it reports its earnings in dollars and also pays its dividend in dollars. The same is true for Dell, but it is less sensitive to exchange rate fluctuations, with foreign exposure of only about 50%. Both companies’ foreign currency exposures are certainly hedged to some degree, but it is easy to understand that such hedges come at a significant cost and do not provide complete protection against adverse effects.
As both companies occasionally engage in mergers and acquisitions, execution and integration risks should be borne in mind. In addition, the goodwill positions at both Dell and HP are significant at 30% and 22% of total assets, respectively. As I highlighted in another article, an increase in interest rates not only directly impacts stock valuations, but can also lead to impairments of goodwill and other assets as the discount rate used to measure fair value increases. This can result in a double whammy for shareholders, as such GAAP earnings-relevant impairments can trigger emotional selling.
Finally, both companies have ownership structures worthy of consideration. Michael Dell holds the majority of voting rights in DELL. Of course, this can be beneficial to minority shareholders, as Mr. Dell certainly has an interest in his company remaining profitable and among the top performers in the industry. However, the company has been taken private in the past, and minority shareholders should be aware that they are at the mercy of the founder. While I would not over-interpret this risk, it’s certainly worth considering, especially if one is looking to invest in Dell over the long term. Squeeze-outs in times of depressed share prices do happen. The fact that Berkshire Hathaway already owns more than 10% of HPQ shares should also be carefully considered and also viewed in light of the ownership structure of other BRK holdings such as Occidental Petroleum (OXY).
Valuation And Verdict
For comparability and due to the fact that HP spun off its Enterprise Services business in 2017, I have reverted to the Fast Graphs plot for HPQ for fiscal 2018 to 2022 (Figure 6). In my view, the market is well aware of the company’s cyclicality and lack of an economic moat. The mid-single-digit price-to-earnings ratios for HPQ and also DELL (Figure 7) confirm that the market is very modestly valuing the two companies. A mean-reversion to their “normal” price-earnings ratios of about 9 within three years would result in annualized total returns of 14% and 24%, respectively, if analysts’ estimates prove correct. As noted above, however, I would not over-interpret earnings expectations. In any case, I would be cautious about extrapolating current earnings further out into the future, as both companies are cyclical and lack any form of significant economic moat.
Dell is also cheaper than HP from a free cash flow perspective, with an FCF yield of 20% versus 10%, but of course these numbers should be taken with a grain of salt given the volatility of cash flows. Investor service Morningstar currently has HP Inc. rated at three stars and Dell at four stars, representing fair value estimates of $30 and $50, respectively. HP’s fair value estimate is viewed with a high degree of uncertainty due to its exposure to the printing sector.
Figure 6: FAST Graphs plot for HP Inc. [HPQ] (obtained with permission from www.fastgraphs.com) Figure 7: FAST Graphs plot for Dell Technologies Inc. [DELL] (obtained with permission from www.fastgraphs.com)![Plot for HP Inc. [HPQ]](https://static.seekingalpha.com/uploads/2022/12/23/49694823-1671800040897481_origin.png)
![Plot for Dell Technologies Inc. [DELL]](https://static.seekingalpha.com/uploads/2022/12/23/49694823-16718000594789505_origin.png)
Being a value investor myself, the current high free cash flow yields of both companies are certainly tempting. However, given their cyclicality, I would only be interested in building a position in a much worse environment. Both Dell and HPQ are still significantly more expensive than they were in the midst of the pandemic-driven sell-off in 2020. Of course, I am not suggesting that we will see levels like that anytime soon, as the situation back then was certainly very unique. But as is the way with cyclical companies, the best time to buy them is when investor pessimism is at a very high level, and I do not think that is the case yet.
In principle, I can understand why Berkshire invested in HPQ, but of course it is important to remember that it’s a rather modest position with a current value of $3.2 billion. Still, the company throws off a significant amount of cash, and Berkshire receives about $130 million a year from HPQ in dividends, which is nearly 20% of the cash inflow from its stake in The Coca-Cola Company. It is unlikely that the generous dividend shower will end anytime soon, but it seems reasonable to expect HPQ to scale back its buyback program so as not to jeopardize its debt servicing capacity. The company’s higher ROIC and CROIC, as well as its lower capital intensity, are likely other reasons why Berkshire chose to invest in HPQ, as well as the company’s efforts to premiumize its offerings and increasing emphasis on subscription-based printing solutions. Finally, the better long-term debt rating may also have played a role.
Personally, I would prefer to invest in Dell, as it has a better-diversified portfolio and I believe its enterprise solutions are stickier. I also prefer Dell’s less pronounced international involvement. However, Michael Dell’s concentrated ownership, the fact that the company has gone private in the past and lastly the de facto inexistent dividend track record caused my initial optimism to fade rather quickly. It’s possible that Dell’s ownership structure also played a role in the hypothetical case that Berkshire was considering an investment alongside HPQ. Other potential factors worth mentioning are the high level of stock-based compensation and the higher capital intensity compared to HPQ.
Thank you very much for taking the time to read my article.
If you want to learn even more about my research process and what stocks I like, please stay tuned because I am launching a subscription Marketplace service with Seeking Alpha in the near future and the first wave of subscribers will get a lifetime discount.
More details coming soon, so please keep following and reading my work.
Editor’s Note: This article discusses one or more securities that do not trade on a major U.S. exchange. Please be aware of the risks associated with these stocks.
Be the first to comment