

cemagraphics
The Federal Reserve seems to be sticking to its plan of “quantitative tightening.”
Tightening up on monetary policy has usually meant bad news for the stock market. Stock markets usually decline when the central bank tightens up on monetary policy.
But, not this time.
This time we have gotten wide swings in prices, some down, and some up, like this past week.
S&P 500 Stock Index (Federal Reserve)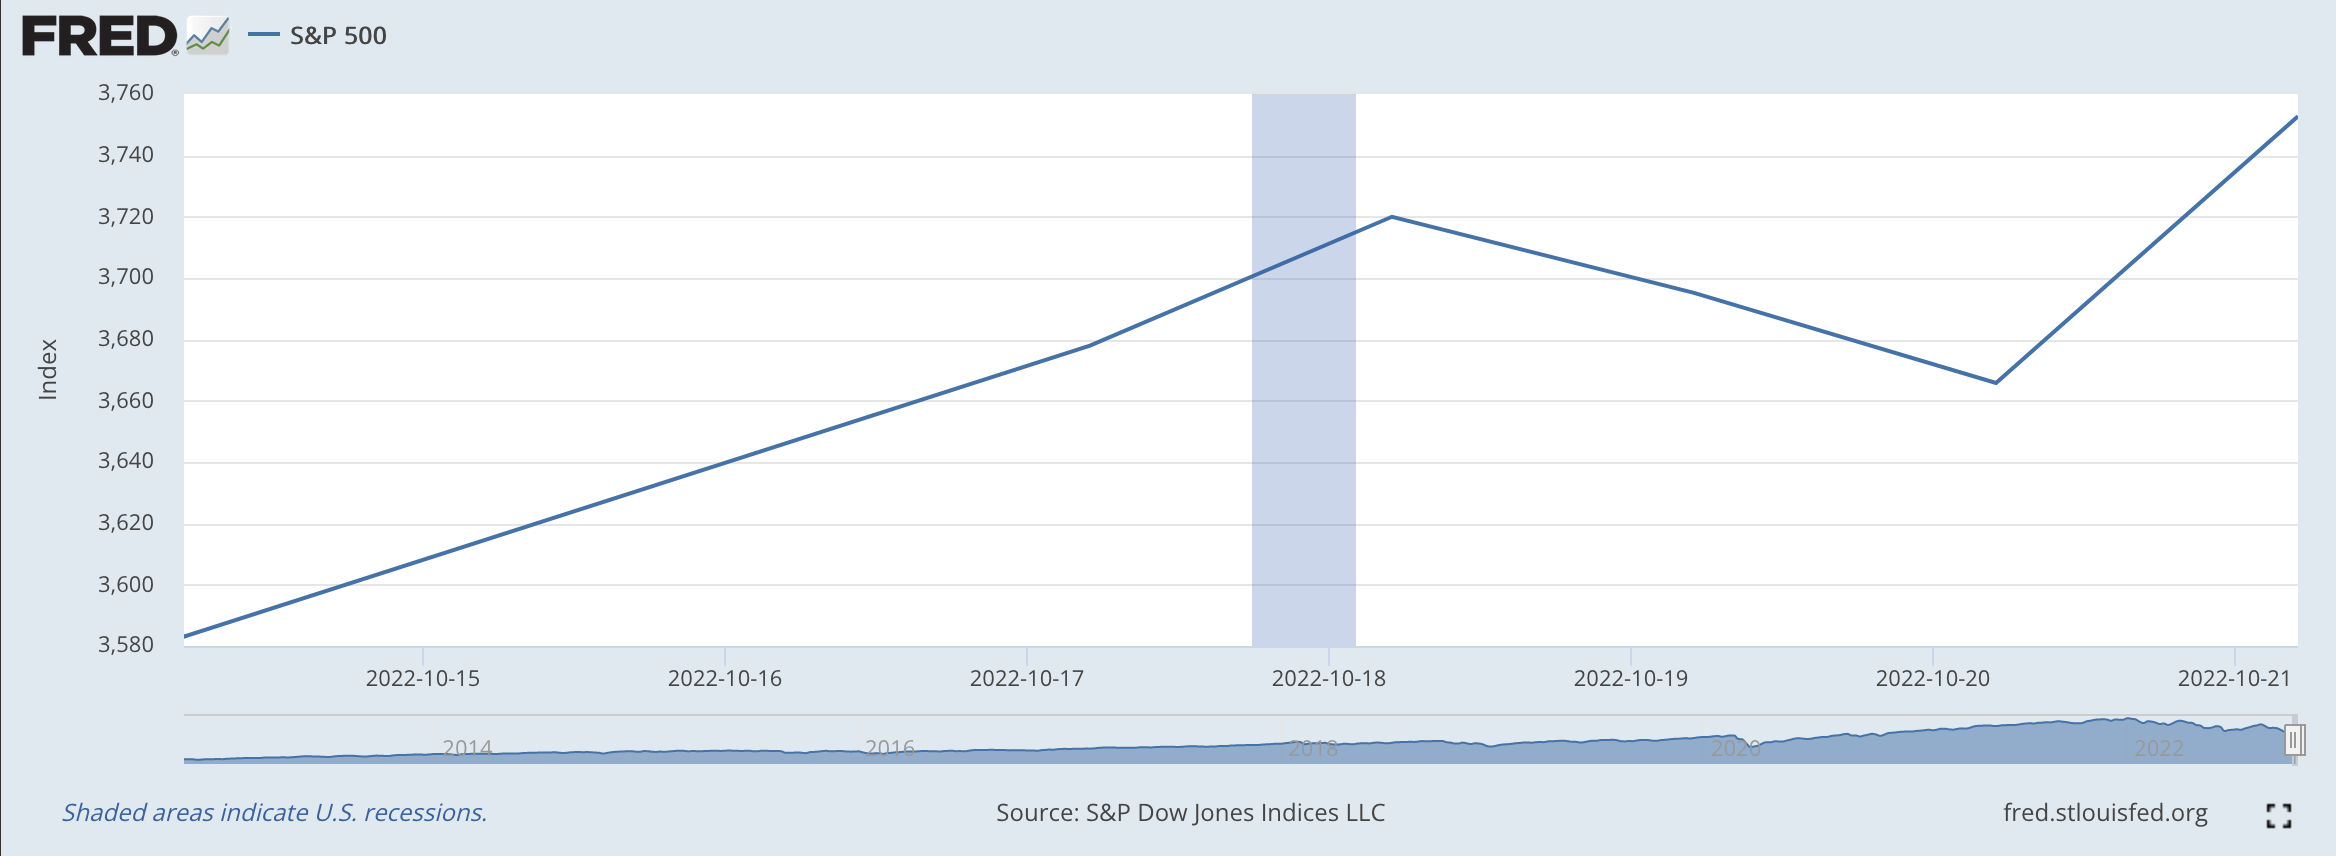
The S&P 500 Stock Index closed up 94 points on Monday, up 43 points on Tuesday, down 26 points on Wednesday, down 29 points on Thursday and up 87 points on Friday.
Quite a week.
Especially with all the talk about the Fed raising its policy rate of interest by 75 basis points at the FOMC meeting on November 1-2.
But, as reported by Gungan Banerji and Chelsey Dulanay in the Wall Street Journal.
“The week has been dotted by several signs that the U.S. economy is stronger than many initially feared. Several corporate leaders – from those at JPMorgan Chase to Delta Air Lines – have expressed confidence that the consumer remains strong. And fresh data on Thursday showed that the jobs market is still healthy.”
“’The reality is that we see weak growth, higher inflation, and earnings surprising to the downside. It’s a pretty difficult combination,’ said Luca Paolini, chief strategist at Pictet Asset Management. ‘This earnings season is going to still be OK. The worry is for the next two, in a way.’”
Then we get this comment:
“’I think we’re in the final innings of peak Fed hawkishness,’ said Christian Hoffmann, a portfolio manager at Thornburg Investment Management overseeing bonds.”
In other words, the Federal Reserve has created the tightest round of monetary constraint in a long time; the economy is showing weak growth; inflation is at a forty-year high, and more and more earnings are coming in under expectations; and yet consumer spending remains strong and things are going OK in the jobs market.
Furthermore, The “Fed hawkishness” may be coming to an end.
So, the S&P 500 can go up 87 points on Friday, the Dow Jones Industrial Average can rise by 750 points, and the NASDAQ can jump by 245 points.
Something seems to be missing here.
Market Liquidity
The thing that I keep coming back to is the market liquidity that has been built in the past.
For example, cash balances in the commercial banking system totaled $3,084.5 billion, or $3.1 trillion, on October 21, 2022.
On September 25, 2019, cash balances amounted to $1,635.6 billion, or $1.6 trillion.
On June 4, 2008, during the Great Recession, cash balances were $307.9 billion, or $0.3 trillion.
The last 15 years has seen the liquidity of the commercial banking system grow by an overwhelming amount.
Cash Assets: All Commercial Banks (Federal Reserve)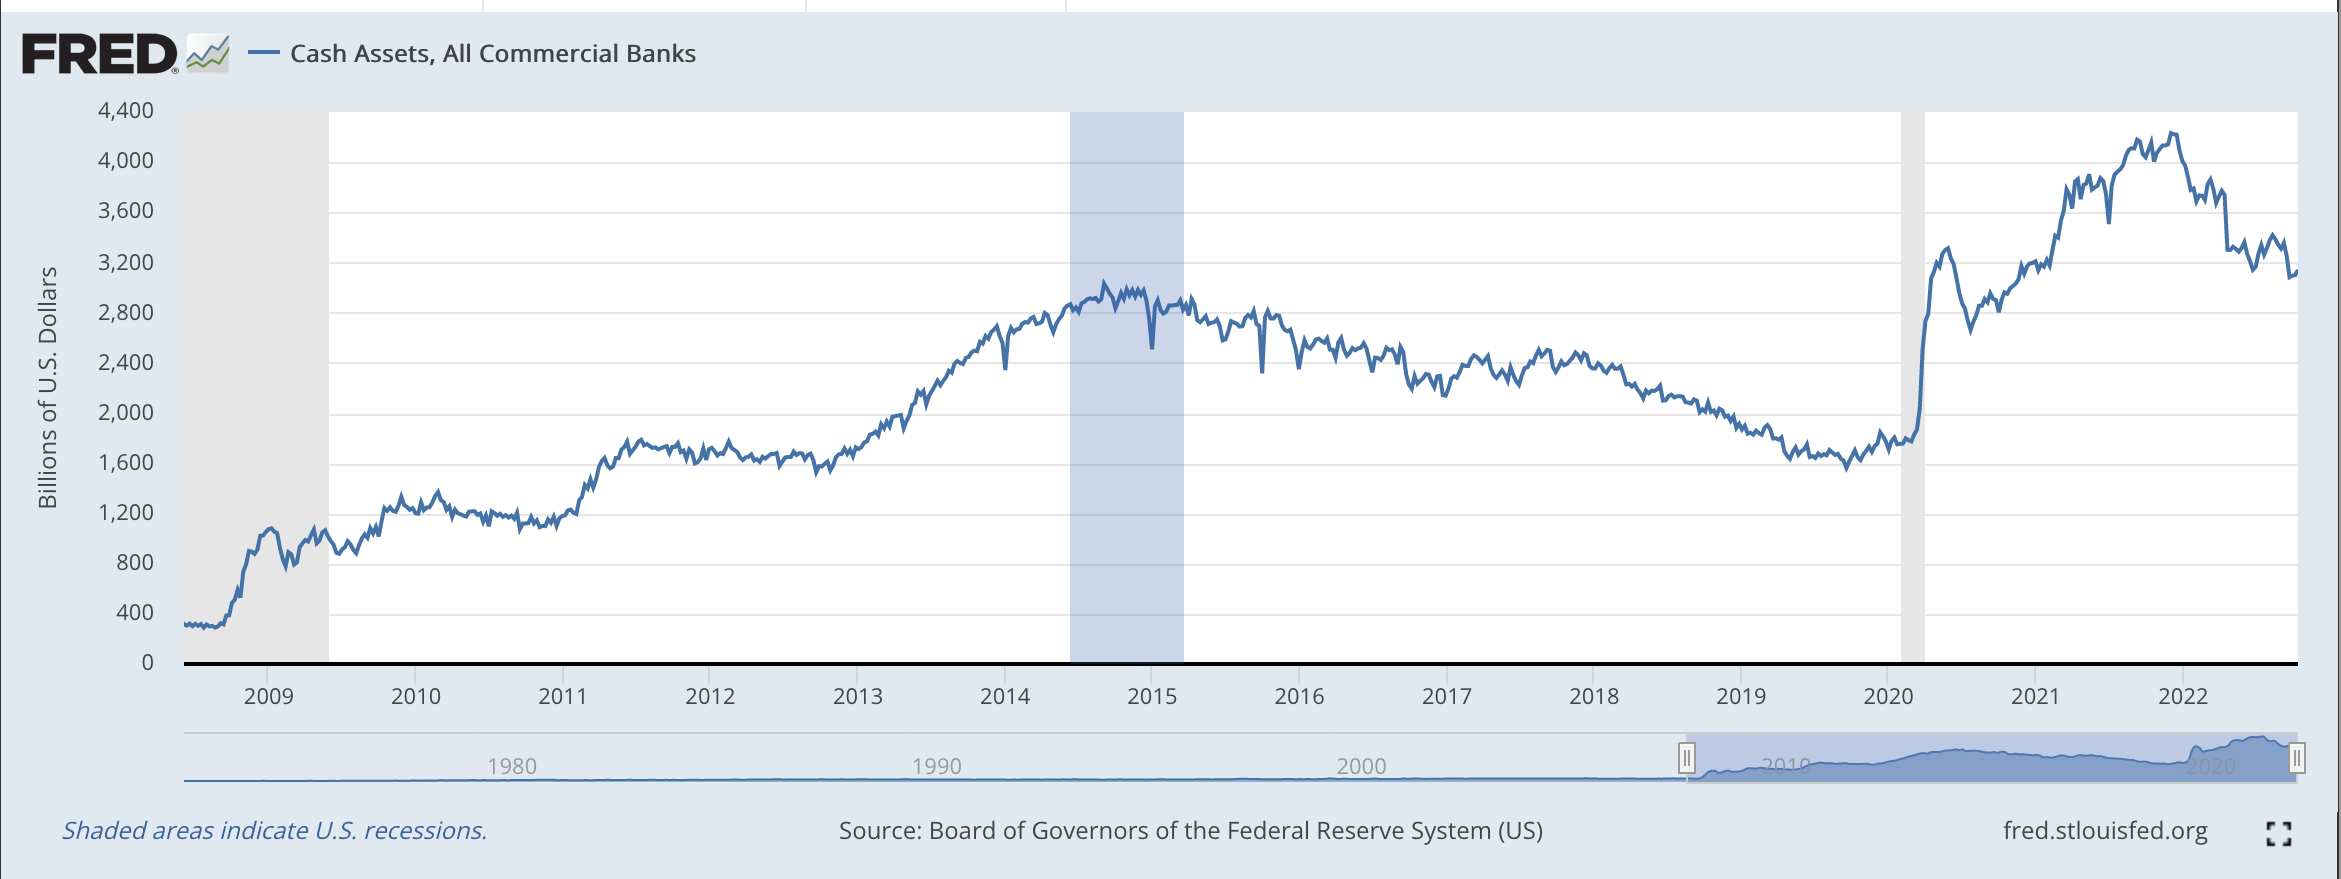
We could go further and present pictures for almost every sector of the financial circuit of the United States. The charts are very similar.
The point is that the Federal Reserve, beginning in the time of the Great Recession has pumped billions, not, trillion of dollars into the U.S. financial system.
This is where we are now.
What happened?
Well, while the Federal Reserve has been pumping billions of dollars into the banking system, these monies flooded into the financial circuit of the economy and not into the real sector, investing in real capital spending.
That is, the investors saw that they could earn a higher, less risky return by putting the stimulus money into assets, like housing, commodities, and stocks, rather than into machines, plant and equipment, and inventories.
As a consequence, the velocity of circulation of the money stock fell.
One can note this in the following chart.
Velocity of M2 Money Stock (Federal Reserve)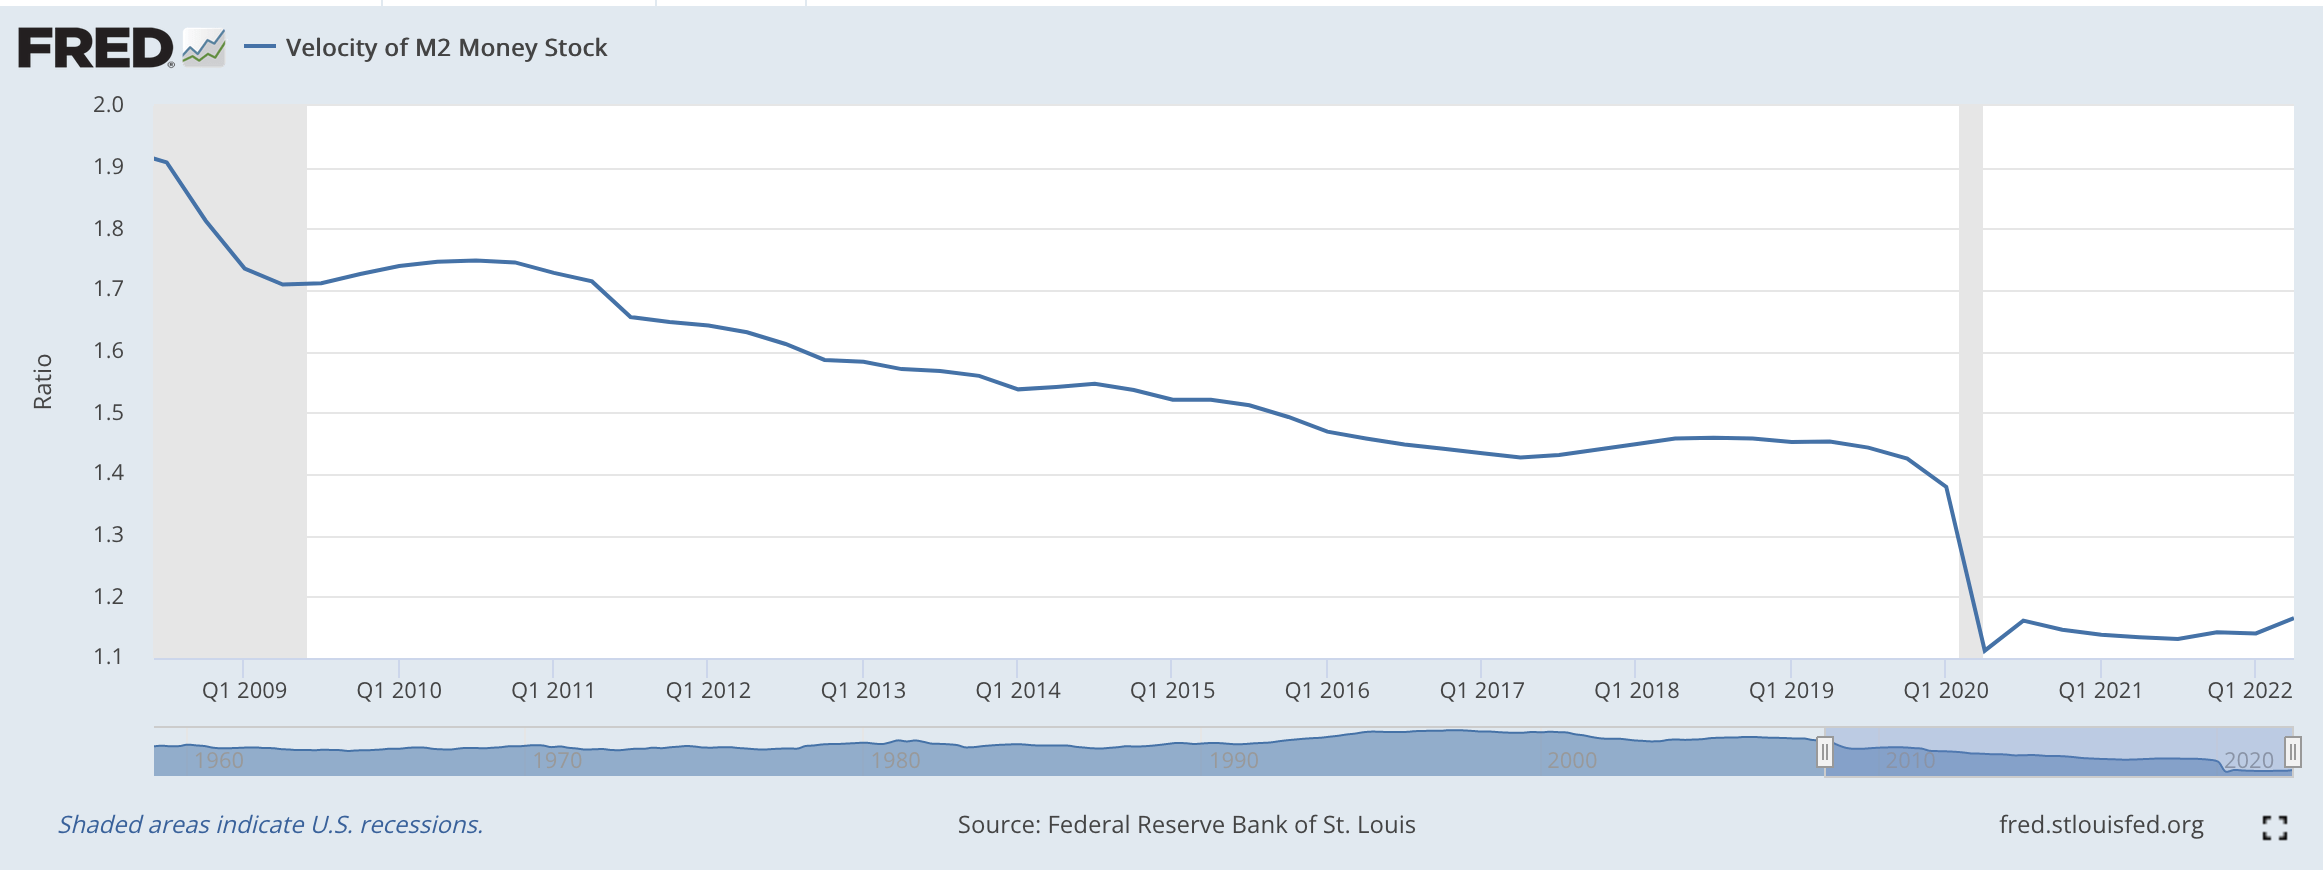
The point is, that the Federal Reserve stimulus money was used by sophisticated investors to build up asset prices, while business investment lagged.
Where we are today?
There is lots and lots of “cash” around that investors can use for their own purposes. And, some of those purposes could be the stock market.
The Federal Reserve is reducing member bank reserves but, it, at this time, has only reduced them by several hundred billion dollars.
The financial system still has several trillion dollars of liquidity to put wherever it wants.
Investors still seem to believe that they can make money by transacting in the stock market at this time.
And, apparently, investors will continue to do this until the Federal Reserve removes a lot more “cash” from the financial system.
But, here again, there are many investors that believe that the Fed will not keep up its “tightness” for very much longer.
As quoted above, some investors believe that we are in “the final innings of peak Fed hawkishness.”
So, if that is true, maybe it is time to buy stocks.
The Future?
I tend to be on the side that Jay Powell and the Federal Reserve will stay around a little longer than these doubtful investors believe that they will.
So, I am a little more pessimistic about the direction that stock prices will move over the next six months or so.
But, that is why we need to pay close attention to the future of the stock market going forward. The future depends upon the ability of Fed Chairman Powell to “stay the course.”
Unfortunately, Mr. Powell, in the past, has acted in a way that people can say that he has always acted to err on the side of monetary ease. Consequently, the feeling is that Mr. Powell may be willing to “back off” from the tight monetary policy before it has fully accomplished its task.
That is why there is a segment of investors that believe that Mr. Powell and the Fed are in the “final innings of peak Fed hawkishness.”
Stay tuned!
Be the first to comment