

koyu/iStock via Getty Images
Investment thesis
The GEO Group (NYSE:GEO) was recently attracting attention from the investment community, as investor Michael Burry disclosed a major holding into the company, as filed on August 15, 2022 as its only holding through its company Scion Asset Management. This article is not focusing on the fundamental reasons that may have pushed the investors to buy a position in GEO, but I want to give an overview of the technical aspects characterizing this stock and its industry. Investors should be aware of the technical potential but also of the risks that an investment in GEO carries. A favorable risk/reward profile of GEO leads me to rank this stock as a buy position, while I will also give an insight into where I would set appropriate stop-loss levels.
A quick look at the big picture
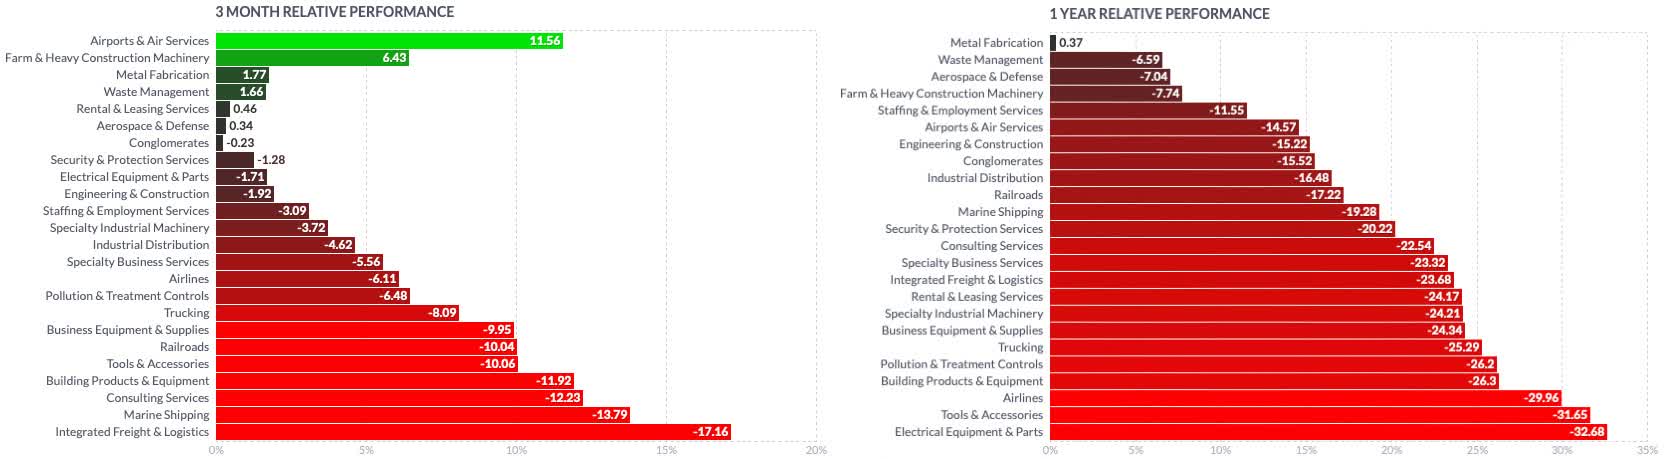
The industrial sector in the US has been performing better than other groups in the economy in the past year and is now seemingly building up some relative strength in the past 3 months. While the sector is led by the airport and air services industry, farm and heavy construction machinery manufacturers, as well as by rental and leasing services, companies in the security and protection services industry have rather been laggards in the past year, slightly recovering in the past few months.
finviz finviz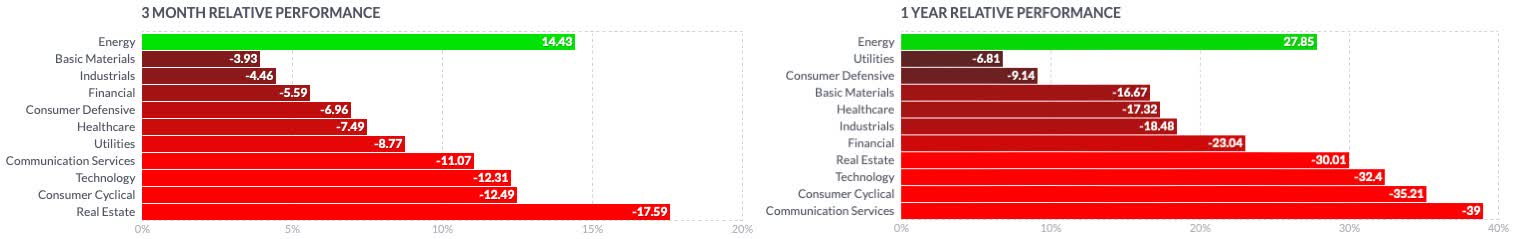
Looking at more specific groups of the industry, the Emles Federal Contractors ETF which I considered as one of the references has been delisted on October 19, 2022, but I also consider the Nasdaq US Benchmark Security Services (NQUSB50205040N) which marked its All-Time-High (ATH) on June 8, 2021, and has since substantially corrected, losing about 49% until bottoming on July 5, 2022, where it immediately reverted and broke out over its EMA200, reporting substantially increasing relative strength, and positive momentum in what seems to be a new uptrend.
Author, using TradingView
Analyzing the historical performance even further, GEO’s stock performed significantly worse than its main references for most of the time from 2018 through 2021, resulting in very poor performance of -67.23% in the past 5 years. Its most significant peers had similar negative performance, with CoreCivic (NYSE:CXW) reporting just slightly less loss over the same period, and The Brink’s Company (NYSE:BCO) reporting a loss of -32.77%. All major reference indexes could instead perform much better, with even the broader market reference tracked by the iShares Russell 2000 ETF (IWM) reporting a 13.55% performance.
Author, using SeekingAlpha.com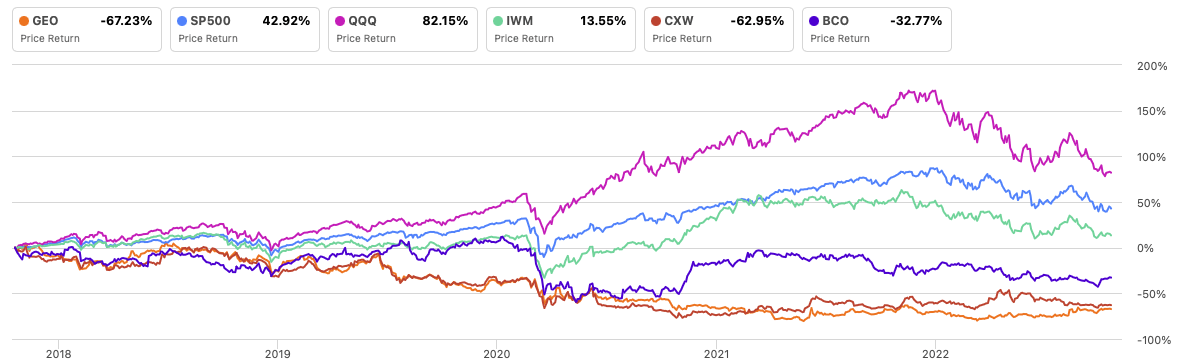
Where are we now?
GEO reached its ATH on April 26, 2017, and after an initial retracement of a significant decline, entered its long-term downtrend during October 2018, until bottoming on May 27, 2021, and has since formed a medium-term trend reversal as we can see on the weekly chart, where the stock successfully overcame its EMA50 and is now attempting to confirm its breakout from strong resistance at its EMA100.
Author, using TradingView
The stock shows a positive momentum since April 2022 and is building up significant relative strength, on increasing average weekly volume. The long streak of losses in the past years has certainly discouraged many investors, as the stock has been in stage four for the past 5 years. With the bottoming process lasting over 42 weeks, the stock could potentially try to break into stage two, if the actual strength is confirmed and the overhead resistance is overcome.
What is coming next?
I expect the stock to continue performing positively in the short term, as it is on track in the lower part of the trend to reach its next overhead resistance at $9.81. On its daily chart, if the stock achieves a breakout over this level, its next major obstacle is likely set at $11, with an upside potential between 15-30% from its last closing price.
Author, using TradingView
On the other hand, the stock likely has several important support levels that have to be considered, other than its moving averages and most importantly its EMA50, which can be set as its trailing stop for more short-term traders. To achieve consistent growth, a stock needs substantial institutional sponsorship, which is usually happening over its most important moving averages. Investors should closely observe the price action between $8 and $7, as well as how the stock reacts if it tests its EMA200 on its daily chart, by considering setting a stop loss in the last resort, slightly under that trailing moving average.
The stock is building positive momentum but an eventual continuation of the uptrend could likely be affected by several pullbacks and re-testings of recent resistance levels. Investors may trade this stock in the defined range, which can offer some handsome returns in the short term, or allow it to hover with more tolerance toward higher volatility. Investors should closely observe the price action and how the stock behaves at the mentioned crucial support levels, and how an eventual attempt to overcome its resistance is confirmed or rejected, by particularly observing the trading volume in both directions.
More risk-averse investors could consider a risk/reward ratio of 2 by setting their stop-loss slightly under the EMA50 with the target seen at $9.80. Investors with higher risk tolerance could instead give more space for the stock’s volatility and fix their stop-loss under the EMA200, with the ultimate support level seen at $6.97. As a breakdown toward those levels could bear the risk of seeing even further losses, I would certainly not hold the stock any longer.
The bottom line
Technical analysis is not an absolute instrument, but a way to increase investors’ success probabilities and a tool allowing them to be oriented in whatever security. One would not drive towards an unknown destination without consulting a map or using a GPS. I believe the same should be true when making investment decisions. I consider techniques based on the Elliott Wave Theory, as well as likely outcomes based on Fibonacci’s principles, by confirming the likelihood of an outcome contingent on time-based probabilities. The purpose of my technical analysis is to confirm or reject an entry point in the stock, by observing its sector and industry, and most of all its price action. I then analyze the situation of that stock and calculate likely outcomes based on the mentioned theories.
The GEO Group has many elements that indicate the stock has technically reversed and after a long and severe losing streak, could now be forming its next uptrend. While the stock has been a massive laggard in the past five years, the company counts many prominent institutional investors among its shareholders, together holding over 75% of the share capital. Fidelity massively increased its position since Q2 2021 until owning 13% of the outstanding shares, BlackRock (NYSE:BLK) holds about 14%, and investors Michael Burry through its company Scion Asset Management reported holding 501,360 shares valued at over $3.3M as its only holding at the end of Q2. Despite the recent positive developments, GEO still has a relatively high short interest of 17.20%, although this metric has dropped more than 50% since May 2021. The stock offers a favorable technical picture for momentum and position traders with significant upside potential, while its downside risk is limited by multiple support levels. I, therefore, rate this stock as a buy under the given perspective.
Be the first to comment