

Douglas Rissing
Last Friday, the September job openings were released. They were better than anticipated. The unemployment rate dropped from 3.7% to 3.5%.
Bloomberg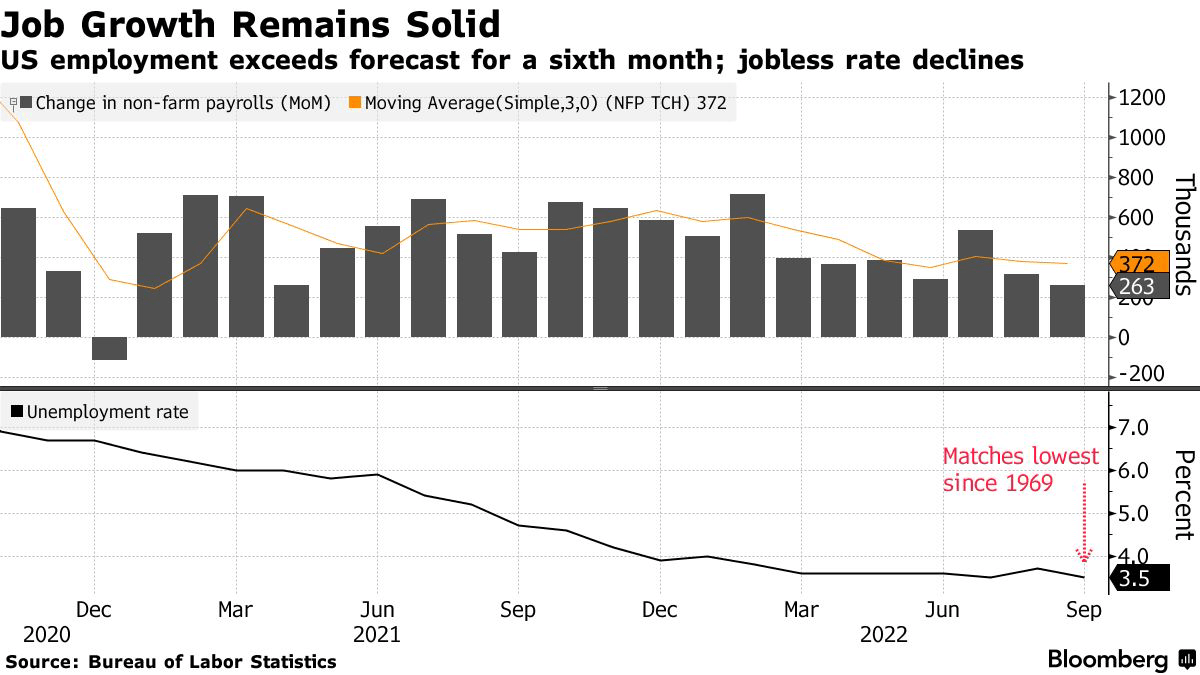
Stocks reacted really bad, and the indexes fell substantially. The Nasdaq (QQQ) fell the most, but the S&P 500 (NYSEARCA:SPY) and Dow Jones (DIA) were down substantially too.
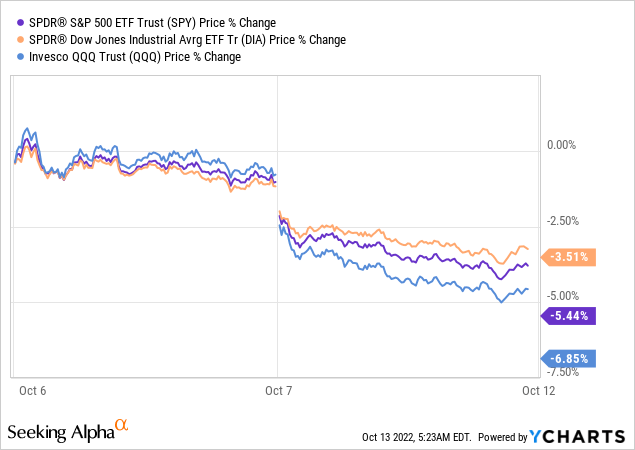
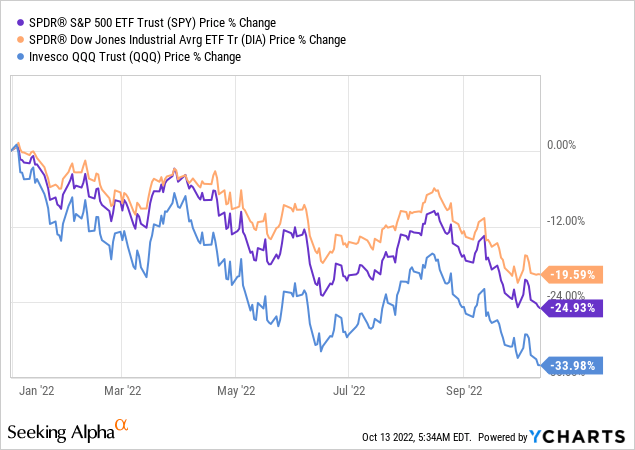
This added to the substantial losses for this year, with the Nasdaq down almost 34%, the S&P 500 almost 25% and the Dow almost 20%.
Of course, these big market drops feel bad, but if you invest for decades, even very big drops can look like small hiccups in the rearview mirror. Just look at this graph, for example.
Twitter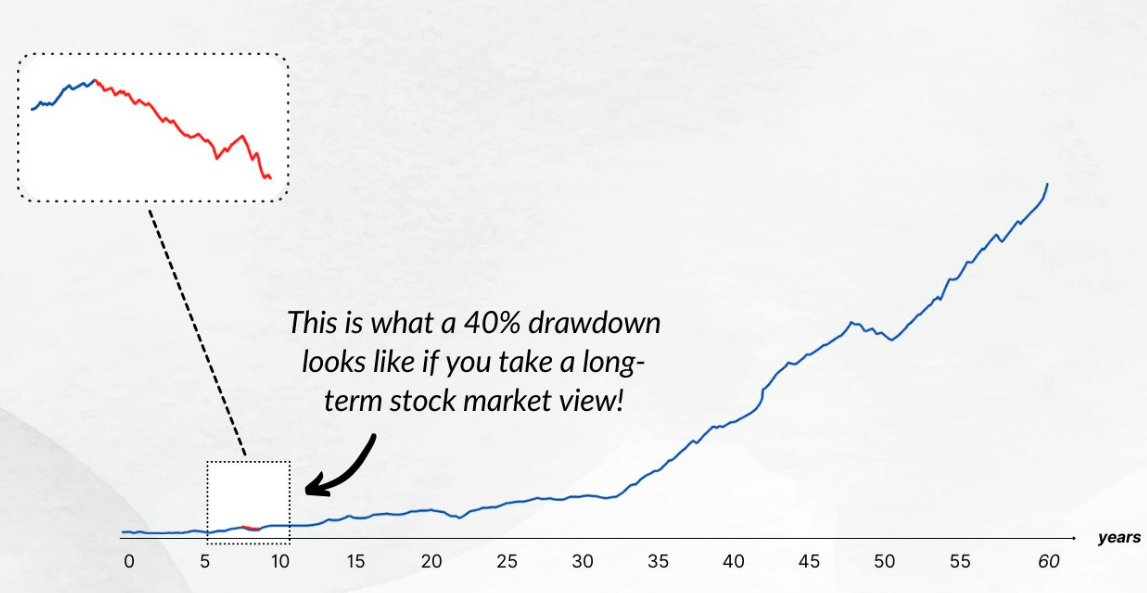
I know not everybody has 60 years to go. I’m 46, so I probably don’t either (although aiming for it). But this chart shows that we shouldn’t despair and better times will come again. Some will already jump to the comment section now to point out the very rare outliers, like the Japanese stock market, but for me, pointing to the market top to say something is ugly is the same as pointing to the market top to say something is rosy: it’s cherry-picking to prove a point.
My approach is one of dollar-cost averaging. I invest money every two weeks and I intend to hold for the long term, so lower stock prices are not bad for me, unless they are a sign of fundamental weakness, which happens, but is not always the case in a broad market decline.
The Jobs Report
It’s often not what economists are taught at school, but right now, good news is bad news, and the other way around for the short-term market movements. The fact that the job report numbers were better than expected means that investors know the Fed still has plenty of wiggle room to raise interest rates to tame inflation.
Investors don’t like higher interest rates, as they present an alternative to stock market investments. There’s only so much money to invest. With higher interest rates and the drop in stocks, investors fear more people will invest in bonds and cash. Right now, these are not real alternatives yet for most, but if rates keep going up, that can change over time. The market is not following data but anticipating.
Some now act as if everything depends on interest rates. If you zoom out over the last 20 years, this is what you see, though.
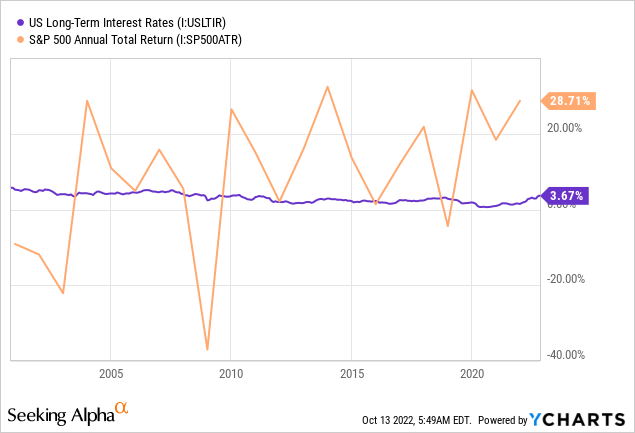
In other words, if you look at a broad context, of decades, there is no clear correlation between interest rates and returns. On top of that, the interest rates are still low, historically speaking.
There could be a correlation over the short term, but that’s not what I focus on. Even for long-term investors, these big drops can feel bad. When everyone is focusing on the short term, it’s hard to focus on the long term. 99% of the “news” about investing is about the short term or very short term, from a day to a year. If you invest for the next decades, most of this is noise.
To go back to the job numbers, over the short term, a strong economy might be bad for the returns of the stock market, but in the long term, a strong economy is exactly what we want to have.
The September CPI Numbers
Today, the September inflation numbers were released, and just like in August they were worse than expected. CPI stands for consumer price index, just to be clear.
Month over month, they went up 0.4%, versus the 0.2% expected. Year over year, they are up 8.2% versus the expectations of 8.1%. The core index, excluding food and energy costs and the preferred metric of the Fed, was up 0.6% month over month, while the consensus stood at 0.5%. Year over year, this means 6.6% versus 6.5%.
The main contributors were higher food costs, 11.2% YoY and 0.8% MoM. Energy prices were down in September, but they rose again so far in October, so that is not really comforting as well. Transportation services also saw a big increase, up a whopping 1.9% month over month and even 14.6% year over year annually.
I’m writing this before the market opens, but you can guess what this means for stock prices: another big drop.
Just to make it clear, for inflation, we all want this number to be lower, whether you focus on the short-term or invest for the long term. High inflation can be felt by everyone in their personal lives and it’s bad for the economy.
For ordinary people, inflation is bad. While you hear about rising employee costs, they lag inflation. Hourly earnings declined 0.1% month over month and 3% year over year on an inflation-adjusted basis.
What would be the ideal scenario? That inflation would drop and jobs stay strong. Usually, jobs are a lagging factor, though. It’s often only when companies see a big slowdown or negative growth in sales that they let people go. There are signs that demand is drying up.
Shipping orders are down quite a bit
Last week, for example, it was announced that shipping orders saw a steep decline of about 20%. Trucking saw the same evolution recently. This is another example.
CNBC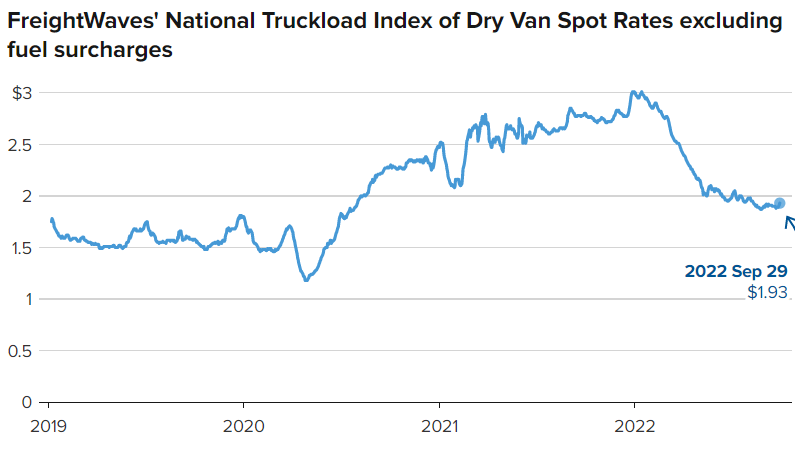
Inventories are high and consumer demand is uncertain or low. That could be an early indicator of inflation coming down, although it doesn’t say anything in particular about the upcoming October numbers, of course. But if there’s too much inventory, goods are sold at a discount or go to other channels eventually. Think of Ross Stores (ROST), TJ Maxx (TJX) and others.
It’s still early, of course, and a lot could happen along the way. We can not predict the future, only look at the leading indicators that we see now. Up to now, the lagging data all show worse inflation. It’s a beast that is difficult to tame.
But some hope may be on the horizon if you look at the leading indicators of shipping and trucking costs and demand. Usually, a recession is a matter of a few quarters. They can be extremely painful for a lot of people. And as New York Fed Chairman John Williams said, a longer period of higher rates might be necessary to tame the most stubborn inflation for the long term. Both optimists and pessimists can only look at leading indicators and make educated guesses.
Conclusion
The job numbers came out stronger than expected and the CPI numbers are worse than expected. That means that the picture still looks pretty grim for the next few months. Some leading indicators might suggest that inflation could go down, but we still have to wait and see what the future brings. For short-term investors, I would not dip my toes in yet, for longer-term investors, accumulating now will probably show good results over the long term, but it might be painful for several more months or even quarters.
In the meantime, keep growing!
Be the first to comment