

primeimages
Upside Risk For Stocks?
As I wrote about as recently as late September, a number of technical, sentiment and positioning indicators continue to suggest the stock market is due for a countertrend rally. Since I penned this article arguing for a cessation of selling pressure, the market has by and large seen sideways price action, though in a volatile manner. Importantly, many of the factors suggesting the sell-off were overdone for the time being not only remain but are perhaps now more pronounced. Though this does not mean any sort of bear market rally is a high probability, as I will discuss herein, investors ought to be aware the potential for short-squeeze rally remains ever-present.
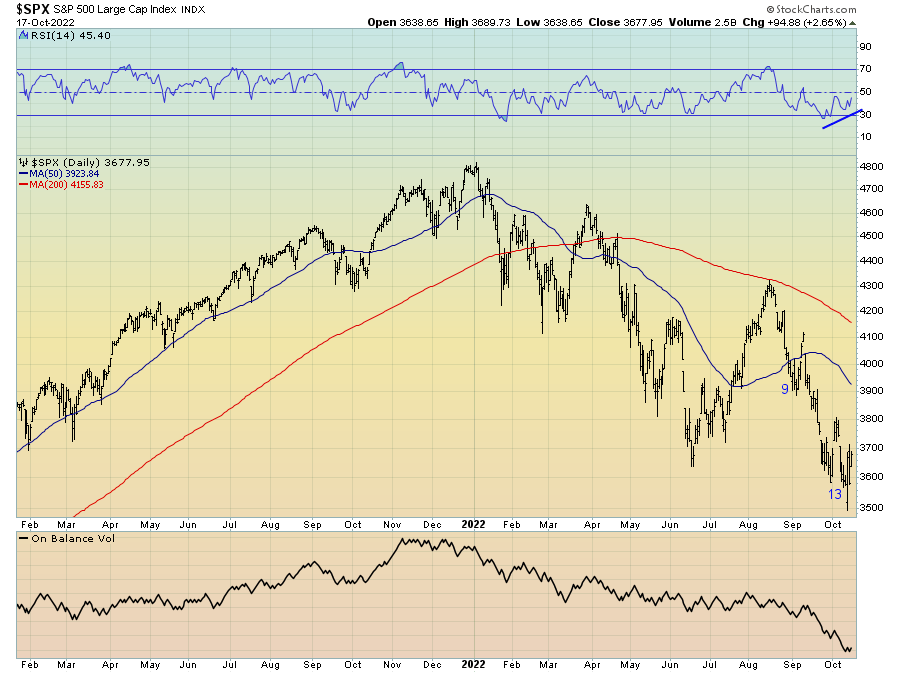
Firstly, what can be observed across many different asset classes are a number of trend exhaustion signals that portend favourably to risk assets over the short term. We can see the recent lows in the S&P 500 have triggered a 9-13 DeMark buy signal along with a positive divergence in momentum (per the RSI), suggesting the downside selling pressure may be due for respite.
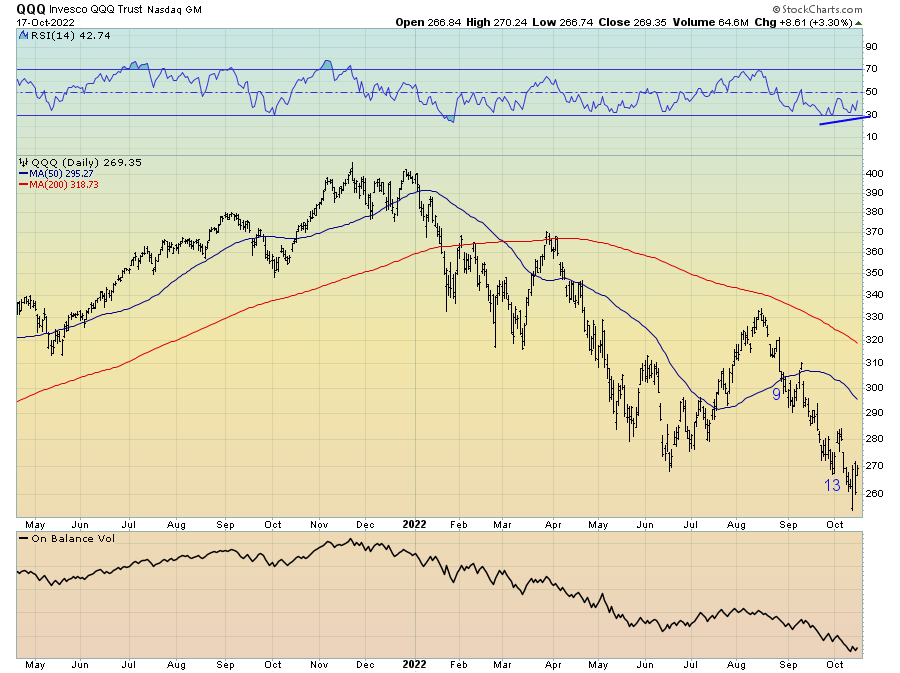
The same trend exhaustion signals are also evident in the Nasdaq.
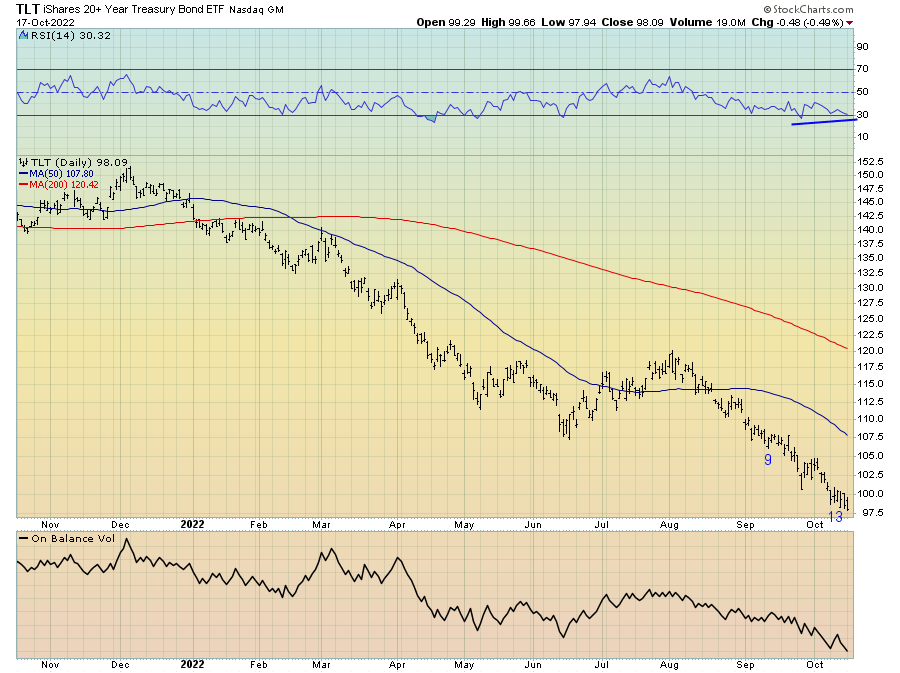
And so too in long-term bonds. If the latter of these signals plays out, the resultant pullback in yields would likely be supportive of risk-on in the short term.
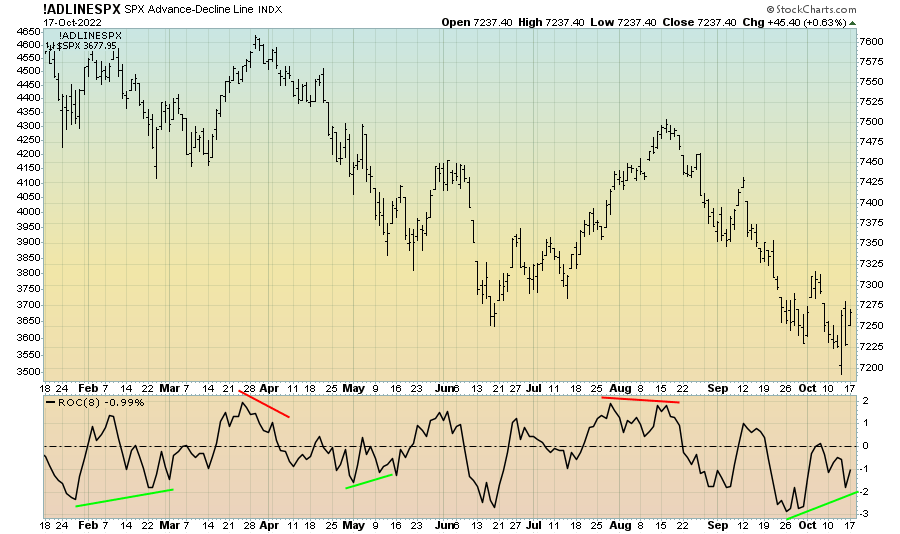
In terms of stock market breadth, the rate-of-change in the S&P 500’s advance-decline line is a solid indicator of short-term price movement when it diverges negatively or positively from price. The recent lows were accompanied by the latter, a positive divergence similar to what occurred in March and May of this year, and both of which preceded a relief rally in stocks.
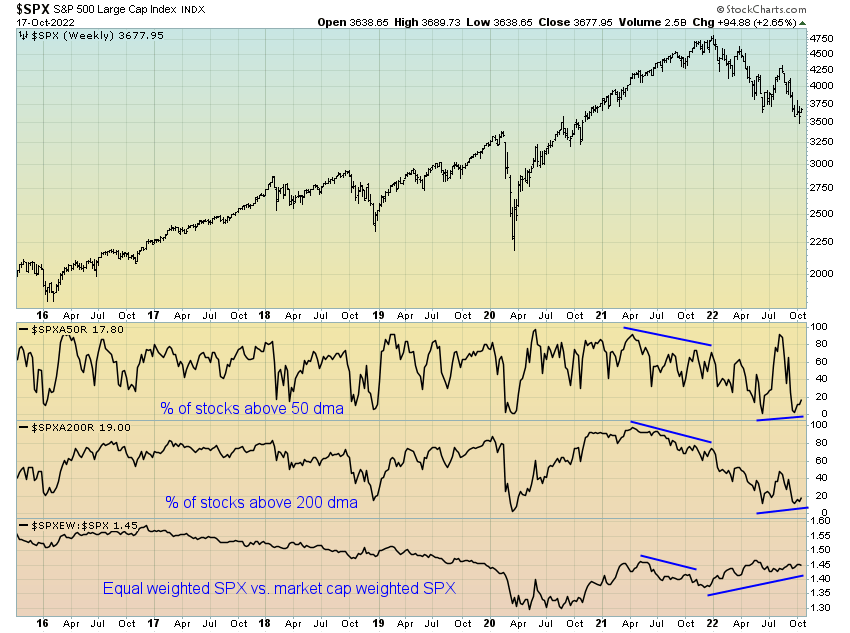
Continuing to confirm this signal are several other market breadth measures I monitor, as has been the case for a few weeks now. Oversold breadth readings in the percentage of stocks trading above their 50-day and 200-day moving averages in the past are usually accompanied by rallies in stocks in the weeks following.
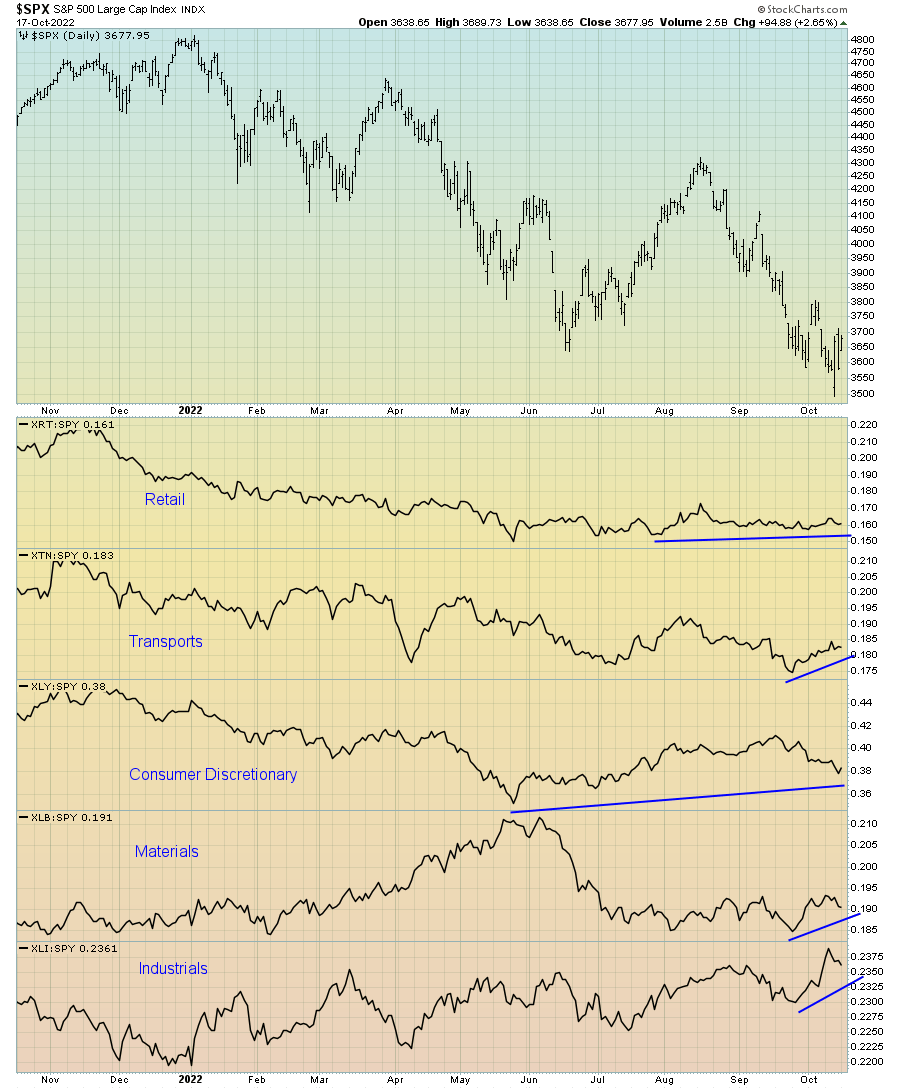
Breadth is not the only measure of market internals suggesting the selling may be done for now. Indeed, some of the most cyclically sensitive sectors of the stock market in retail, transports, consumer discretionary, materials and industrials have all outperformed the S&P 500 in recent weeks. During times when the overall index goes on to make new lows whilst such cyclically sensitive sectors of the market do not, the market may be trying to tell us something. Generally, when the pro-cyclical parts of the market do not confirm the lower lows, it becomes difficult to see the market itself move significantly lower.
The same can be said of investor risk appetites, here proxied by junk bonds relative to treasuries, high-beta stocks relative to low beta-stocks and cyclical stocks relative to defensive stocks. These three measures of risk appetites have diverged positively from the broad market, showing relative strength.
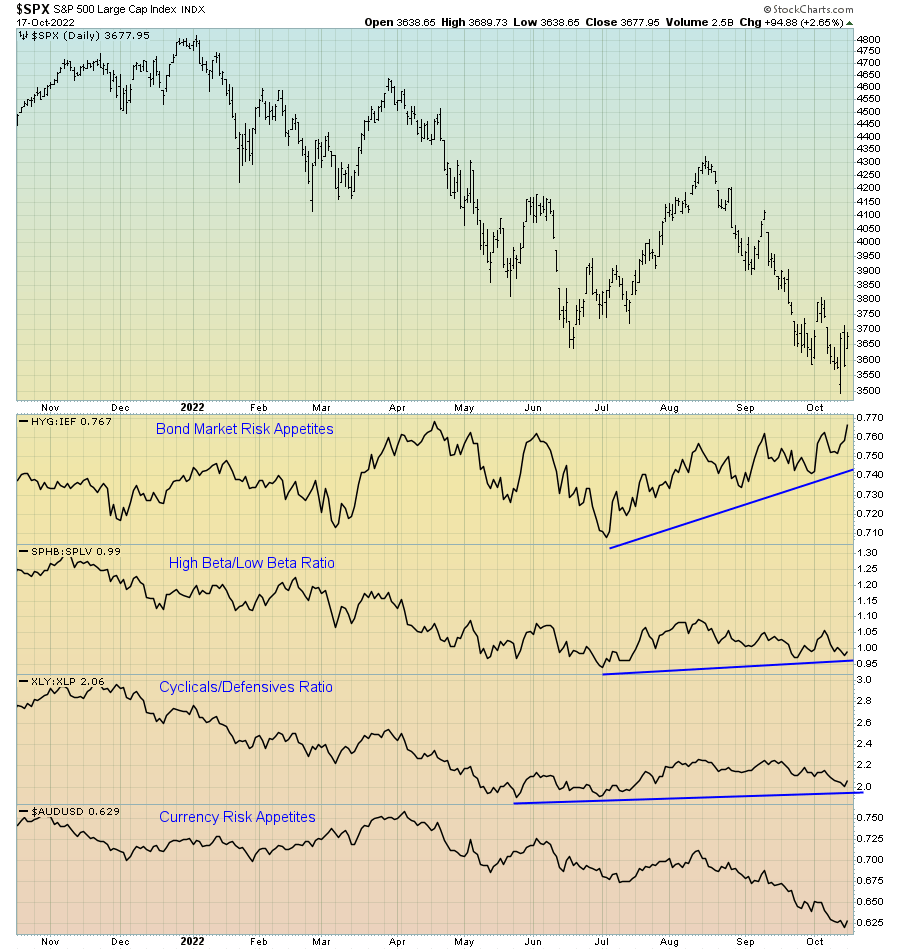
This is particularly pronounced in the bond market, which is seemingly trying to tell us a relief rally is on the cards.
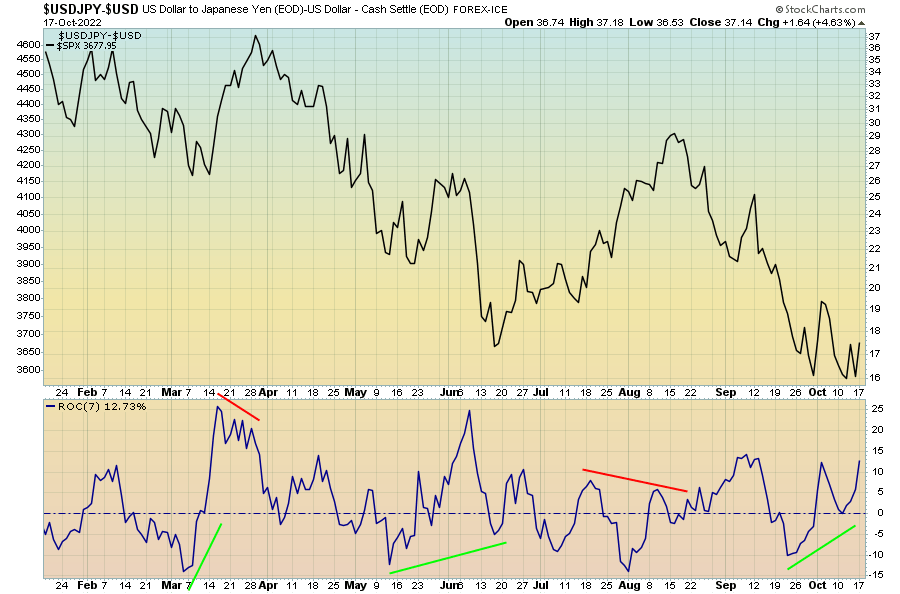
Source: @murphycharts So too are the currency markets via the FX Weathervane (per the unique work of Chris Carolan). This indicator effectively highlights how strength and weakness in the yen filters through to global asset markets as a result of the Japanese being one of the world’s largest exporters of capital.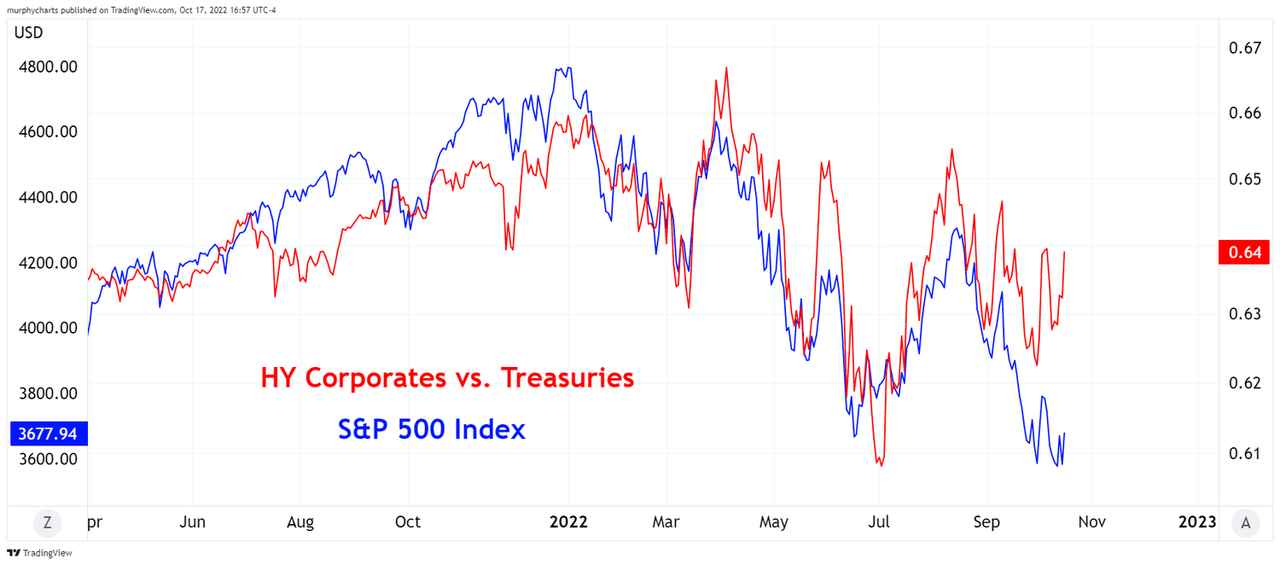
Clearly, as has been the case for a couple of weeks now, there are a number of signs suggesting a relief in selling is due. Before stocks can continue lower as the growth and liquidity cycle suggests they will over the medium term, we likely need to see a washout in negative sentiment and positioning before this can occur.
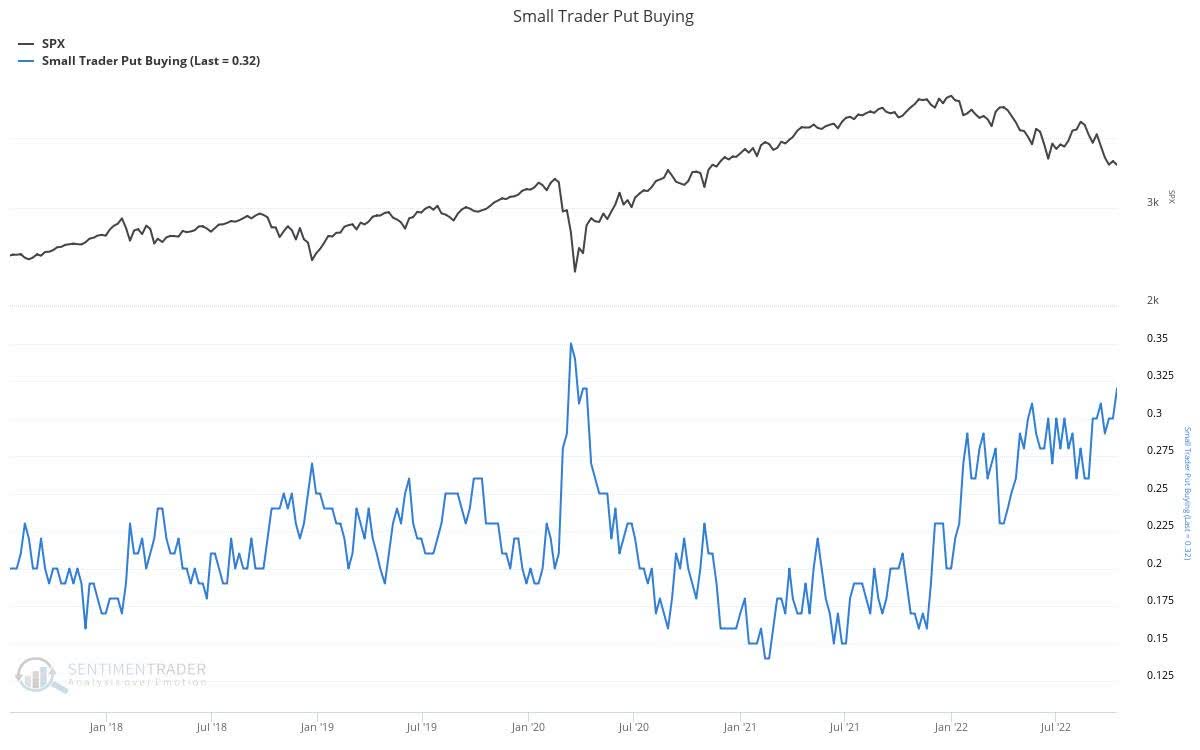
We can see such bearish positioning here by analysing retail put buying activity, showing how retail ‘speculation’ to the downside is now at its most pronounced levels since the COVID-19-induced crash.
Bearish positioning and sentiment have been a theme of 2022 and are yet to resolve themselves. Over the past year, we have seen a complete unwind of long positioning from most discretionary and systematic fund managers, as noted by Tier1 Alpha: “To change positioning in this manner, taking down net positioning from 90% to 63% in hedge funds or from 60%ile to 13%ile in vol targeting requires concerted selling which in turn helps explain the markets dismal 2022. We have not (yet?) seen the signs of retail selling or capitulation in broader equity market funds (e.g., passive). This does not mean it will not arrive, but the question is whether the bearish asset allocators may be forced to blink before then.”
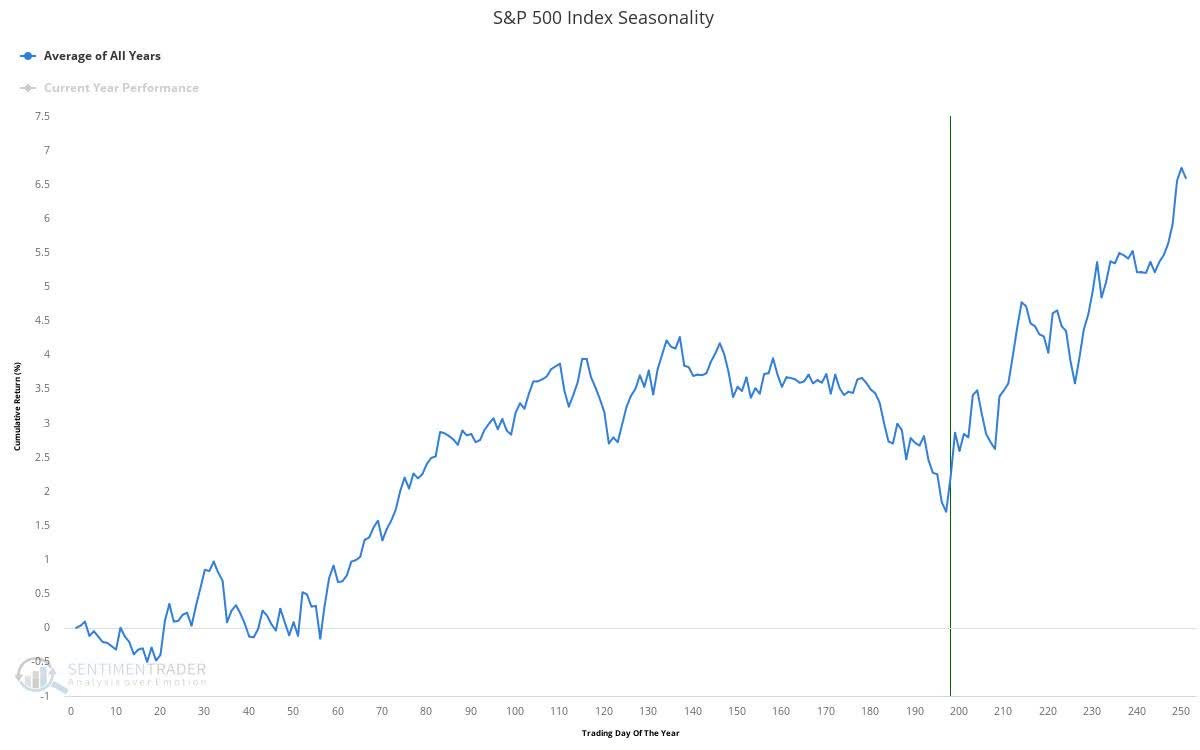
Tier1 Alpha Again, although there is little fundamental basis for a rally, markets accompanied by such extreme levels of bearish positioning and sentiment generally have an increased risk to a countertrend rally. This dynamic has certainly encompassed much of the price action seen this year, and, as we saw during the months of July and August, seasonality is again bullish and now points to upside potential as we close out the year.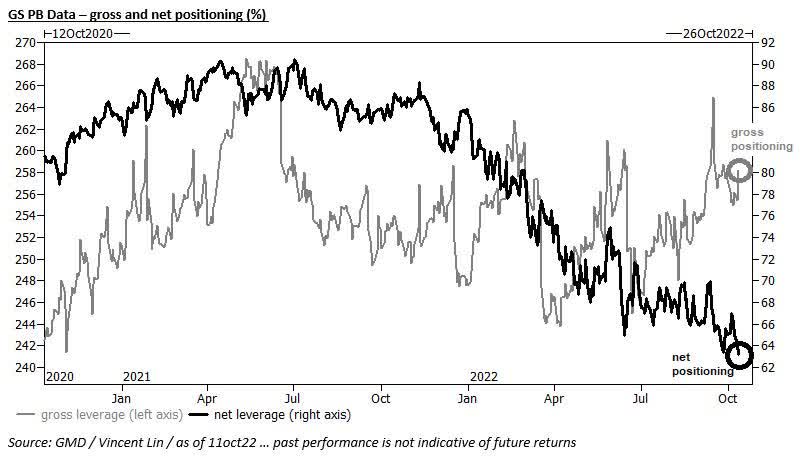
A trend particularly pronounced when we take into account the four-year election cycle.
Ed Clissold, NDR Research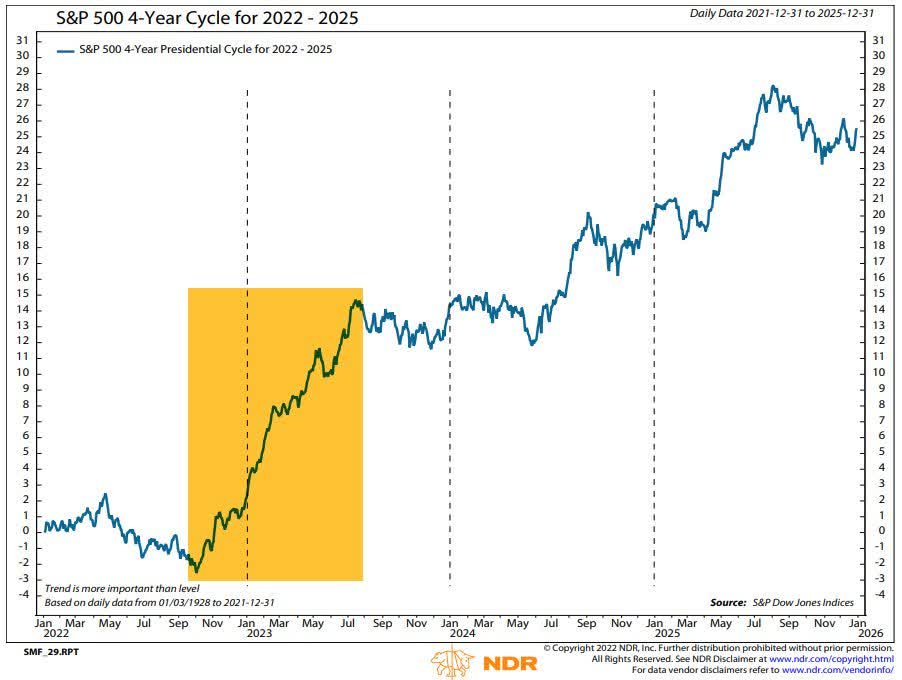
Given the above, the pain trade may well be stocks-up over the next few weeks. However, any move higher in stocks (which is far from assured) will not likely be supported by fundamental so long as the outlook for growth and liquidity remain as bearish as they do over the medium term. At times like this, we must be able to distinguish between the trade and the trend.
Be the first to comment