

Khanchit Khirisutchalual
Summary Data and Analysis
In Figures 1 and 2 below we provide key summary data and analysis for this month’s All Items CPI and Core CPI, respectively.
All Items CPI (‘BLS’) Core CPI (‘BLS’)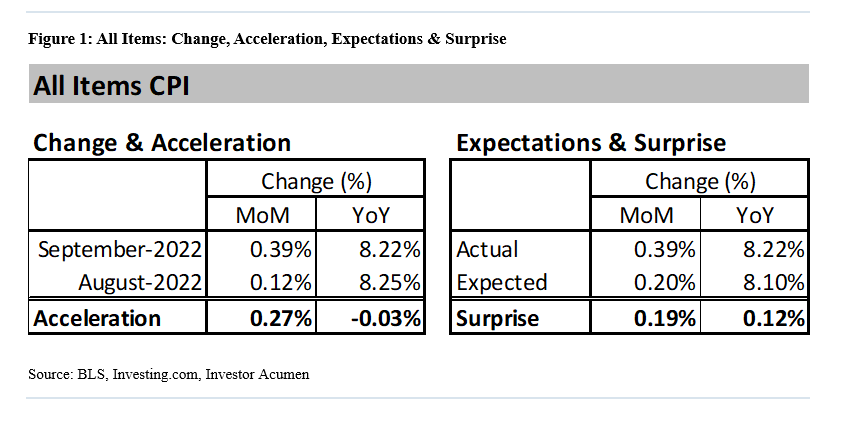
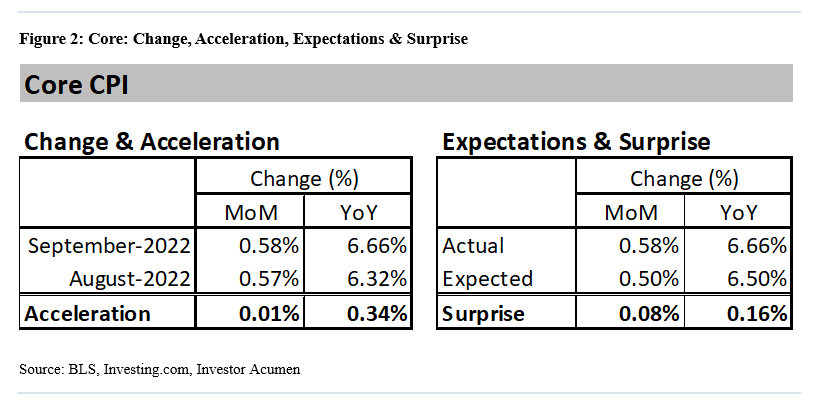
As can be seen above, both All Items and Core CPI inflation rates surprised to the upside this month. Of particular note, is that Core CPI accelerated 0.34% on a YoY basis. This will be of particular concern to the Fed.
Analysis of Contributions of Key Aggregate Components of CPI
In Figure 3, we display the contributions to CPI inflation of five major aggregate components to the MoM (month-over-month) change in CPI and the MoM acceleration of CPI.
Select CPI Aggregates (‘BLS’)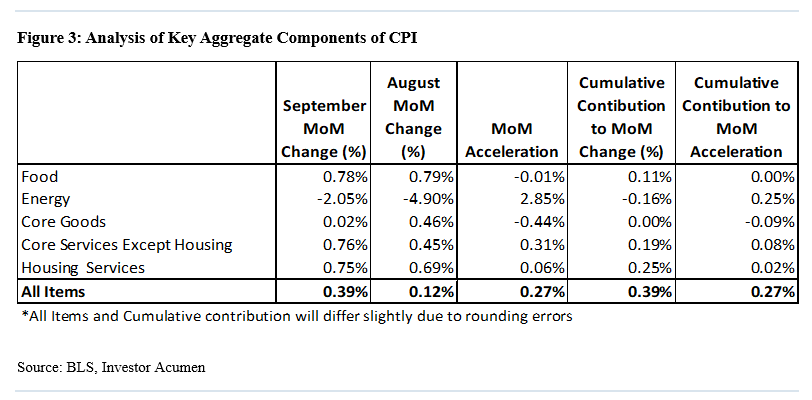
We will briefly review how to interpret the table above (as well as other tables in this report), describing each column from left to right. The first column contains the MoM percent change for the current month. The second column contains the MoM percent change in the prior month. The third column contains the MoM acceleration – i.e. the difference between the percent change this month minus the percent change last month. The fourth column contains the Cumulative Contribution to the percent MoM change of CPI. This describes exactly how much each component contributed to the cumulative All Items MoM percent change in CPI. The sum of the values in this column will yield the MoM percent change of All Items CPI (with minor discrepancy due to rounding). Finally, the rightmost column contains the Cumulative Contribution to MoM Acceleration of All Items CPI. The sum of the contributions in this column adds up to the MoM Acceleration of All Items CPI. Although all five columns provide important information, we recommend that readers pay special attention to the rightmost column (Cumulative Contribution to Acceleration) as it reveals exactly what drove the MoM acceleration/deceleration in CPI during the current month compared to the prior month.
As can be seen in the table above, Housing Services and Core Services ex Housing accounted for most of the overall increase in CPI.
Analysis of CPI Components that Contributed Most to Change & Acceleration of CPI
In the following section, we perform the same contribution analysis as above, but at a more granular level of detail. In Figure 4 below, we list the top 10 CPI components (most granular level) that contributed negatively and positively to the MoM percent change in All Items CPI. These contributions take into account both the magnitude of the MoM change in each component as well as the weight of each component in All Items CPI.
Contributions to MoM Change CPI (‘BLS’)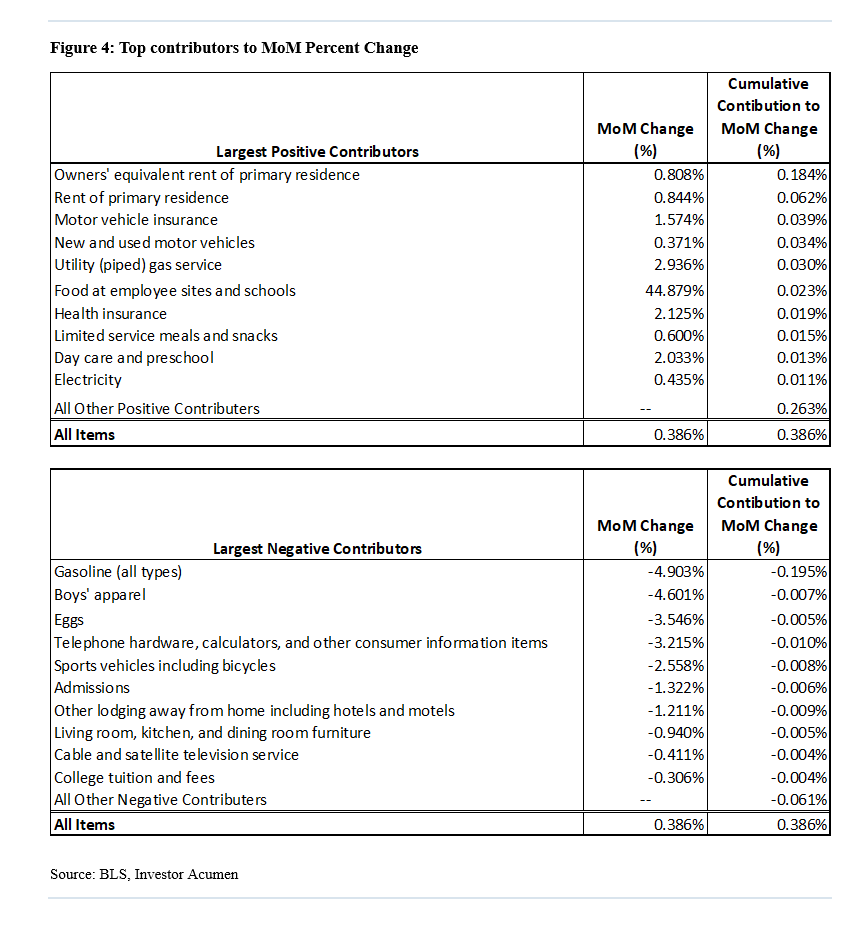
In Figure 5 below, we list the top 10 CPI components, at the most granular level, that contributed negatively and positively to the MoM acceleration (expressed in percent change) of All Items CPI. These contributions take into account both the magnitude of the MoM accelerations in the components as well as the weight of each component All Items CPI.
Contributions to MoM Acceleration of CPI (‘BLS’)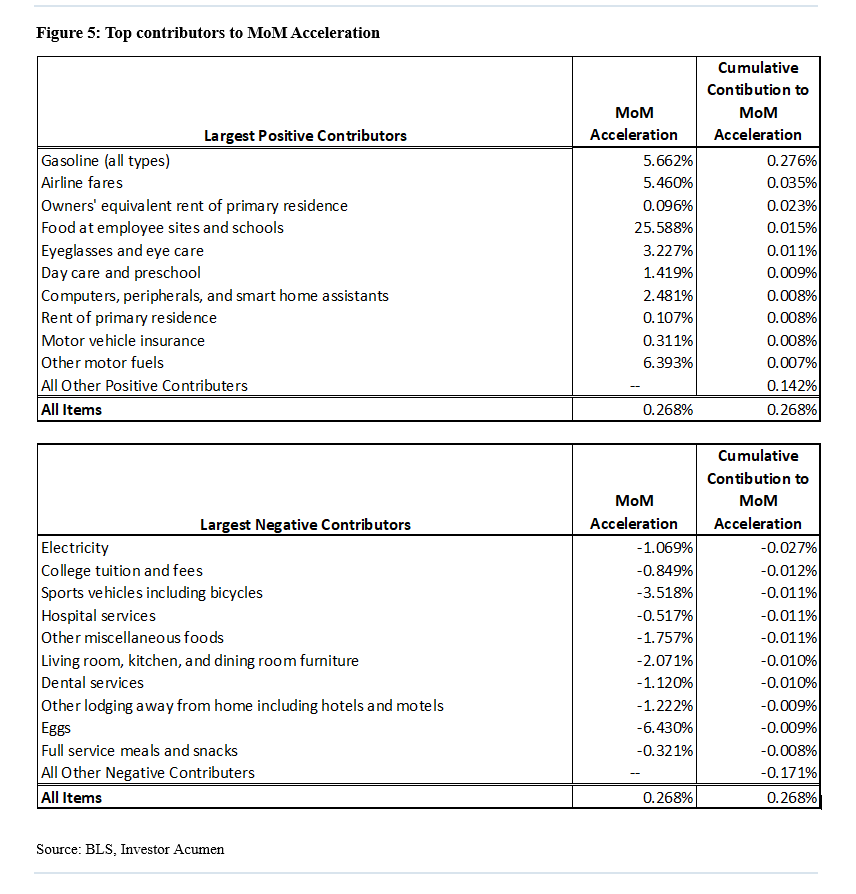
These two tables above are likely to include most or all of the items which surprised forecasters during the month. If you’re looking for the CPI components whose behavior during the month was most likely to have deviated from the consensus forecast, or from the forecast of any particular analyst, you are likely to find them here.
Top Movers
In Figure 6 below, we show the components with the largest positive and negative MoM Change (%).
Top CPI Movers (‘BLS’)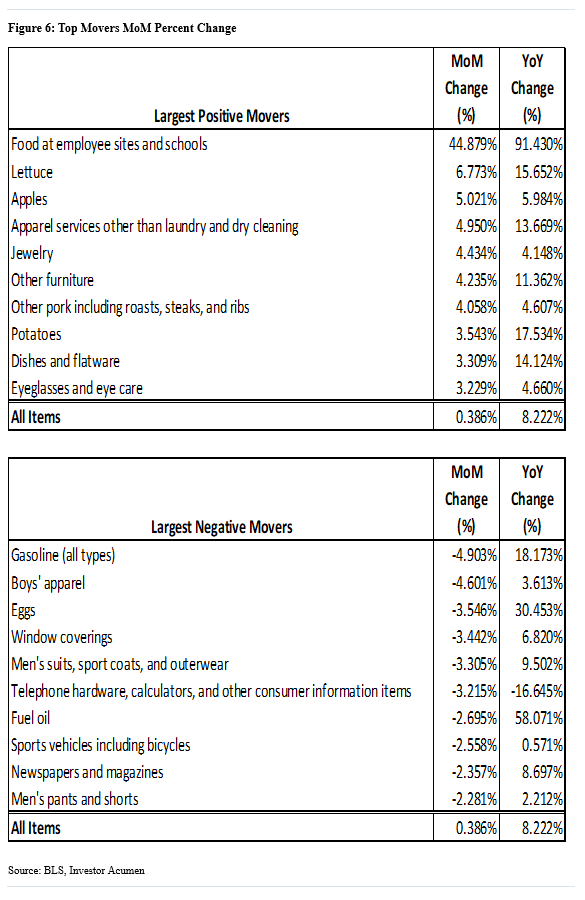
Implications for Policy and Economic Performance
In this section we review the potential implications of this month’s CPI report on policy (monetary and or fiscal) and the overall outlook for the US economy.
Policy Implications
This month’s CPI report – in which both All Items and Core inflation increased significantly more than expected – incrementally increases pressure on the Fed to tighten monetary even more than the Fed had planned and more than the market has been expecting. Various details of the CPI report, including acceleration of key “sticky” components of core CPI, provides the Fed with no leeway to “pivot” toward a more dovish policy.
The US Federal Reserve is mandated by law to promote both full price stability and “full employment.” Let us first consider price stability aspect of the Fed’s mandate. All Items CPI and Core CPI are rising at a YoY rate of 8.2% and 6.6%, respectively. These levels of inflation surpass, by an extreme margin, the Fed’s long-term YoY target level of 2.0%. In the past two months, Core CPI is running at an annualized rate of over 7%, which represents an acceleration relative to the YoY figure and is dramatically higher than the Fed’s target of 2.0%. This suggests the need for the Fed to implement a monetary policy that’s significantly tighter than normal.
Regarding the employment mandate, various indicators (e.g. unemployment rate, initial claims, continuing claims, job openings, quit rate) strongly suggest that the labor market is operating at “hot” levels and/or rates of change which are not compatible, in the long run, with price stability and overall macroeconomic conditions supportive of a stable full employment regime. Thus, current conditions in the labor market suggest the need for the Fed to implement a monetary policy that is significantly tighter than normal.
Taking into account the Fed’s dual mandates regarding both price stability and employment, it’s clear that, under current conditions, the Fed’s monetary policy should be oriented to foster overall financial conditions that would be considered tighter than normal.
In sum, this month’s CPI incrementally increases pressure on the Fed to use its policy tools to further tighten overall financial conditions. This is even more true when you look at the details of this CPI report. Of particular concern, is the fact that this month’s high CPI reading was driven by high and/or accelerating Core CPI figures and particularly for the so-called “sticky” components of Core CPI. By their nature, these sticky components will tend to stay at elevated levels of MoM change for a long time. It is therefore becoming increasingly unlikely that core or overall CPI will decelerate in the next six months, in the manner that the Fed and markets currently have projected.
The higher-than-expected core number, and particularly the acceleration of “sticky” core items, will most likely raise expectations regarding how much, how fast and for how long the Fed may increase the Federal Funds interest rate. The market’s estimate of the so-called “terminal rate” – i.e. the peak in the Fed Funds rate for this tightening cycle – will most likely increase substantially. As of this writing the implied terminal rate in the Fed Funds futures market has risen by approximately 25 basis points, and I expect this to probably increase in coming weeks. This rise in the expected path of Fed Funds interest rate hikes will, in turn, tend to place upwards pressure on the cost of financing across the economy. Furthermore, at some point, depending on the level of tightness or ease that is manifest in overall financial conditions, the Fed could choose to adjust its currently announced pace of quantitative tightening (QT).
Economic Performance Implications
High levels of inflation have historically led to periods of sub-par economic performance I the US. One reason is intrinsic: A highly developed economy such as the US, characterized by extremely elaborate and complex financial relationships and supply chains, simply does not perform optimally with inflation that is high and/or when prices are unstable. The second reason is that high inflation is generally associated with an increased cost of financing and lower levels of accessibility to capital.
Therefore, in line with economic theory and empirical precedent, the currently high levels of inflation being experienced in the US are likely to result in a period of sub-par economic performance in the overall US economy, at some point during the next 1-2 years. This is likely to include, among other things, lower-than-normal rates of growth in production, relatively stagnant real incomes, higher-than normal levels of job stability and unusually high volatility in capital markets. High inflation is also associated with an elevated risk of economic recession.
Potential Financial Markets Impacts
Financial asset prices tend to benefit from inflation that’s low and stable. We will cite two reasons for this, among others. The first reason is that low and stable inflation tends to minimize nominal yields, real yields and various types of risk premia that are embedded into the discount rates used to value financial assets. The second reason is that, to the extent that inflation is low and stable, there is relatively little risk that the Fed might implement policies that are contrary to the expectations and/or desires of market participants – i.e. “Fed risk” is minimized.
Regarding the first factor, the rate of inflation is currently relatively high and unstable causing discount rates to increase to levels that are higher than they otherwise would be. On the margin, today’s CPI report, which revealed hotter-than-expected All Items CPI and particularly Core CPI, can be expected to cause an increase in inflation expectations, risk premia and overall discount rates throughout the economy. All else being equal, this would normally be expected to place downward pressure on asset prices such as bonds and common stocks.
Regarding the second factor, today’s CPI report, on the margin, may increase risk perceptions regarding the probability of the Fed tightening monetary policy. In particular, market expectations of the Fed’s so-called “terminal rate” will likely increase, causing the cost of financing to increase and overall financial conditions to tighten. This will tend to lead to an overall increase in discount rates and downward pressure on asset prices throughout the economy.
In sum, all other factors remaining equal, this month’s CPI report may be expected to potentially lead to an increase in discount rates (via increased inflation expectations + risk premia), negatively impacting market prices within many asset classes such as bonds and common stocks. Due to the fact that sticky price CPI components are increasing at a very high rate, it’s likely that inflationary pressures will continue to problematic for markets during the remainder of 2022 and during much of 2023.
Be the first to comment