

MediaProduction
Background
For those interested in John and Jane’s full background, please click the following link for the last time I published their full story. Here are the key details about John and Jane that readers should understand.
- This is a real portfolio with actual shares being traded.
- I am not a financial advisor and merely provide guidance based on a relationship that goes back several years.
- John retired in January 2018 and his only consistent source of income is Social Security.
- John has begun drawing $1,000/month from his Traditional IRA to supplement his retirement income.
- Jane officially decided to retire on December 31, 2020. She is now collecting social security as her primary source of income.
- John and Jane have other investments outside of what I manage. These investments primarily consist of minimal risk and minimal yield certificates.
- John and Jane have no debt and no monthly payments other than basic recurring bills such as water, power, property taxes, etc.
John and Jane requested my help after we discovered that their financial advisor was charging excessive fees and engaging in trades that appeared to be more favorable to the advisor than it was to John and Jane. I do not charge John and Jane for anything that I do and all I have asked of them is that they allow me to write about their portfolio anonymously to help spread knowledge and to make me a better investor in the process.
Generating a stable and growing dividend income is the primary focus of this portfolio, and capital appreciation is a secondary characteristic.
Dividend Decreases
No stocks in John’s Traditional or Roth IRA put/decreased dividends during the month of August.
Dividend And Distribution Increases
One company paid increased dividends/distributions or a special dividend during the month of August in the Traditional and Roth IRAs.
Lowe’s
When it comes to hobbies there are a few things I enjoy more than working in my shop doing everything from woodworking to restoring my 1967 Ford Mustang. I am now also the proud owner of a 3-ton excavator and the thought of greasing the zerk fittings and performing maintenance on it always gets me excited. That said, I would consider myself to be a Home Depot (HD) guy primarily because I am a Milwaukee tool junky with the Milwaukee Packout containers that have foam inserts with cutouts so that each tool has its place.
When it comes to investing my preference leans towards Lowe’s (even though I personally hold shares in both companies) because of its extremely low payout ratio. When you compare HD and Lowe’s they offer a phenomenal but nearly identical 10-year average dividend growth rate of 20%. HD currently offers a higher dividend yield by approximately 50 basis points. Still, the most recent dividend increase offered by Lowe’s was double that of HD (Lowe’s provided a 31.3% increase while HD provided a 15.2% increase). As mentioned before, Lowe’s has a superior payout ratio of 27% compared to HD’s 45% which suggests that the dividend increases offered by Lowe’s should continue to increase at a faster pace.
The last time that the market saw 6% interest rates were in 2008 and this was also the last time that housing prices reached a peak in the United States. The difference now is that we recently reached peak house pricing when interest rates were at some of the lowest levels ever recorded. As housing prices recede from their record highs I believe we will continue to see retailers like Lowe’s and HD benefit from consumers who choose to utilize the equity in their homes to make improvements. We are quickly changing from a sellers’ market environment to a motivated seller/buyer market which means that the number of housing sales should drop considerably.
On the most recent pullback, we came close to adding additional shares but the share price never drop below the $180/share threshold that we wanted to see before adding additional shares. Shares are still at a compelling price for those looking to establish a position as evidenced by the 10-year dividend yield because rarely does the stock trade for a yield over 2% (the current yield is actually 2.17% so the yield in the chart below is showing prior to the dividend increase).
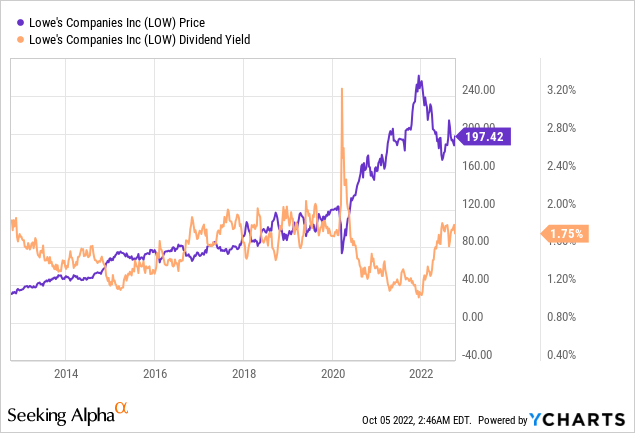
The dividend was increased from $.80/share per quarter to $1.05/share per quarter. This represents an increase of 31.3% and a new full-year payout of $4.20/share compared with the previous $3.20/share. This results in a current yield of 2.17% based on the current share price of $197.42.
Retirement Account Positions
There are currently 39 different positions in John’s Traditional IRA and 22 different positions in his Roth IRA. While this may seem like a lot, it is important to remember that many of these stocks cross over in both accounts and are also held in the Taxable Portfolio.
Below is a list of the trades that took place in the Traditional IRA during the month of August.
Traditional IRA – August Trades (Charles Schwab)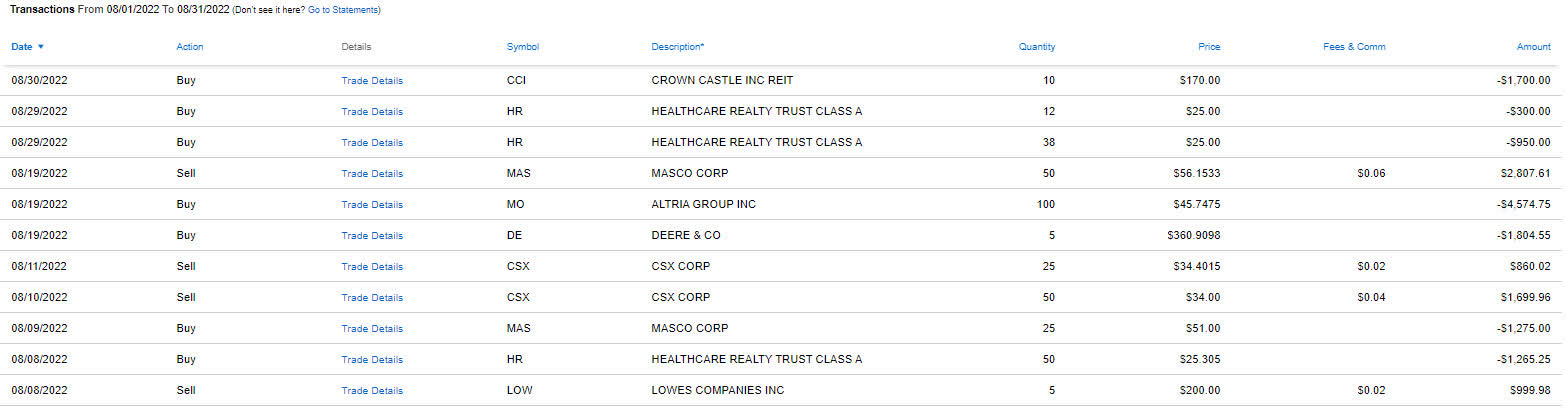
Below is a list of the trades that took place in the Roth IRA during the month of August.
Roth IRA – August Trades (Charles Schwab)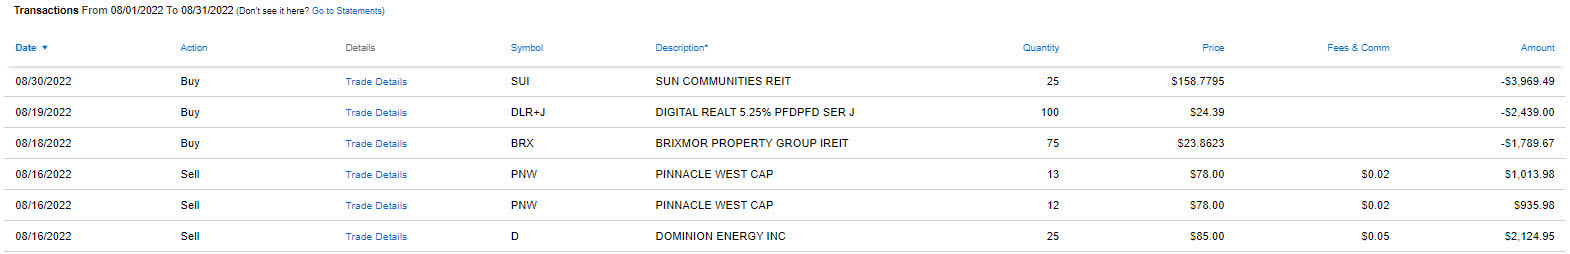
Please see my articles that discuss trades more in-depth. The most recent article regarding trades and potentially actionable information. This article can be found at the attached link.
The Retirees Dividend Portfolio: Recent Purchases And Limit Trades Through September 17th
August Income Tracker – 2021 Vs. 2022
August’s income for the Traditional IRA was up considerably and the Roth was up slightly year-over-year. The average monthly income for the Traditional IRA in 2022 is projected to be up about 29.3% based on current estimates, and the Roth IRA is looking to grow by an astounding 16.5% year-over-year. This means the Traditional IRA would generate an average monthly income of $1,420.35/month and the Roth IRA would generate an average income of $657.45/month. This compares with 2021 figures that were $1,098.38 and $564.25 per month, respectively. We are on track to generate approximately $4,800 of additional dividend income in 2022 from the combined dividends in the Traditional and Roth IRAs.
It should be noted that the huge increase in dividend income in the Traditional IRA can largely be attributed to the significant special dividend paid by Healthcare Realty (HR) that was elaborated on in the July article for John.
SNLH = Stocks No Longer Held – Dividends in this row represent the dividends collected on stocks that are no longer held in that portfolio. We still count the dividend income that comes from stocks no longer held in the portfolio even though it is non-recurring.
All images below come from Consistent Dividend Investor, LLC. (Abbreviated to CDI).
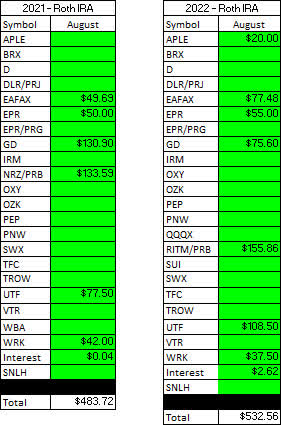
Traditional IRA – August – 2021 V 2022 Dividend Breakdown (CDI) Roth IRA – August – 2021 V 2022 Dividend Breakdown (CDI)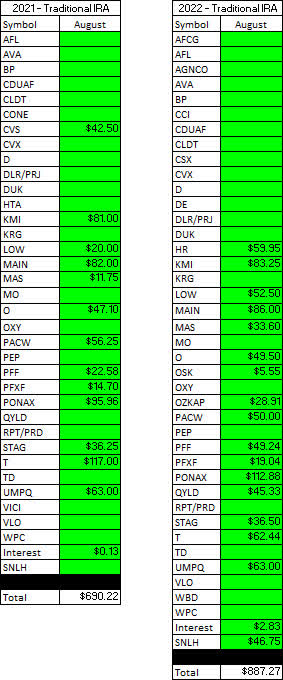
Here is a graphical illustration of the dividends received on a monthly basis for the Traditional and Roth IRAs.
Retirement Account – Monthly Dividends Received – August 2022 (CDI)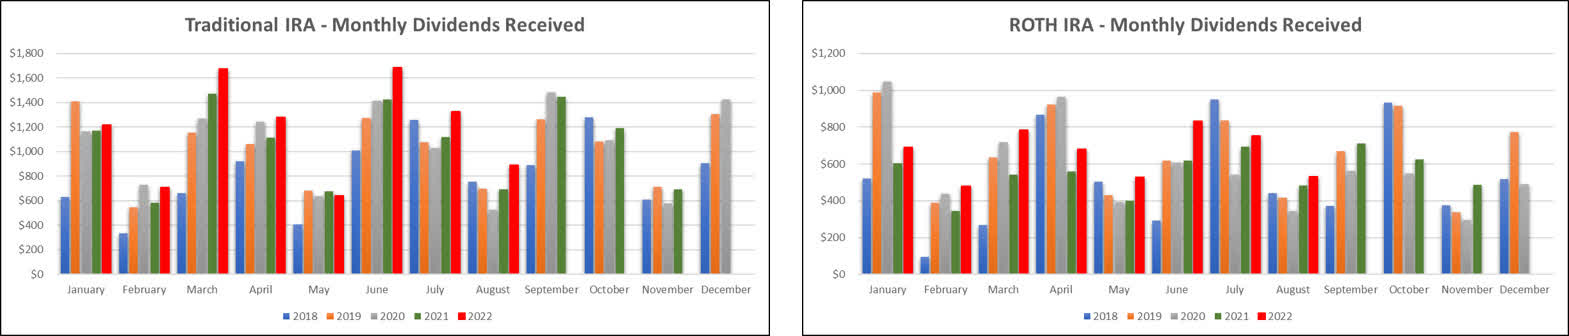
Based on the current knowledge I have regarding dividend payments and share count, the following tables are a basic prediction of the income we expect the Traditional IRA and Roth IRA to generate in FY-2022 compared with the actual results from 2021.
Retirement Projections – August 2022 (CDI)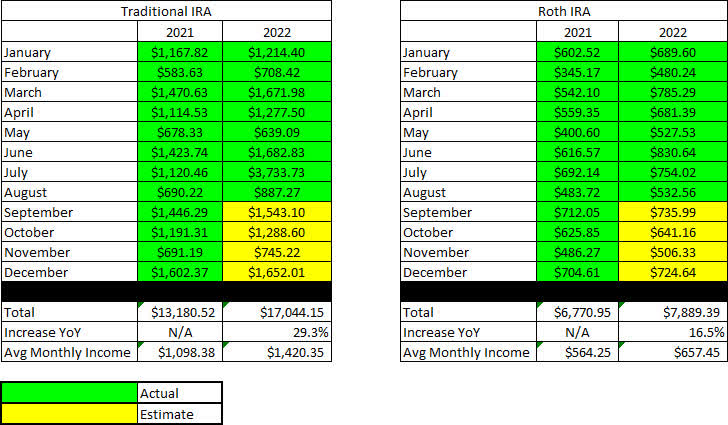
Below is an expanded table that shows the full dividend history since inception for both the Traditional IRA and Roth IRA.
Retirement Projections – August 2022 – Full Dividend History (CDI)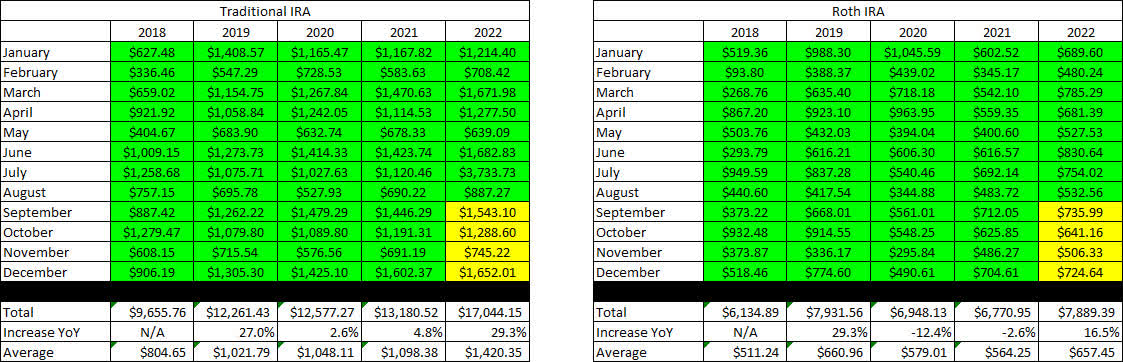
I have included line graphs that better represent the trends associated with John’s monthly dividend income generated by his retirement accounts. The images below represent the Traditional IRA and Roth IRA, respectively.
Retirement Account – Monthly Dividends – August 2022 (CDI)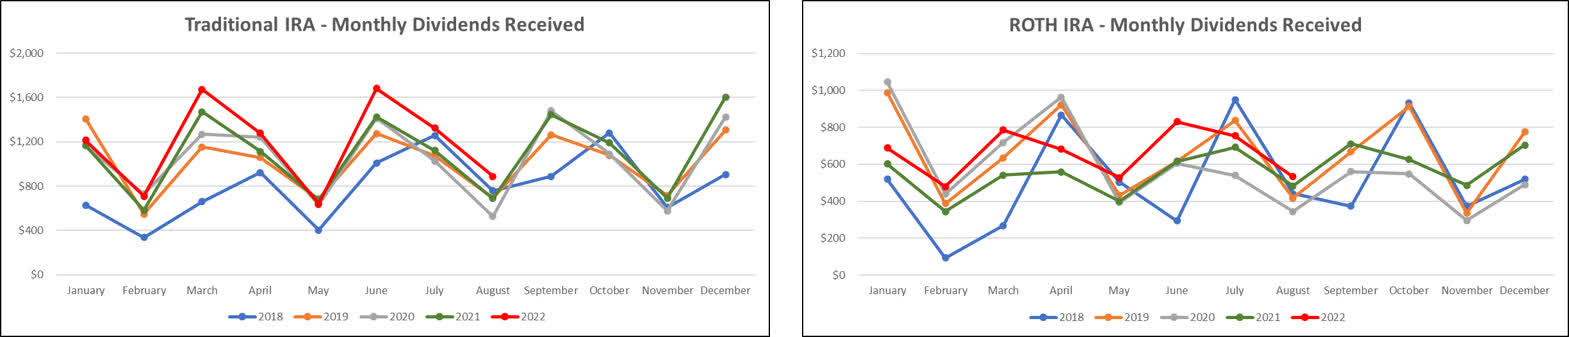
Here is a table to show how the account balances stack up year over year (I previously used a graph but believe the table is more informative).
Retirement Account – Month End Balances – August 2022 (CDI)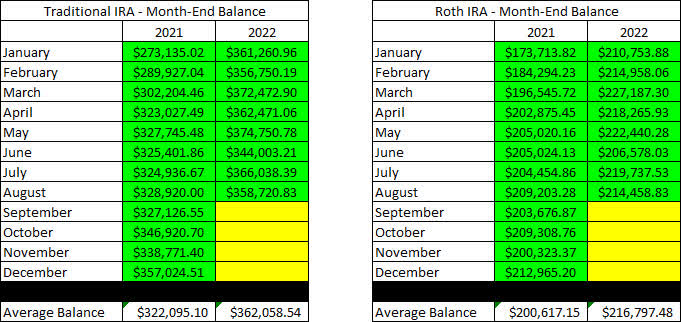
The next images are the new tables that indicate how much cash John had in his Traditional and Roth IRA Account at the end of the month, as indicated on his Charles Schwab statements.
Retirement Accounts – August 2022 – Cash Balances (CDI)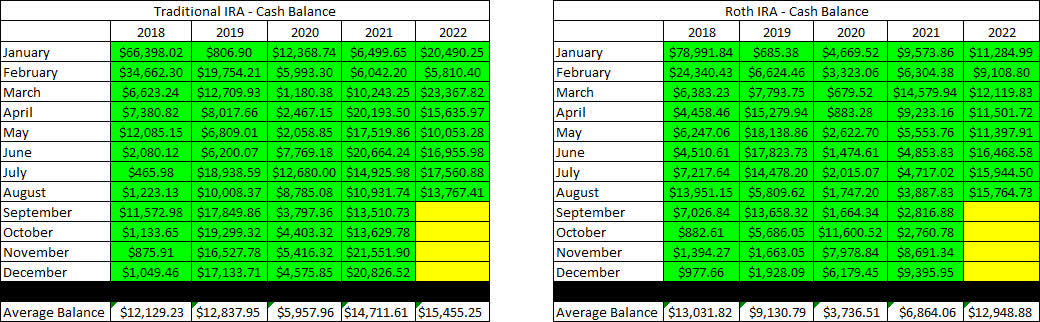
The following two tables provide a history of the unrealized gain/loss at the end of each month in the Traditional and Roth IRAs, going back to the beginning of January 2018.
Retirement Accounts – August 2022 – Unrealized Gain-Loss (CDI)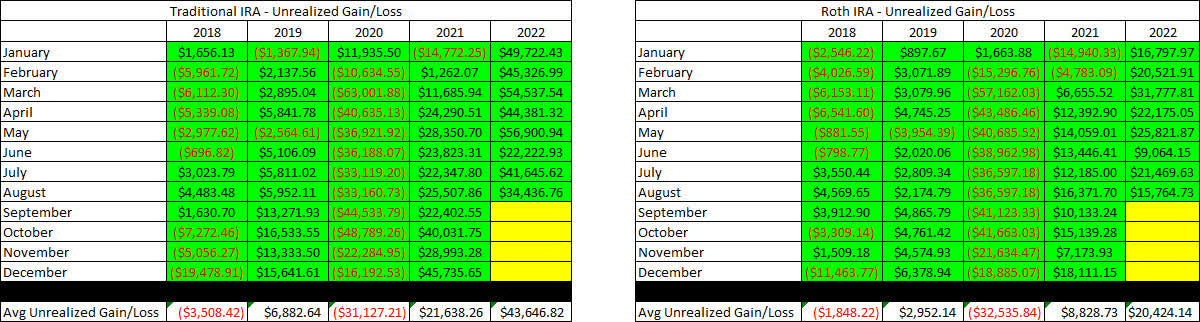
John has finally begun taking disbursements from his Traditional IRA, and he has opted to receive $1,000/month. Based on the dividend income generated he could take up to $1,400/month from the Traditional IRA before his withdrawals would start to negatively impact his principal. Our goal for John is to maintain withdrawals below the dividend income generated for as long as possible.
Traditional IRA Withdrawals – August 2022 (CDI)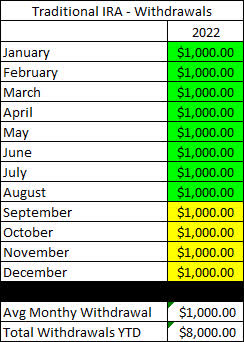
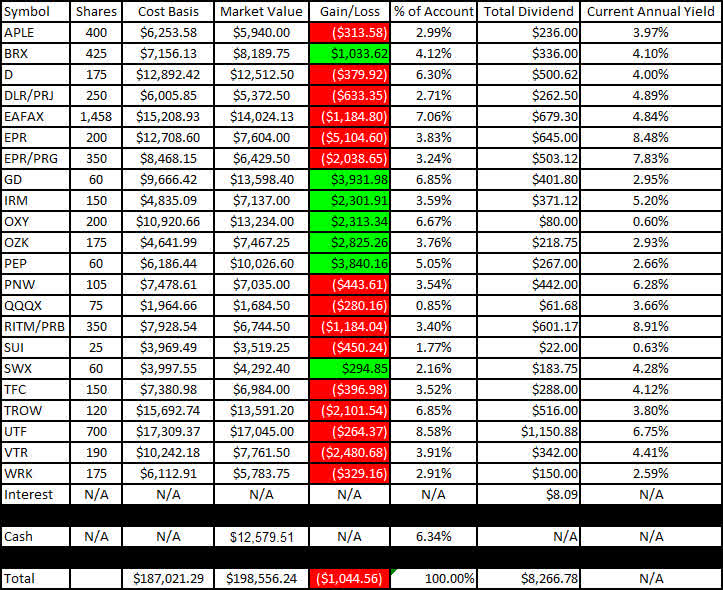
I like to show readers the actual unrealized gain/loss associated with each position in the portfolio because it is important to consider that, in order to become a proper dividend investor, it is necessary to learn how to live with volatility. The market value and cost basis below are accurate as of the market close on October 5, 2022.
Here is the unrealized gain/loss associated with John’s Traditional and Roth IRAs.
Traditional IRA – August 2022 – Gain-Loss (CDI) Roth IRA – August 2022 – Gain-Loss (CDI)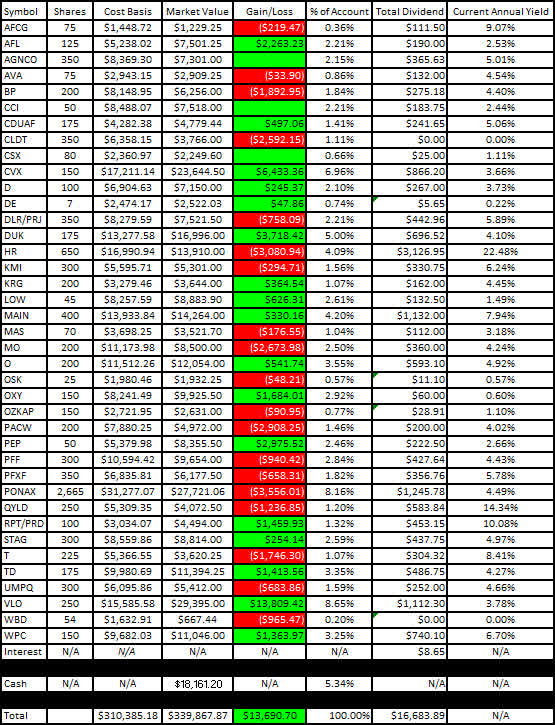
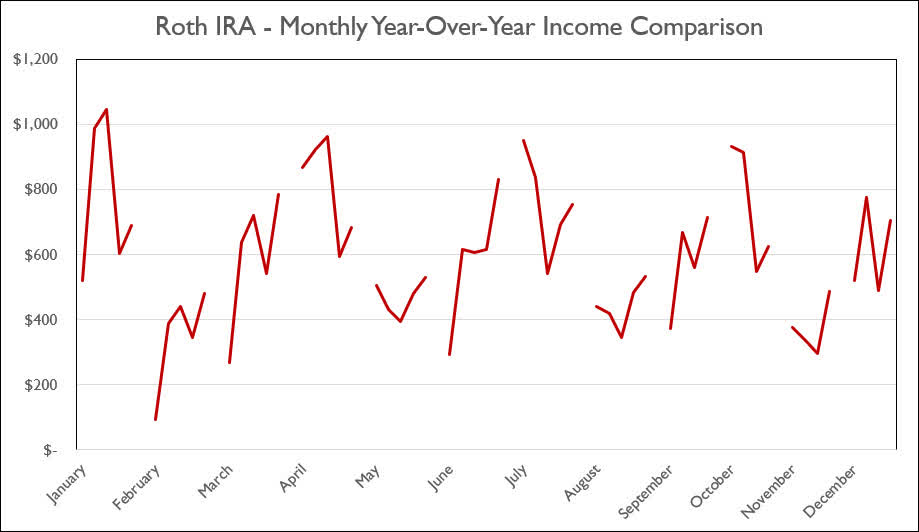
The last two graphs show how dividend income has increased, stayed the same, or decreased in each respective month on an annualized basis. Now that we are in our fifth year of tracking, the trend for each respective month of the year has begun to show interesting trends for when income increases year-over-year.
Traditional IRA – August 2022 – Annual Month Comparison (CDI) Roth IRA – August 2022 – Annual Month Comparison (CDI)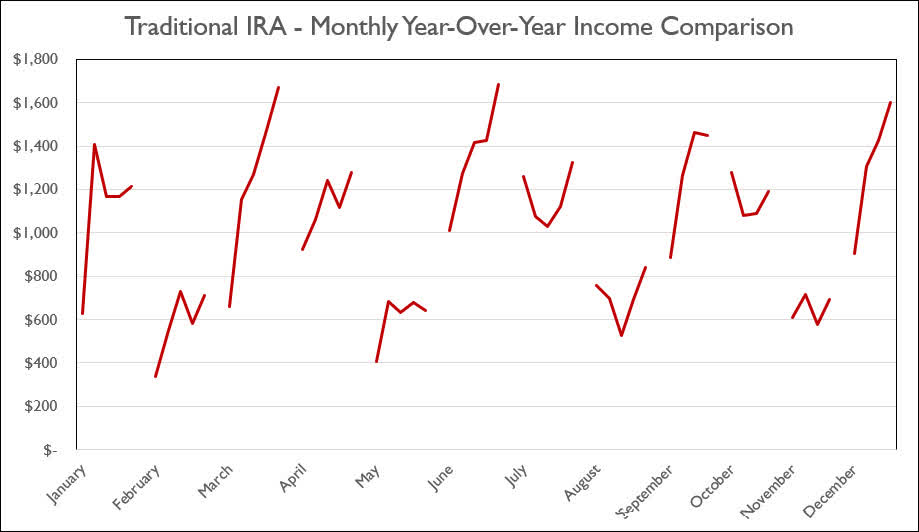
Conclusion
The last month has been tough on the value of the investments and we have liquidated or trimmed some positions as we build up cash in favor of buying new investments or allocating funds to brokered CDs. We recently allocated some of the funds in the Taxable Account to a 3-month brokered CD at 3.35%.
In my article Stocks You Should Consider Selling In Favor Of Brokered CDs I discuss some of the characteristics that I look for when selling shares of stocks in favor of pooling up funds for brokered CD’s because a 3.35% yield can be pretty darn attractive. Below is the primary takeaway from that article:
- The dividend yield is at the low end compared to its historical yield over the last 10 years.
- The stock price is at the high end compared to its historical price over the last 10 years.
- The dividend yield is near or below the three-month Brokered CD rate of 3.35%
One way to think about the bullet points is that the more of these that are true (sometimes it could be only 1/3 or 2/3 are true) then the more likely it is that a larger number of shares were sold.
August Articles
I have included the links for John and Jane’s Taxable Account and Jane’s Retirement Account articles for the month of August below.
The Retirees’ Dividend Portfolio: John And Jane’s August Taxable Account Update
The Retiree’s Dividend Portfolio – Jane’s August Update: Dividend Income Set To Double After 5 Years
Article Format: Let me know what you think about the format (what you like or dislike) by commenting. I appreciate all forms of criticism and would love to hear what I can do to make the articles more useful for you!
In John’s Traditional and Roth IRAs, he is currently long the following mentioned in this article: AFC Gamma (AFCG), Aflac (AFL), Apple Hospitality REIT (APLE), Avista (AVA), BP plc (BP), Brixmor Property Group (BRX), Crown Castle (CCI), Canadian Utilities (OTCPK:CDUAF), Chatham Lodging Trust (CLDT), Chevron (CVX), CSX (CSX), Dominion Energy (D), Deere (DE), Digital Realty Preferred Series J (DLR.PJ), Duke Energy (DUK), Eaton Vance Floating-Rate Advantage Fund (EAFAX), EPR Properties (EPR), EPR Properties Preferred Series G (EPR.PG), General Dynamics (GD), Healthcare Trust of America (HTA), Iron Mountain (IRM), Kinder Morgan (KMI), Kite Realty Group (KRG), Lowe’s (LOW), Main Street Capital (MAIN), Masco (MAS), Altria (MO), New Residential Investment Corp. Preferred Series B (NRZ.PB), Realty Income (O), Oshkosh (OSK), Occidental Petroleum Corp. (OXY), Bank OZK (OZK), Bank OZK Preferred Series A (OZKAP), PacWest Bancorp (PACW), PepsiCo (PEP), iShares Preferred and Income Securities ETF (PFF), VanEck Vectors Preferred Securities ex Financials ETF (PFXF), Pinnacle West (PNW), PIMCO Income Fund Class A (PONAX), Nuveen Nasdaq 100 Dynamic Overwrite Fund (QQQX), Global X Funds Nasdaq 100 Covered Call ETF (QYLD), RPT Realty Preferred Series D (RPT.PD), STAG Industrial (STAG), Sun Communities (SUI), Southwest Gas (SWX), AT&T (T), Toronto-Dominion Bank (TD), Truist Financial (TFC), T. Rowe Price (TROW), Cohen & Steers Infrastructure Fund (UTF), Valero (VLO), Umpqua Holdings (UMPQ), Ventas (VTR), WestRock (WRK), Warner Bros. Discovery (WBD), and W. P. Carey (WPC).
Be the first to comment