

cemagraphics
In my last view on markets, I asked whether inflation fears had peaked. Judging by the price action since, the answer would seem to be “yes”, tentatively. It’s a cliché, but true. Markets trade at the very thin margin of the flow of economic information, and this edge has shifted in the past month. Inflation is still high, but it is no longer accelerating rapidly, and evidence of increasingly fragile economic activity is piling up. The headline surveys have weakened materially, especially in Europe, and we recently learned that the US economy entered a technical recession in the first half of the year. For markets, this means monetary policy tightening will be less pervasive, both in terms of speed and sustainability. Upside inflation surprises now are associated with sharp flattening, even inversion, of interest rate curves, as markets perceive the window for policy tightening closing fast.
This, predictably, has led to a rally in bonds and a corresponding rebound in interest rate-sensitive equity sectors, the latter which has driven up major indices. Whether such Goldilocks sentiment persists is far from clear, in my view, but it is visible in the behaviour of investors all the same.
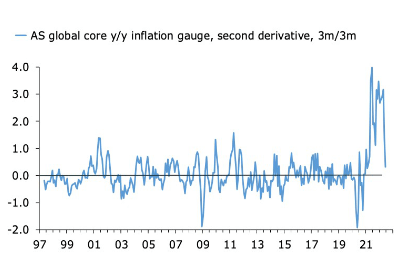
I’ll start with inflation. Looking solely at the first chart below, you would be excused for concluding that nothing has changed. Squint, however, and you should be able to see that core inflation is now rolling over. The second chart shows the second derivative, which has now collapsed. As I was saying, markets trade at the thin margin of the economic data.
Fig. 01. Still High… (Author) Fig. 02. But The Core Is No Longer Surging (Author)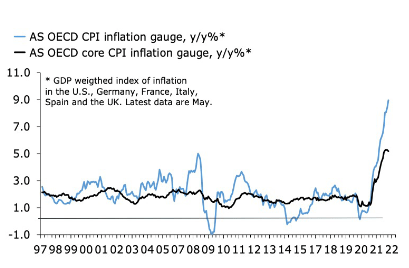
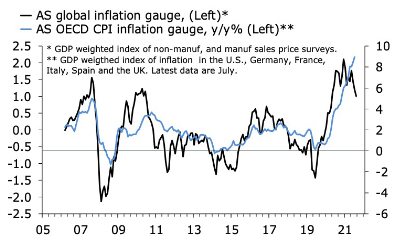
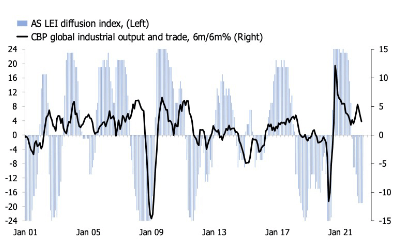
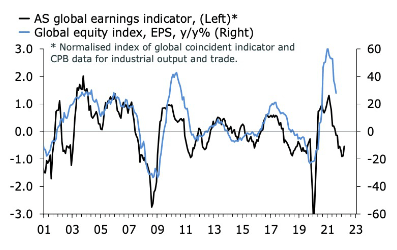
The message of somewhat less-threatening inflation also is visible in the surveys. The first chart below shows that selling price expectations in both manufacturing and services have softened recently. Surveyed price expectations in the industrial sector are now clearly rolling over, while the trend in services is one of stabilisation. The second chart below shows that the two in combination signal a peak in developed market headline inflation.
Fig. 03. Rolling Over (Author) Fig. 04. DM Headline Inflation Will Soon Peak (Author)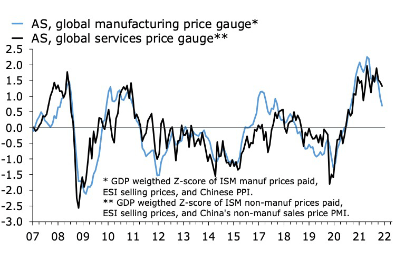
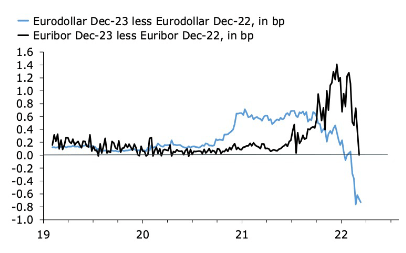
That’s great, but we are yet to see convincing signs of softening in the US CPI, which, after all is the one markets look at. Perhaps we’ll get some relief from the July print. I am not holding my breath, but even if we don’t, bond markets are now singing a different tune. Yield curves have flattened sharply in the past month. The 2s10s are now inverted in the US and in the UK, pointing to plenty of scope for further flattening in Germany. In interest rates futures, the Dec-23/Dec-22 Eurodollar curve is now under water by a whopping 80bp, and in Europe, the corresponding euribor curve has sunk to zero. Put differently, fixed-income markets are signalling that central banks are about to over-tighten policy, so much so that they will have to cut rates next year.
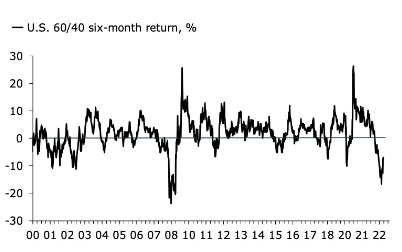
It might seem strange that equities would celebrate such a shift, but then again, maybe not. It is a good indication that stock markets fear a sustained rise in interest rates much more than they fear an earnings-destroying economic slowdown. Chart 7 below shows that the otherwise down-beaten 60/40 strategy is now staging a comeback from a depressed level. From a quantitative perspective, you’d would be wise not to bet against a continuation of this rebound.
Fig. 05. Too Much Tightening? (Author) Fig. 06. 2023 Will Be Nothing Like 2022 (Author) Fig. 07. A Lazarus Moment? (Author) Fig. 08. Volatility Is Still Rising (Author) Fig. 09. Cyclical Headwinds (Author) Fig. 10. EPS Growth To Slow Further (Author)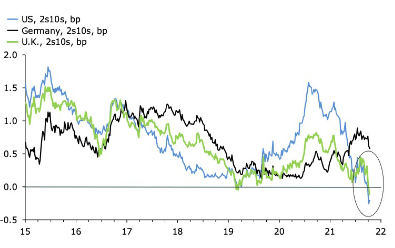
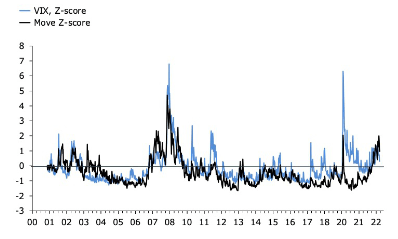
Fundamentally, however, the story is a bit more complicated. For starters, volatility is still elevated in both equities and fixed income, and it is showing few signs of softening. More importantly, the equity leg of a 60/40 strategy still looks vulnerable to cyclical headwinds for the economy. That is, this is true unless we are now back in a tech-/growth-led multiple-driven market, where earnings either don’t matter or are insensitive to standard macro fluctuations. It’s possible that we are, but I remain sceptical that we are back to Goldilocks just yet. As a result, I am unwilling to bet the farm on the pivot.
Editor’s Note: The summary bullets for this article were chosen by Seeking Alpha editors.
Be the first to comment